Análisis de huella
En el pasado, este tipo de datos requería muchos recursos de desarrolladores para indexar y organizar. Aunque sabemos que los datos de blockchain son transparentes, no significa que puedas obtener datos en cadena y entenderlos fácilmente y correctamente.
Pero si bien gran parte de los datos críticos, como transacciones, monederos y precios, son transparentes, apenas tienen significado para la mayoría de las personas. Las cadenas de números y letras en la cadena de bloques deben ser indexadas para tener sentido, y existen docenas de plataformas para ayudar al público en general a comprender lo que está sucediendo en la web3.
Pero, ¿de dónde obtienen estos plataformas sus datos?
¿Qué hay de las empresas y organizaciones que necesitan datos altamente específicos para su uso interno, como VCs y proyectos de GameFi?
Hasta hace poco, la mayoría de los desarrolladores construían sus SDKs para ETL de datos, una estrategia costosa y difícil de mantener. Ahora, hay varias empresas de DaaS (Database-as-a-Service) que lo hacen más fácil. Si bien Footprint Analytics es una de esas plataformas, va más allá de lo que ofrecen otros en cuanto a amplitud y opciones de personalización.
Al proporcionar acceso a datos históricos de 24 cadenas, incluidas las cadenas de juegos (mucho más que cualquier otro proveedor), 17 mercados de NFT y casi 2,000 protocolos de GameFi junto con sus activos en el juego, Footprint Data API es una API unificada para desarrolladores de blockchain de todos los ámbitos, en toda la industria.
Ahora, solo se necesitan unos minutos para realizar un análisis de datos multi-sectoriales de la cadena de bloques.
Este artículo explicará cómo realizar un seguimiento del flujo de efectivo utilizando la función de análisis de huella dactilar tomando la moneda estable como ejemplo.
・ Mundo cripto vs Mundo real
En el mundo real, varios tipos de oferta monetaria generalmente se clasifican como M0, M1, M2, M3. En el mundo cripto, una vez que intercambias dinero fiduciario a través de OTC o algo más, todas estas criptomonedas son casi rastreables cuando interactúan con un cierto tipo de billetera o algún protocolo. Los gobiernos suelen emitir la moneda a través de sus bancos centrales, mientras que esos contratos inteligentes emiten criptomonedas ya sea a través de contratos inteligentes o mediante algún mecanismo de recompensa.
Algunos mercados secundarios te permitirán intercambiar tu activo a cambio, esto es similar para las criptomonedas, pero además, parte del volumen proviene de DEX.
Por lo tanto, todos estos escenarios que mencionamos anteriormente, vamos a echar un vistazo a lo que sucedió utilizando la plataforma de análisis de datos en cadena.
Mint, Quema y Transferencia de Tokens
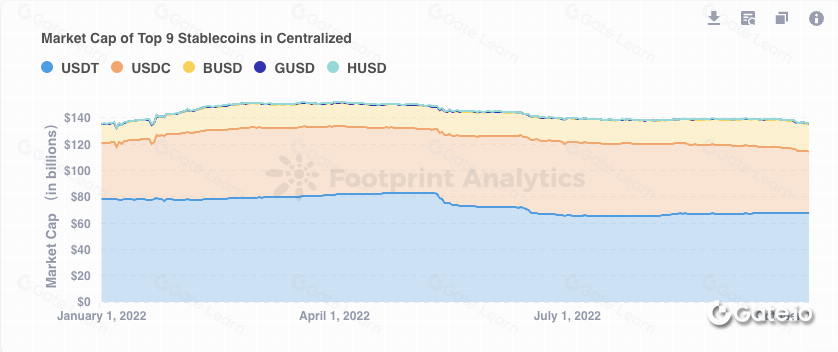
En primer lugar, hablemos sobre la distribución de stablecoins en los últimos tiempos, puedes seguir esta información a través deeste gráficoComo puedes ver, USDT & USDC ocuparon la mayor parte de la cuota de mercado de manera bastante estable durante el año pasado.
Qué sucederá cuando se cree y queme un token, podrás hacer un seguimiento desde aquíconsulta(mint)y estoconsulta(quemar)
Hay algunos escenarios interesantes para la quema de tokens,
- Uno es un comportamiento normal quemado :
seleccionar * de
transferencias de tokens de Ethereum
donde 1=1
y to_address = ‘0x0000000000000000000000000000000000000000’
y transaction_hash = ‘0x2953d30a67abf584f673561abe6879ef0ffde33af4577dd1eee043adac93a9da’ — burn
y block_timestamp >= fecha('2023-01-03') y block_timestamp <= fecha('2023-01-06')
límite 100
- Otra transacción está cruzando diferentes blockchains :
seleccionar * desde
transferencias de tokens ethereum
donde 1=1
y to_address = ‘0x0000000000000000000000000000000000000000’
y transaction_hash = ‘0x3e76dd4c4c2ca3e4662964ad936e90c5dc82fad8956cfcbd6f1d5191a013e1a1’ —bridge
y block_timestamp >= fecha('2023-01-03') y block_timestamp <= fecha('2023-01-06')
límite 100

- La transferencia de tokens es el caso más común, por lo que no explicaré muchos detalles, ten en cuenta que nuestro oro está rastreando la moneda estable, usaremos esta información clave: token_address para filtrar la moneda estable

Y generalmente tendremos una tarifa de transacción, entonces, ¿quién recibe esta tarifa como recompensa, puedes rastrearlas en esta [consulta](https://www.footprint.network/chart/miner-fee-fp-35761):
seleccionar * de “bloques de ethereum”
donde 1=1
y hash = '0x6579fc0e9adf0cb4eb8db8dcb49558357f9830bcca3d0e8f1a37f034fc98a8fb'
y la marca de tiempo >= fecha('2023-01-03') y la marca de tiempo <= fecha('2023-01-06')

Seguimiento del flujo de efectivo de CEX y moneda estable
Después de que conozcamos la transferencia básica, y en este escenario, necesitamos:
- tener etiquetas en la billetera para filtrar la billetera de CEX
- Conoce la token_address de la moneda estable
Afortunadamente, esto es hecho por la comunidad y el equipo de análisis de Footprint. Podrías encontrar estas etiquetas en la tabla de entity_tag y la dirección del token de moneda estable en aquí

Después de que este material esté listo, necesitamos desglosarlo en varios pasos:
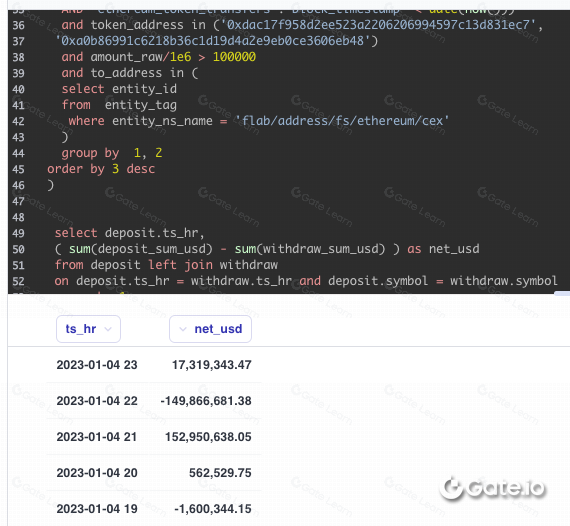
- El primer paso es encontrar una moneda estable para transferir hacia o desde CEX,aquí. Dado que todo el proceso es un poco complejo, utilizamos la función de análisis de huella digital de lamodelotabla, como una tabla temporal para almacenar los datos para que podamos consultar más tarde desde otra consulta.
Para hacer que tus datos sean más intuitivos para tus equipos, puedes preguntar a pregunta, ya sea en el constructor de consultaso elEditor SQL, para crear tablas derivadas en Metabase, llamadasmodelosque puede reunir datos de diferentes tablas. Puede agregar columnas personalizadas y calculadas, y anotar todas las columnas con metadatos para que las personas puedan jugar con los datos en el generador de consultas como punto de partida.
- Segundo paso: consultar el precio de ethereum usando esta consulta:
con precio_eth como (
SELECCIONAR
DATE_FORMAT( “timestamp” ,’%Y-%m-%d %H’) AS ts_hr ,
avg(“price”) COMO “avg_price”
DESDE "token_price_5min"
DÓNDE (“chain” = ‘Ethereum’)
Y "token_symbol" = 'ETH'
Y "marca de tiempo" >= fecha(fecha_add('día',-90,ahora()))
Y "marca de tiempo" < ahora())
AGRUPAR POR 1
ORDENAR POR 1 ASC
)
- Tercero: combinar estos para verificar la relación entre la suma móvil de entrada neta y el precio de ETH
- Este resultado contiene flujo neto entrante y suma móvil de flujo neto en 4 tick(cada hora), los trucos en el recuadro rojo del siguiente gráfico están utilizando la función de análisis de huella : tabla de modelo

Cuarto: para verificar el gráfico para ver si puedes encontrar alguna relación entre el flujo neto y el movimiento de precios
Una cosa interesante es: echa un vistazo cuando el precio caiga mucho causado por el colapso de FTX alrededor del 8 de noviembre de 2022, muchas transferencias de flujo neto hacia CEX intentaron comprar la caída

- Por último, si no pudo encontrar un patrón entre esos movimientos de precios y el flujo neto, es normal que el trading no sea tan fácil, ya que contiene muchos factores. Pero sugiero que si quieres profundizar más, podrías descargar los datos, usar Python para calcular los detalles, también ajustar diferentes conjuntos de parámetros de SQL y descargar diferentes conjuntos de parámetros y usar Python para calcular la correlación.
Después de todo, esto requiere mucho trabajo matemático, pero al menos la huella te ayuda mucho para hacer el trabajo sucio relacionado.
Podrías duplicar mi panel de controlaquíy ajustar o rehacer todo esto desde cero.
Seguir la entrada y salida de CEX es solo parte del trabajo. Probablemente hagas más, como rastrear cómo el dinero interactúa con el protocolo DEX y otros protocolos. Podrías verificar los detalles de esta consulta.Interacción DEXy Interacción de préstamo.
Una vez que encuentres el patrón que necesitas, podrías usar la función de alerta de análisis de huella para una fluctuación significativa de tus métricas. Incluso podrías usar nuestra API REST y API SQL para construir tu propia aplicación.
API
Footprint Analytics tiene el almacén más completo de datos en cadena indexados, cubriendo 23 cadenas, 14 mercados de NFT, más de 1.900 proyectos de GameFi y más de 100.000 colecciones de NFT.
Permite a los desarrolladores hacer llamadas desde una base de datos que contiene datos estructurados para todos estos protocolos con una sola consulta, o personalizar fácilmente la API de datos cuando sea necesario. Dado que la API es de dominio cruzado, los usuarios pueden acceder a datos de NFT, GameFi y direcciones a través de una sola herramienta. Los filtros de lavado de operaciones brindan a los usuarios la opción de filtrar datos sin sentido y fraudulentos.