・Phân tích Footprint
Trong quá khứ, loại dữ liệu này đòi hỏi rất nhiều tài nguyên của nhà phát triển để chỉ mục và tổ chức. Mặc dù chúng ta biết rằng dữ liệu blockchain là minh bạch, nhưng điều đó không có nghĩa là bạn có thể dễ dàng và chính xác lấy dữ liệu trên chuỗi và hiểu nó.
Nhưng trong khi nhiều dữ liệu quan trọng, như giao dịch, ví và giá cả, là minh bạch, thì đối với hầu hết mọi người thì không có nhiều ý nghĩa. Những dãy số và chữ cái trên blockchain cần được lập chỉ mục để hiểu được, và có hàng chục nền tảng tồn tại để giúp công chúng hiểu được điều gì đang xảy ra trong web3.
Nhưng những nền tảng này lấy dữ liệu từ đâu?
Còn các doanh nghiệp và tổ chức cần dữ liệu cụ thể cao cấp cho việc sử dụng nội bộ, như các quỹ đầu tư và dự án GameFi?
Cho đến gần đây, hầu hết các nhà phát triển đều sẽ xây dựng các SDK cho việc ETL dữ liệu, một chiến lược mà đắt đỏ và khó bảo trì. Bây giờ, có một số công ty DaaS (Cơ sở dữ liệu dưới dạng Dịch vụ) giúp việc này trở nên dễ dàng hơn. Trong khi Footprint Analytics là một trong những nền tảng như vậy, nó vượt xa những gì mà người khác cung cấp về phạm vi và tùy chọn tùy chỉnh.
Bằng cách cung cấp quyền truy cập vào dữ liệu lịch sử từ 24 chuỗi bao gồm cả chuỗi trò chơi (nhiều hơn nhiều so với bất kỳ nhà cung cấp nào khác), 17 sàn NFT, và gần 2.000 giao protocố GameFi cùng với tài sản trong game của họ, Footprint Data API là một API thống nhất cho các nhà phát triển blockchain của mọi dạng, trong toàn ngành công nghiệp.
Bây giờ, chỉ mất vài phút để thực hiện phân tích dữ liệu đa ngành của blockchain.
Bài viết này sẽ giải thích cách theo dõi dòng tiền bằng tính năng phân tích Footprint bằng cách lấy đồng coin ổn định làm ví dụ.
Thế giới Crypto so với Thế giới Thực
Trong thế giới thực, các loại cung cấp tiền tệ thường được phân loại là M0, M1, M2, M3. Trong thế giới tiền điện tử, khi bạn trao đổi tiền tệ pháp định qua OTC hoặc cái gì đó, tất cả các loại tiền điện tử này gần như có thể được theo dõi, khi chúng tương tác với một loại ví cụ thể hoặc một số giao thức. Chính phủ phát hành tiền tệ thông qua ngân hàng trung ương của họ thường, ngược lại các hợp đồng thông minh phát hành tiền điện tử thông qua hợp đồng thông minh hoặc bằng một cơ chế thưởng nào đó.
Một số thị trường phụ sẽ cho phép bạn trao đổi tài sản của mình, điều này tương tự cho tiền điện tử nhưng điều đặc biệt hơn là một số khối lượng đến từ DEX.
Vì vậy, tất cả những tình huống mà chúng tôi đề cập ở trên, chúng tôi sẽ xem xét xem đã xảy ra điều gì bằng cách sử dụng nền tảng phân tích dữ liệu trên chuỗi.
・Tạo và Đốt Token và Chuyển Khoản
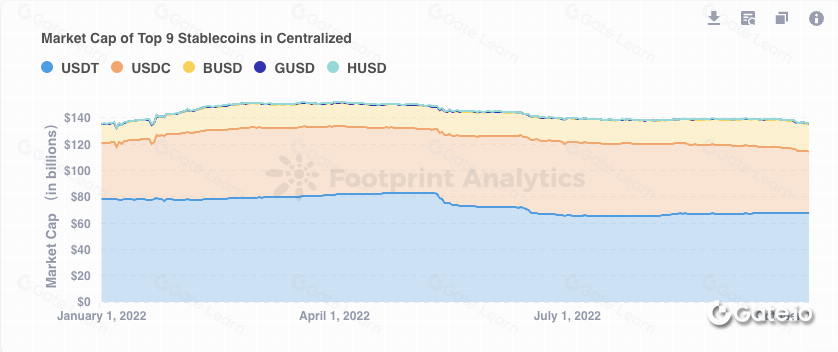
Đầu tiên, Hãy nói về việc phân phối đồng coin ổn định trong thời gian gần đây, bạn có thể theo dõi thông tin này qua biểu đồ nàyNhư bạn có thể thấy, USDT & USDC chiếm phần lớn thị trường khá ổn định trong suốt năm qua.
Điều gì sẽ xảy ra khi mã thông báo được đúc và đốt, bạn có thể theo dõi từ đâytruy vấn(mint)và điều nàytruy vấn (đốt cháy)
Có một số kịch bản thú vị cho việc đốt token,
- Một là hành vi thường gặp khi đốt cháy :
chọn * từ
chuyển_đổi_token_ethereum
nơi mà 1=1
và đến địa chỉ = ‘0x0000000000000000000000000000000000000000’
và transaction_hash = ‘0x2953d30a67abf584f673561abe6879ef0ffde33af4577dd1eee043adac93a9da’ — burn
và block_timestamp >= ngày(‘2023-01-03’) và block_timestamp <= ngày(‘2023-01-06’)
giới hạn 100
- Một giao dịch khác đang kết nối giữa các chuỗi khối khác nhau :
chọn * từ
Chuyển giao token Ethereum
nơi 1=1
và đến địa chỉ = ‘0x0000000000000000000000000000000000000000’
và transaction_hash = ‘0x3e76dd4c4c2ca3e4662964ad936e90c5dc82fad8956cfcbd6f1d5191a013e1a1’ —bridge
và block_timestamp >= ngày(‘2023-01-03’) và block_timestamp <= ngày(‘2023-01-06’)
giới hạn 100
- Bạn có thể theo dõi điều này trênetherscanKhông có văn bản nguồn để dịch.

- Chuyển Token là trường hợp phổ biến nhất, vì vậy tôi sẽ không giải thích nhiều chi tiết, hãy nhớ rằng vàng của chúng tôi đang theo dõi đồng tiền ổn định, chúng tôi sẽ sử dụng thông tin chính này: địa chỉ token để lọc đồng tiền ổn định

Và thường thì chúng ta sẽ có phí giao dịch, vậy ai nhận phí này như phần thưởng, bạn có thể theo dõi chúng trên [truy vấn](https://www.footprint.network/chart/miner-fee-fp-35761):
chọn * từ “các khối ethereum”
nơi 1=1
và hash = '0x6579fc0e9adf0cb4eb8db8dcb49558357f9830bcca3d0e8f1a37f034fc98a8fb'
và timestamp >= ngày('2023-01-03') và timestamp <= ngày('2023-01-06')

・Theo dõi luồng tiền mặt của CEX và đồng coin ổn định
Sau khi chúng ta biết về việc chuyển khoản cơ bản, và trong tình huống này, chúng ta cần:
- có thẻ trên ví để lọc ví CEX
- Biết địa chỉ token của đồng tiền ổn định
May mắn thay, điều này được thực hiện bởi cộng đồng và nhóm phân tích Footprint. Bạn có thể tìm thấy những thẻ này từ bảng entity_tag và địa chỉ token tiền ổn định trongở đây

Sau khi tài liệu này đã sẵn sàng, chúng ta cần phân chia thành một số bước:
- Bước đầu tiên là tìm một đồng coin ổn định để chuyển tiền vào hoặc ra khỏi CEX,ở đây. Vì toàn bộ quy trình hơi phức tạp, chúng tôi đã sử dụng tính năng phân tích dấu chân củamô hìnhbảng, như một bảng tạm thời để lưu trữ dữ liệu để chúng ta có thể truy vấn sau từ một truy vấn khác.
Để làm cho dữ liệu của bạn trở nên dễ hiểu hơn đối với các nhóm của bạn, bạn có thể hỏi một câu hỏi, hoặc trong trình tạo truy vấnhoặcTrình soạn thảo SQLđể tạo các bảng dẫn xuất trong Metabase, được gọi làmô hìnhcó thể kết hợp dữ liệu từ các bảng khác nhau. Bạn có thể thêm cột tùy chỉnh, tính toán và chú thích tất cả các cột với siêu dữ liệu để mọi người có thể tương tác với dữ liệu trong công cụ truy vấn như một điểm khởi đầu.
- Bước thứ hai: truy vấn giá của ethereum bằng cách sử dụng truy vấn này:
với giá_eth như (
CHỌN
DATE_FORMAT( “timestamp” ,’%Y-%m-%d %H’) AS ts_hr ,
trung bình(“price”) NHƯ “trung_bình_giá”
TỪ “token_price_5min”
NƠI ("chain" = 'Ethereum'
VÀ "token_symbol" = 'ETH'
VÀ “timestamp” >= ngày(date_add(‘day’,-90,hiện tại()))
Và "timestamp" < bây giờ())
NHÓM THEO 1
SẮP XẾP THEO 1 TĂNG DẦN
)
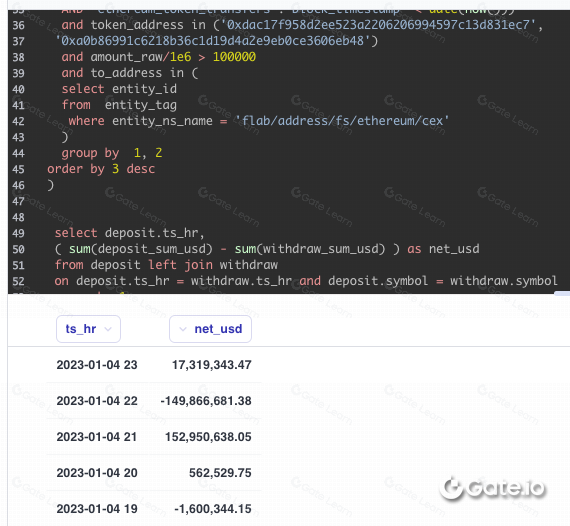
- Thứ ba: kết hợp những yếu tố này để kiểm tra mối quan hệ giữa tổng số tiền ròng và giá của ETH
- Kết quả này chứa dòng tiền ròng và tổng dòng tiền ròng di chuyển trong 4 tick (theo giờ), các chiêu thức trong ô đỏ của biểu đồ dưới đây đang sử dụng tính năng Phân tích Footprint: bảng mô hình

Thứ tư: kiểm tra biểu đồ xem bạn có thể tìm thấy mối quan hệ nào giữa dòng tiền ròng và diễn biến giá
Một điều thú vị là: hãy nhìn vào khi giá giảm mạnh do sự sụp đổ của FTX vào khoảng tháng 11, 8, 2022, rất nhiều dòng chảy mạng chuyển đến CEX cố gắng mua đáy

- Cuối cùng nhưng không kém phần quan trọng, nếu bạn không thể tìm thấy một mẫu giữa những biến động giá và luồng tiền ròng, việc giao dịch thông thường không dễ dàng như vậy, và chứa đựng nhiều yếu tố. Nhưng tôi đề xuất nếu bạn muốn khai thác sâu hơn, bạn có thể tải xuống dữ liệu, sử dụng Python để tính toán chi tiết, cũng như điều chỉnh các bộ tham số khác nhau của SQL và tải xuống các bộ tham số khác nhau và sử dụng Python để tính toán sự tương quan.
Cuối cùng, điều này đòi hỏi rất nhiều công việc toán học, nhưng ít nhất là vết chân giúp bạn rất nhiều trong việc thực hiện các công việc liên quan đến việc bẩn thỉu.
Bạn có thể sao chép bảng điều khiển của tôi ở đâyvà điều chỉnh hoặc làm lại tất cả những điều này từ đầu.
Theo dõi dòng tiền vào và ra của CEX chỉ là một phần của công việc. Có lẽ bạn còn làm nhiều hơn, như theo dõi cách tiền tương tác với giao thức DEX và các giao thức khác. Bạn có thể kiểm tra chi tiết từ một số truy vấn nàyTương tác DEXvàTương tác cho vay.
Khi bạn tìm thấy mẫu bạn cần, bạn có thể sử dụng tính năng cảnh báo phân tích Footprint để theo dõi biến động đáng kể của các chỉ số của bạn. Bạn thậm chí có thể sử dụng REST API và SQL API của chúng tôi để xây dựng ứng dụng riêng của bạn.
API
Footprint Analytics có kho dữ liệu trên chuỗi được lập chỉ mục toàn diện nhất, bao gồm 23 chuỗi, 14 nơi mua bán NFT, hơn 1.900 dự án GameFi và hơn 100.000 bộ sưu tập NFT.
Nó cho phép các nhà phát triển thực hiện cuộc gọi từ cơ sở dữ liệu chứa dữ liệu có cấu trúc cho tất cả các giao thức này với một truy vấn duy nhất, hoặc dễ dàng tùy chỉnh API dữ liệu khi cần. Vì API là chuyên ngành giao cắt, người dùng có thể truy cập dữ liệu NFT, GameFi và địa chỉ thông qua một công cụ duy nhất. Bộ lọc giao dịch rửa cho phép người dùng lựa chọn để lọc ra dữ liệu vô nghĩa và gian lận.