第 8 课
[钱包] 钱包地址分析
本课程涵盖了区块链技术的基础知识,包括钱包地址、交易以及不同链中区块链实现的多样性。它解释了如何使用资源管理器和专门的分析应用程序来跟踪区块链上的资金流动。本课程将重点介绍使用Footprint网络站点查询和分析区块链数据的实际示例。
・理论
钱包地址是加密货币运作方式的基本组成部分。每当有人发送或接收数字资产时,他们会使用一个唯一的钱包地址,这就像是一种虚拟邮箱。该地址允许交易被安全地记录在区块链上,其他用户可以对其进行验证和确认。
钱包地址可以通过区块链浏览器来跟踪资金流向的一种方式。这些浏览器允许用户搜索特定的钱包地址,并查看与之关联的所有交易。通过查看与特定钱包地址相关联的交易,可以了解已发送和已接收的资金量,以及资金的来源或去向。

钱包地址可以用于跟踪资金流动的另一种方式是使用专门的分析软件。该软件可用于在区块链上创建资金流动的可视化,让用户看到资金在不同地址和交易之间的流动方式。这是 Footprint 支持的另一个用例:

这份示意图展示了过去7天资金在币安进出的情况。我们看到超过900万美元从做市商Wintermute转入币安交易所。
这对于跟踪中心化交易所上的资金流动特别有用,因为在这些交易所上经常大量地来回交易资金。通过分析与这些交易所相关的钱包地址,可以更好地了解它们的运作方式,资金的来源和去向。
・区块链实现的多样性
・BTC
比特币交易通过将数字货币的所有权从一方转移到另一方来进行。当交易发生时,它会被广播到网络并包含在一个新的交易块中,该块被添加到区块链中。
・EVM本地代币
Ethereum是一个公共区块链网络,它使用以太坊虚拟机(EVM)来使任何人都能运行任何程序,无论给定的编程语言多长时间和内存。EVM使开发人员能够在以太坊平台上创建智能合约和去中心化应用程序(dapps)。
不同的EVM链可能具有不同的功能和用例,但它们都共享区块链技术的核心特性,例如去中心化、安全性以及运行智能合约和DApp的能力。
・ERC20和其他
ERC20代币是一种在以太坊区块链上运行的数字资产类型。它们旨在供去中心化应用程序(dApps)和智能合约在以太坊网络上使用,并根据一组称为ERC20代币标准的规则创建。该标准定义了一套所有ERC20代币必须遵循的通用规则,这使得dApps和智能合约可以以可预测的方式与它们互动。
ERC20代币标准专门针对以太坊区块链,因此不适用于使用不同技术的其他区块链网络。但是,其他区块链网络可能有其自己的数字资产标准,在某些方面类似于ERC20代币。例如,币安智能链使用与以太坊不同的技术和共识机制,因此不支持ERC20代币标准。相反,币安链拥有自己的数字资产标准,称为BEP20。 BEP20代币类似于ERC20代币,是可以被Binance链网络上的dApps和智能合约使用的数字资产,但它们与ERC20代币不是直接兼容的。
・实践
在这部分,我们将查看几个常见示例的查询示例。所有请求都意味着使用footprint.network网站——要进入构造器,您需要按照以下步骤进行。
- 点击“创建”并选择“新图表”。

使用UI拖放界面创建图表 - 一旦选择,构造函数将被打开:

查询构造器 - 一旦所有表格成功加载,您可以继续阅读以下章节(请参阅本节的子章节)
如何查询钱包地址余额?
作为我们平台的一部分,我们将所有网络的余额合并在一个表中。在以下示例中,我们将以以太坊为例分析获取余额的方法:
- 搜索名为地址_token_balance的表

- 从结果列表中选择它。一旦选择,数据将像在以下屏幕上一样进行预览

访问
高级视图按压
过滤器按钮选择
链作为要筛选的列,并输入“以太坊”选择
代币符号作为要筛选的列,并输入代币名称(USDT, 例如)选择
钱包地址作为要进行过滤并输入钱包地址的列从最新的检查到最早的进行排序
将结果限制为一个,以便只返回最后一次检查结果
因此,您将会得到类似这样的东西:
- 点击
可视化默认情况下,所有数据以表格形式可视化。在这种特殊情况下,只返回一个交易(因为交易哈希是唯一的)。
- 您已成功查询到您正在寻找的数据!
・如何查询提供的交易?
・BTC
- 搜索名为bitcoin_transactions的表

- 从结果列表中选择它。一旦选择,数据将像在以下屏幕上一样进行预览

访问
高级视图按下
过滤器按钮选择
哈希作为一个可筛选的列插入您感兴趣的交易哈希
因此,您将会得到类似这样的东西:
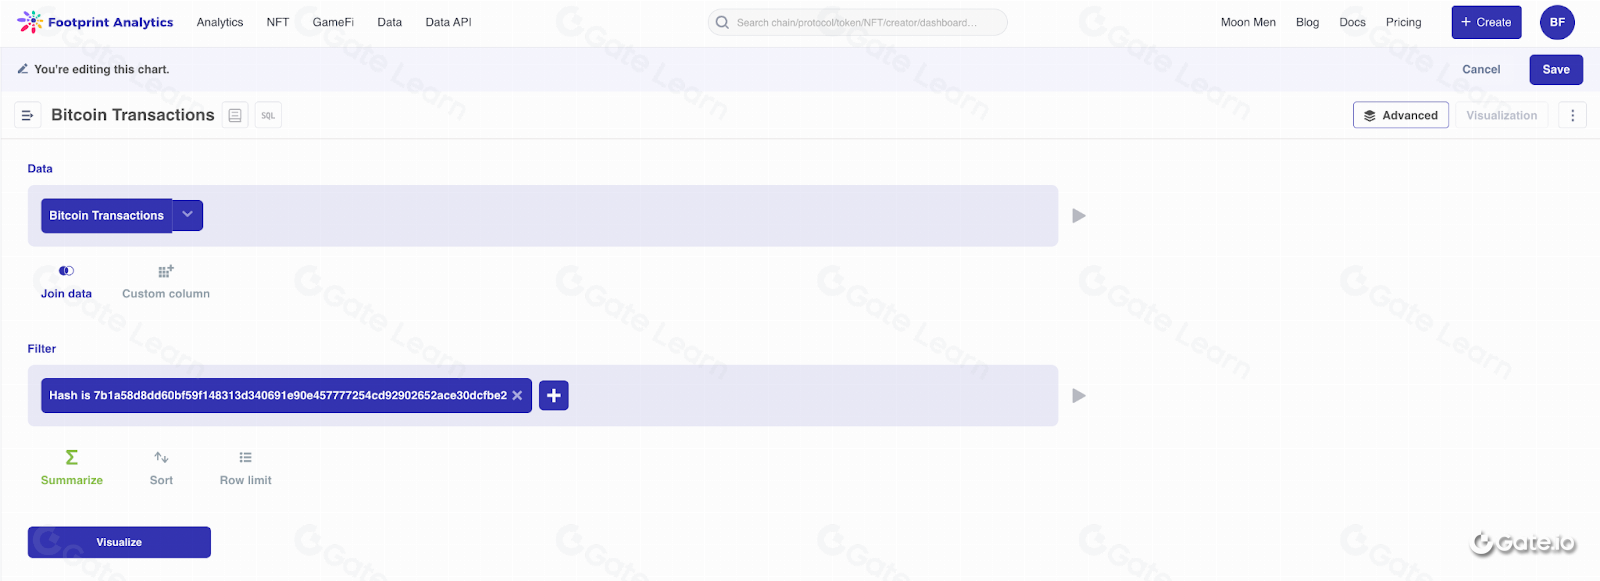
- 点击
可视化默认情况下,所有数据都以表格形式呈现。在这种特殊情况下,只会返回一个交易(因为交易哈希是唯一的)。
- 您已成功查询到您正在搜索的数据!
・以太坊虚拟机
以下示例将基于以太坊:
- 搜索名为ethereum_transactions的表

- 从结果列表中选择它。一旦被选择,数据将被预览,就像在下一个屏幕上一样

访问
高级视图按下
过滤器按钮选择
哈希作为要筛选的列插入您感兴趣的交易哈希
因此,您将会得到类似这样的东西:

点击
可视化默认情况下,所有数据都以表格形式呈现。在这种特殊情况下,只会返回一个交易(因为交易哈希是唯一的)。
您已成功查询到您正在寻找的数据!
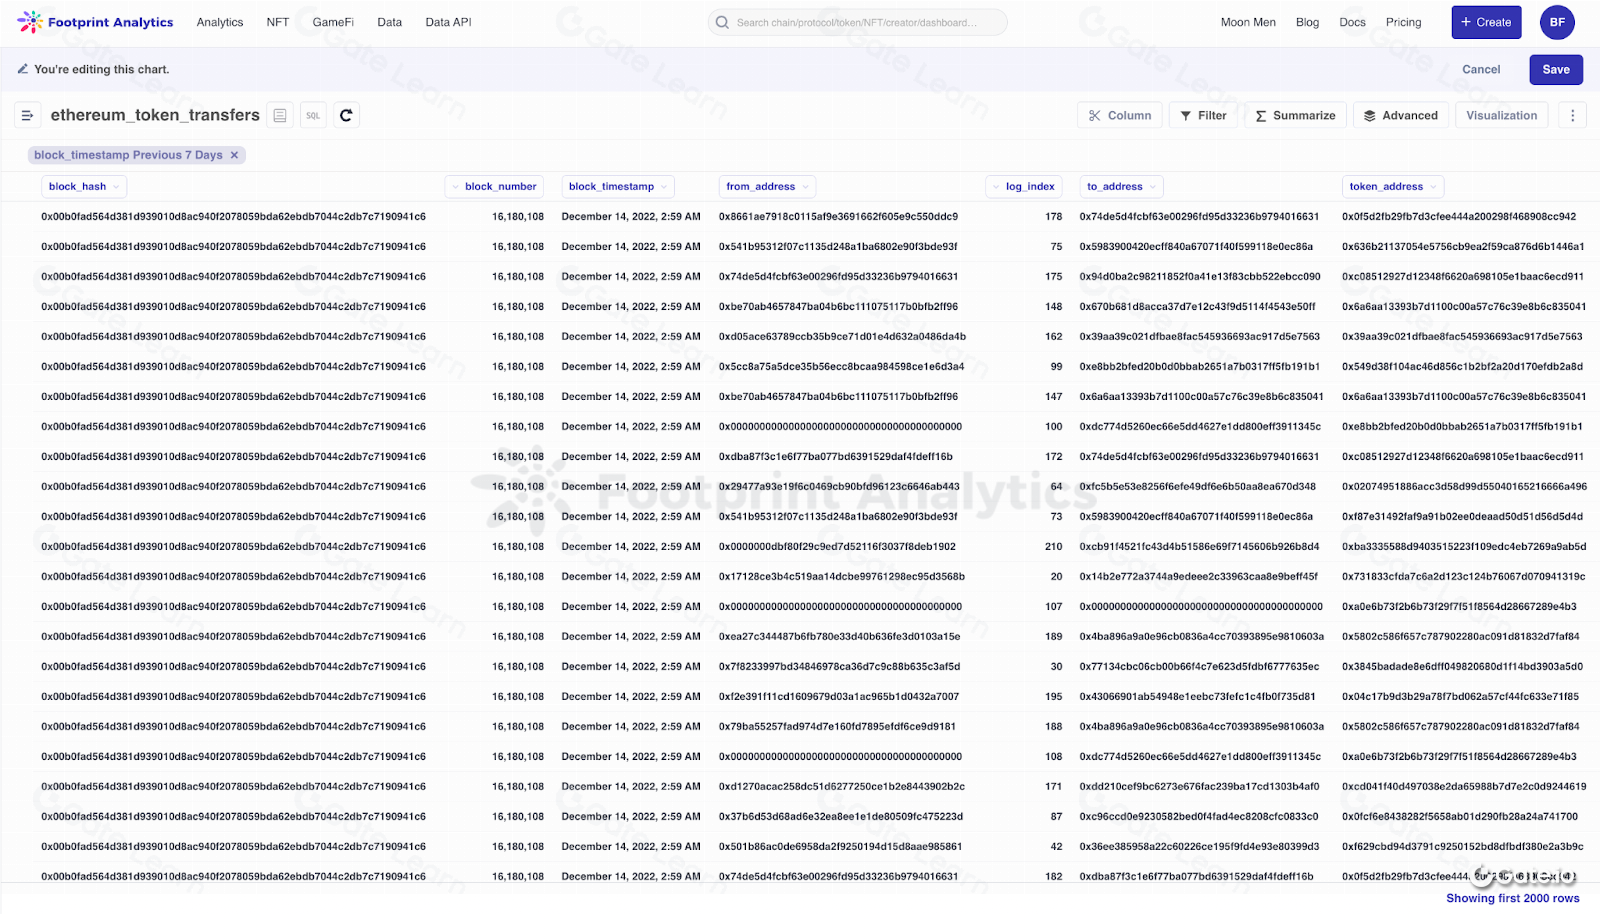
・ERC20代币
以下示例将基于以太坊:
- 搜索名为ethereum_token_transfers的表

从结果列表中选择它。一旦被选中,数据将会像在下一个屏幕上一样被预览
访问
高级视图按下
筛选按钮选择
交易哈希作为一个要被筛选的列插入您感兴趣的交易哈希
因此,您将会得到类似这样的东西:

- 点击
可视化默认情况下,所有数据都以表格形式呈现。在这种特殊情况下,只返回一个交易(因为交易哈希是唯一的)。
- 您已成功查询到您一直在寻找的数据!
・案例研究
Coindesk在11月2日发布了Alameda的私人财务文件,导致了加密货币历史上最大的崩溃。结果,1.4亿FTT流入币安,代币价值从26美元下降到2美元以下。这引发了对FTX的抢购,并导致据称是从储备中流失了4.73亿美元的“黑客攻击”,最终导致了全球第二大交易平台的破产宣告。
・事件摘要
11月2日,Coindesk发布了Alameda的私人财务文件。11月6日,币安创始人CZ宣布,币安将在未来几个月内出售所有账面上的FTT币。Alameda首席执行官Caroline Ellison提出以22美元的价格购买币安所有的FTT持仓,导致FTT经历了首次10%的急剧下跌,随后回升至24美元。11月8日,FTX International暂停提款,导致FTT暴跌至5美元。币安当天宣布可能有兴趣收购FTX,但收购于11月11日终止。当天晚些时候,FTX申请破产,用户资金消失。

11月6日至8日,FTT的价格从20多美元暴跌至5美元以下。
- 可以预测崩溃吗?
在FTX崩溃前,有几个链上信号表明问题在前。11月5日,有7500万个FTT从FTX转出,表明在发布Alameda的财务文件后进行了抛售。11月8日和11月13日分别发生了两次主要的FTT抛售,分别抛售了大约1.1亿和2.11亿个FTT。

脚印分析 - FTX-FTT交易及金额
从11月2日至11月8日,超过1.4亿枚FTT代币被转移到币安交易所。交易量激增发生在11月5日和11月6日,分别约有4,500万和4,200万枚FTT代币在这两天被转移。这表明许多用户在此期间将他们的FTT代币转移到了币安交易所。

这幅柱状图显示大量FTT被转移到币安,表明资本正在从原来的第二大交易所撤离。
据报道,FTX的以太坊余额已经减少超过14亿美元。

足迹分析 - FTX 以太坊地址净流入(11.1-11.7)
FTX主要代币余额大幅下降。这在预编译仪表板上得到了反映:


免责声明
* 投资有风险,入市须谨慎。本课程不作为投资理财建议。
* 本课程由入驻 Gate Learn 的作者创作,观点仅代表作者本人,绝不代表 Gate Learn 赞同其观点或证实其描述。
目录
第 1 课:[以太坊虚拟机(EVM)] 对EVM链的实际分析(以姨太为例)
102 已学过
第 2 课:[以太坊虚拟机] 用例 - 以太坊虚拟机 Gas 分析
71 已学过
第 3 课:[ NFT ] NFT分析
67 已学过
第 4 课:[NFT]更智能的NFT交易指标
61 已学过
第 5 课:[NFT] 分析 NFT 收藏品供需的指标
57 已学过
第 6 课:[ GameFi ] GameFi 数据分析介绍
55 已学过
第 7 课:[GameFi] 分析P2E游戏的5个指标
54 已学过
第 8 课:[钱包] 钱包地址分析
54 已学过
第 9 课:[ 钱包 ] 钱包跟踪分析的3个用例
51 已学过
第 10 课:【钱包】使用稳定币作为示例跟踪加密货币现金流
52 已学过
第 11 课:【DeFi】投资DeFi所需一切
50 已学过
第 12 课:【去中心化金融】如何通过收益耕作赚取加密货币
53 已学过
相关课程
中级
Aethir 介绍
Aethir 提供去中心化的 GPU 云基础设施,专为 AI、游戏和计算密集型应用而构建。本课程将全面解析 Aethir 的架构、代币经济、治理结构以及操作特性。学习者将深入了解去中心化计算模型如何通过代币激励机制和分布式验证系统进行构建和维护。

新手
加密领域自主研究指南(DYOR)
在加密货币领域,成功和失败之间的界限非常微妙。《加密领域自主研究(DYOR)指南》旨在为您提供工具、知识和洞见,让您能自信地在这个充满活力的领域中探索。您准备好深入探索、揭开加密货币领域的复杂性,并成为一名明智的投资者了吗?
中级
稳定币基础
本课程将带读者详细了解稳定币的方方面面,包括稳定币的定义、稳定币概述、不同类型的稳定币、稳定币的运作原理、如何安全地投资稳定币。同时,课程还将详细介绍市场上的主要稳定币,包括其用例和应用,监管与合规性,以及评估、投资稳定币并进行风险管理的策略。

中级
加密货币领域的身份验证项目概览
欢迎来到《加密货币领域的身份验证项目概览》综合课程。在这门前瞻性课程中,我们将一起探索加密货币生态系统中的身份代币。当今世界,随着区块链技术和去中心化应用的普及,安全可验证的身份解决方案变得至关重要。本课程将带大家深入了解身份代币,探究它在Web3生态系统中的意义,以及它变革身份验证、隐私保护和信任建设的潜力。与我们一起开启这一探索之旅,用专业知识武装自己,以便更加轻松地掌握数字时代去中心化身份相关的知识及其应用
中级
解析 L1 区块链:Kaia
Kaia 作为高性能的 Layer-1 区块链,具备 快速交易最终性和 低交易费用,同时支持 去中心化金融(DeFi)、游戏、现实资产代币化 等丰富生态系统。本课程将深入剖析 Kaia 的技术架构、代币经济、治理机制以及生态系统。