
Key Takeaways
-
SKY is forming a rounding bottom pattern on the daily chart
-
Price has rebounded strongly from the $0.0419 demand zone
-
Rising volume supports improving bullish momentum
-
A breakout above $0.0778 could confirm trend reversal
-
Pattern projection points toward the $0.11 region
Sky (SKY), the native governance and utility token of the Sky Protocol (formerly MakerDAO), has stepped into the spotlight after posting a strong daily move of over 8%, accompanied by a sharp 35% surge in trading volume. While the short-term momentum is drawing attention, the more compelling story is unfolding on the higher timeframe chart.
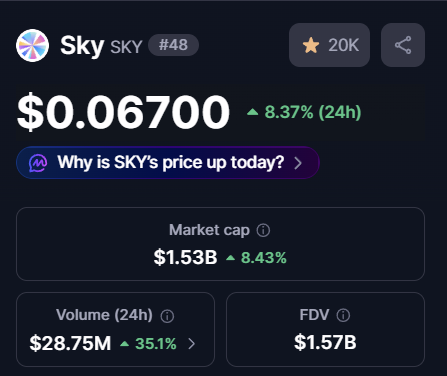
Source: Coinmarketcap
Price action is now forming a classic bullish reversal structure — one that often signals the transition from prolonged weakness into a new recovery phase.
Rounding Bottom Pattern Signals Trend Shift
On the daily timeframe, SKY appears to be completing a rounding bottom formation, a well-known bullish reversal pattern that typically develops after extended downtrends. This structure reflects a gradual shift in market psychology, where persistent selling pressure slowly fades and long-term accumulation begins to dominate.
Earlier in the trend, SKY faced repeated rejection near the $0.0778 neckline resistance, which triggered a steep sell-off. That decline ultimately bottomed near $0.0419, marking a critical demand zone where buyers aggressively stepped in and prevented further downside.
Since establishing this low, price action has steadily curved higher, forming a smooth rounded base. This gradual recovery — rather than a sharp V-shaped bounce — suggests healthier accumulation rather than short-term speculation.
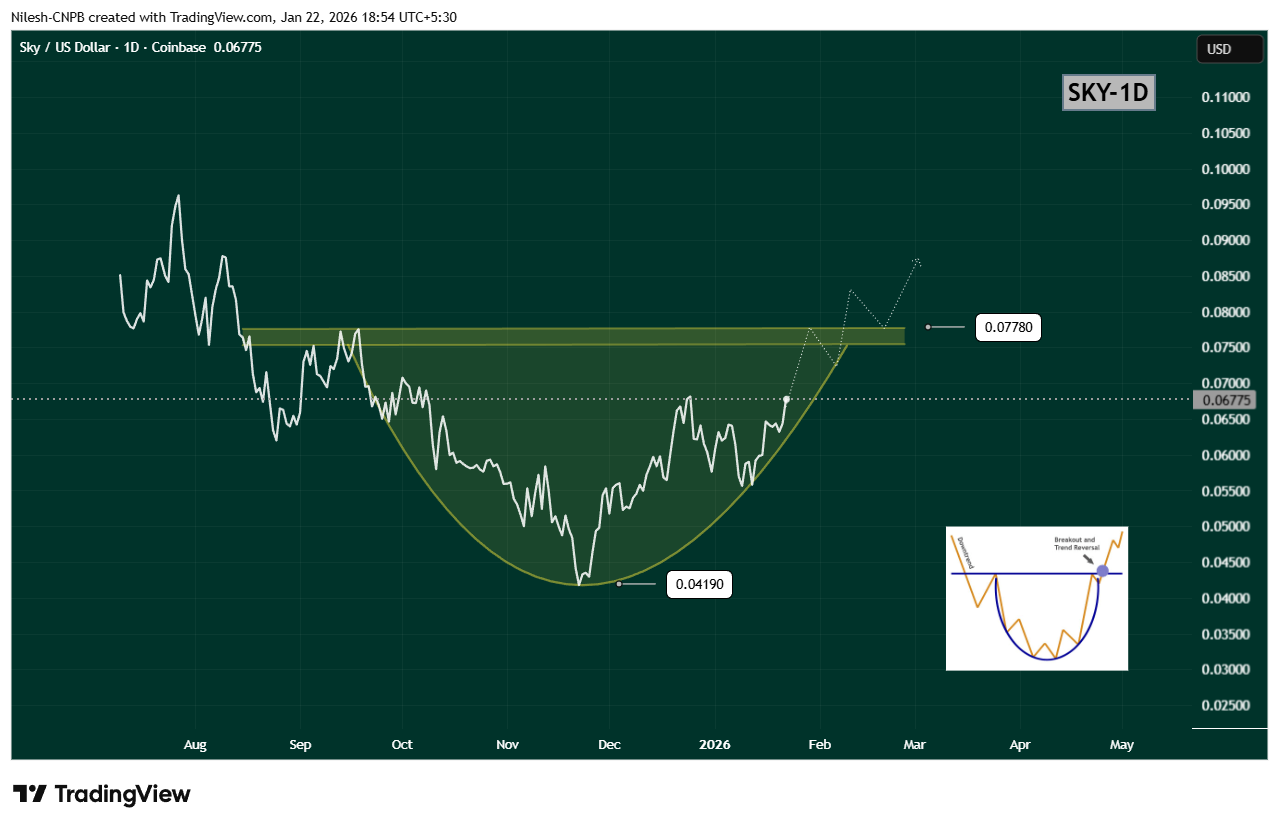
$SKY Daily Chart/Coinsprobe (Source: Tradingview)
Breakout Zone Comes Into Focus
Recent price action shows SKY reclaiming the $0.06933 region, a level that previously acted as resistance. This move strengthens the bullish structure and signals that buyers are gaining confidence ahead of a potential neckline test.
The key level to watch now is the $0.0778 resistance zone. A decisive daily close above this level would confirm the rounding bottom breakout and mark a clear shift in trend structure. Ideally, a breakout followed by a successful retest of this zone as support would further validate the bullish case.
Upside Projection and Risk Outlook
Based on the depth of the rounding bottom, the measured upside projection points toward the $0.11 region. Reaching this target would represent a potential 60–65% upside from current levels, aligning well with historical behavior of similar reversal patterns.
That said, patience remains important. Before any confirmed breakout, SKY could still experience short-term pullbacks or consolidation near the rising curve of the pattern. Such moves would not invalidate the bullish setup, as long as price continues to hold above recent higher lows.
A breakdown below the rounding base would weaken the structure, but for now, momentum favors the bulls.
Bottom Line
SKY is showing clear signs of a trend reversal in progress, with a rounding bottom pattern taking shape on the daily chart. Rising volume, improving structure, and a steady recovery toward neckline resistance all suggest that accumulation is underway.
If SKY can break and hold above $0.0778, the path opens toward the $0.11 region, signaling a broader bullish continuation. Until then, consolidation and minor pullbacks remain possible — but the overall structure is one that traders will be watching closely.
Disclaimer: The views and analysis presented in this article are for informational purposes only and reflect the author’s perspective, not financial advice. Technical patterns and indicators discussed are subject to market volatility and may or may not yield the anticipated results. Investors are advised to exercise caution, conduct independent research, and make decisions aligned with their individual risk tolerance.
About Author: Nilesh Hembade is the Founder and Lead Author of Coinsprobe, with over 5 years of experience in the cryptocurrency and blockchain industry. Since launching Coinsprobe in 2023, he has been providing daily, research-driven insights through in-depth market analysis, on-chain data, and technical research.
Disclaimer: The information on this page may come from third parties and does not represent the views or opinions of Gate. The content displayed on this page is for reference only and does not constitute any financial, investment, or legal advice. Gate does not guarantee the accuracy or completeness of the information and shall not be liable for any losses arising from the use of this information. Virtual asset investments carry high risks and are subject to significant price volatility. You may lose all of your invested principal. Please fully understand the relevant risks and make prudent decisions based on your own financial situation and risk tolerance. For details, please refer to
Disclaimer.
Related Articles
Trader Killa Says Bitcoin Needs to Hold Above 111-Day SMA to Confirm Trend Reversal
Gate News message, April 23 — Renowned Bitcoin trader Killa (@KillaXBT) stated that Bitcoin must successfully recover and hold above the 111-day simple moving average (SMA) to confirm a trend reversal. Without this, Bitcoin faces strong pullback risks within the longer-term bearish framework on
GateNews26m ago
Ethereum Spot Volume Surges 72%, Traders Eye $2,600 Liquidity Gap
Abstract: Ethereum's perpetual futures show robust buying pressure, with 24h net taker volume at $5.5B and the highest 30-day average since July 2022. ETH tests $2,400 and eyes a liquidity zone at $2,475–$2,634 as EMAs rise; CVD sits around $12.6B with neutral funding, suggesting a near-term liquidity target in that range.
ETH perpetual futures show strong buying with $5.5B 24h net taker volume and a 30-day high; ETH tests $2,400, aiming for $2,475–$2,634 liquidity zone as EMAs rise; CVD ~ $12.6B, funding neutral.
GateNews1h ago
Gold and Silver Slip Slightly, Oil Rises; Bitcoin and Ethereum Volatility Indices Decline
Gate News message, April 23 — Gold prices fell to $4,731.95 per ounce with a daily decline of 0.18%, while silver dropped to $77.585 per ounce, down 0.13% intraday. Bitcoin volatility index (BVIX) stood at 43.64, declining 1.80%, and Ethereum volatility index (EVIX) reached 63.90, down 5.19%.
In
GateNews4h ago
Gate Daily Report (April 23): The U.S. government runs Bitcoin nodes; Tesla’s BTC holdings remain unchanged
Bitcoin (BTC) continues the rebound trend from the beginning of the week, trading at around $78,230 as of April 23. U.S. Pacific Command Commander Samuel Paparo said in a congressional hearing that the U.S. government operates Bitcoin nodes to conduct cybersecurity tests, but does not participate in mining. Tesla’s first-quarter Bitcoin holdings remain unchanged, and its digital-asset impairment loss is $173 million.
MarketWhisper4h ago
Probably Nothing” — But TOTAL2 Structure Points Higher, and These 5 Altcoins Could Lead the Rally
TOTAL2 continues to respect a long-term trendline, signaling underlying altcoin market strength.
Market sentiment remains muted, often a precursor to larger price expansions.
Select altcoins show strong fundamentals despite limited short-term price movement.
The wider altcoin market
CryptoNewsLand5h ago
Trump Confirms Iran Ceasefire Negotiations Have “No Timeline,” Bitcoin Reexamines $78k
On April 23, Bitcoin reclaimed above $78,000. On April 22, U.S. President Donald Trump, during an interview with Fox News reporter Martha MacCallum, confirmed that the U.S.-Iran ceasefire negotiations do not have a set timeline, and denied a report that the U.S. media outlet Axios cited the same day, which referred to a "3 to 5 day window period" attributed to U.S. officials.
MarketWhisper5h ago