
Key Takeaways
-
OriginTrail (TRAC) has surged around 12% in a single day, drawing renewed attention to the token.
-
TRAC has broken out from an ascending triangle near $0.46 on the daily chart, signaling growing bullish momentum.
-
Similar breakout structures in July and October 2025 previously led to strong rallies of 63% and 113%.
-
Holding the $0.44–$0.46 zone as support will be crucial to keep the bullish fractal setup intact.
-
If the pattern plays out, TRAC could attempt a move toward its long-term ascending resistance above $1.00.
OriginTrail, the decentralized knowledge graph protocol, is stepping back into the spotlight as its native token TRAC records a strong 12% daily surge. Beyond the price jump, the real signal is coming from the charts, where a familiar fractal breakout structure is starting to emerge on the daily timeframe, hinting that a larger upside move could be forming.
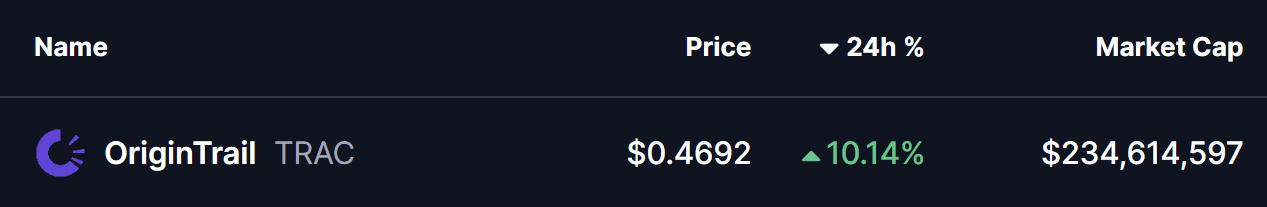
Source: Coinmarketcap
Fractal Breakout Hints at Potential Upside Move
On the daily chart, TRAC has confirmed a breakout from an ascending triangle pattern near the $0.46 level. This breakout is particularly important as price is now trading just above the 200-day moving average, a level that has historically acted as a major trend-defining zone for TRAC.
What makes this setup more compelling is its similarity to previous breakout phases. In late July 2025, a comparable structure resulted in a 63% upside move after price held above its breakout base. Later, in early October 2025, TRAC broke out from a right-angled descending broadening wedge pattern. That move was followed by a reclaim of the 200-day moving average and ultimately led to a powerful 113% rally.
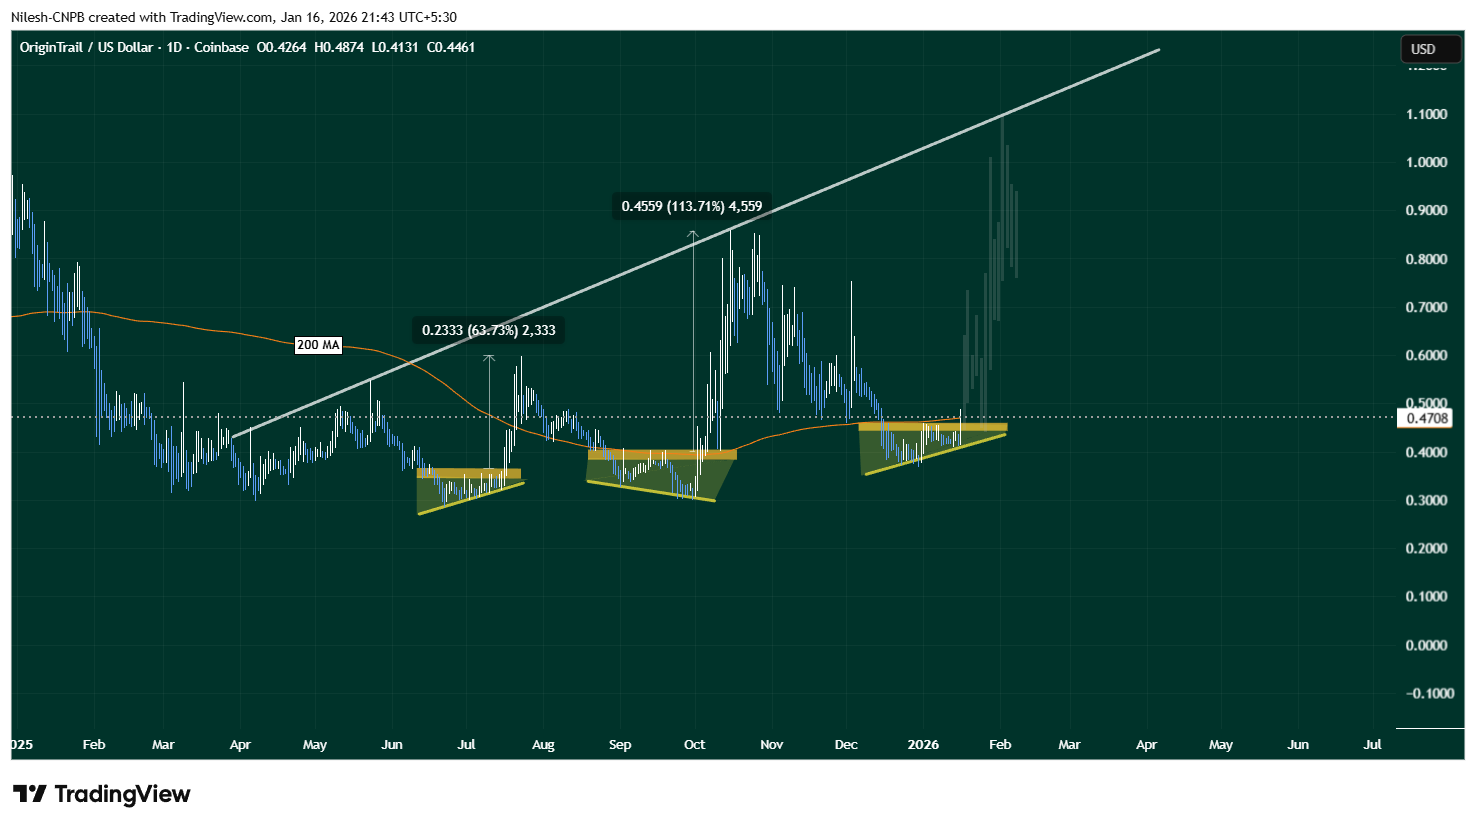
OriginTrail (TRAC) Daily Chart/Coinsprobe (Source: Tradingview)
The current setup shares key characteristics with those earlier moves. Price compression, a clean breakout, and interaction with the 200-day MA suggest that TRAC may once again be transitioning from consolidation into expansion.
What’s Next for TRAC?
If this fractal breakout plays out as expected, holding the $0.44–$0.46 zone as support will be crucial. A sustained hold above this range, along with continued strength above the 200-day moving average, could act as a launchpad for further upside.
In that scenario, TRAC may attempt a move toward its long-term ascending resistance trendline, which currently sits above the $1.00 level. A push toward that zone would align closely with the magnitude of prior fractal-driven rallies seen on the chart.
That said, fractal patterns are never guarantees. Broader market conditions, liquidity, and overall sentiment will continue to influence price action. A failure to hold the $0.44–$0.46 support zone or a rejection back below the 200-day moving average could invalidate the breakout and weaken the bullish fractal thesis.
Bottom Line
TRAC is showing early signs of another technically significant breakout, supported by historical fractal behavior and a reclaim of a key long-term moving average. If buyers can defend the current support zone, the chart suggests that OriginTrail may be positioning itself for a larger upside move in the weeks ahead.
Disclaimer: The views and analysis presented in this article are for informational purposes only and reflect the author’s perspective, not financial advice. Technical patterns and indicators discussed are subject to market volatility and may or may not yield the anticipated results. Investors are advised to exercise caution, conduct independent research, and make decisions aligned with their individual risk tolerance.
About Author: Nilesh Hembade is the Founder and Lead Author of Coinsprobe, with over 5 years of experience in the cryptocurrency and blockchain industry. Since launching Coinsprobe in 2023, he has been providing daily, research-driven insights through in-depth market analysis, on-chain data, and technical research.
Disclaimer: The information on this page may come from third parties and does not represent the views or opinions of Gate. The content displayed on this page is for reference only and does not constitute any financial, investment, or legal advice. Gate does not guarantee the accuracy or completeness of the information and shall not be liable for any losses arising from the use of this information. Virtual asset investments carry high risks and are subject to significant price volatility. You may lose all of your invested principal. Please fully understand the relevant risks and make prudent decisions based on your own financial situation and risk tolerance. For details, please refer to
Disclaimer.
Related Articles
Bitcoin Breaks Through $73,000! Outperforms Gold Amid US-Iran War, EF Sells 10.2 Million ETH
Bitcoin recently broke through $73,000 with strong performance, decoupling from tech stocks and gold. Analysts predict that if the market stabilizes, it could rise to $75,000 to $80,000. However, geopolitical risks and extremely fearful market sentiment continue to pressure prices. Meanwhile, the Ethereum Foundation sold Ether for approximately $10.2 million to maintain operations.
CryptoCity21m ago
On-chain activity is exploding, but Ethereum can't seem to gain momentum? Experts reveal the "fatal weakness": could drop to $1,500
CryptoQuant's latest report indicates that Ethereum is facing an "adoption paradox," where network activity reaches new highs, but the token price continues to decline. Analysts predict that if the bear market persists, Ether could fall to $1,500. Despite thriving on-chain activity, it has decoupled from the token price, and the high proportion of Ether flowing into exchanges suggests heavy selling pressure and weak investment demand.
区块客31m ago
Bitcoin Breaks Through $74,000! 24-Hour Surge of 3.68%, ETFs Continue to Attract Capital, Multiple Factors Provide Support
Bitcoin broke through $74,000 on March 16th, with a gain of 3.68%, primarily driven by ETF capital inflows, halving supply effects, and geopolitical safe-haven demand. While market sentiment remains optimistic, short-term volatility is intensifying, and investors should carefully manage risk and monitor future support levels and selling pressure.
動區BlockTempo37m ago
Price Spreads Exceed 50%, Pre-Market Arbitrage on Crypto Stocks to Become New Business in Bear Market
Mysten Labs CEO Evan Sui believes that "bear markets" are not beneficial for the development of the cryptocurrency industry, as many projects face cash flow crises and may withdraw. However, data shows that over 80% of crypto startups are still in development, and bear markets can help focus the project teams' development efforts. The article explores the demand and potential entrepreneurial directions in the pre-market trading sector of tokens, pointing out that the crypto market lacks "bridge platforms" to integrate price differences between various trading markets, and recommends creating new platforms that meet market needs.
PANews49m ago
10x Research: Unusual Adjustments in Bitcoin On-Chain Capital Flows and Position Changes
10x Research posted a message on the X platform stating that Bitcoin prices are rising slowly, with abnormal capital flows appearing in the market. Recently, funding rates and risk indicators have undergone significant adjustments, market trends are being influenced by position structures, and changes in positions for Ethereum and Bitcoin require attention, with options trading before the end of March being particularly critical.
GateNews51m ago
BTC Short-term Rise 1.25%: Whale Buying and Key Level Breakthrough Drive Market Acceleration Upward
During 2026-03-16 03:30-03:45 (UTC), BTC recorded a +1.25% return with a price range of 72,851.9 to 74,300.0 USDT, reaching an amplitude of 1.99%. The K-line candle showed significant volume expansion during this period, with increased market attention and notable short-term volatility. Investors rapidly entered the market, with trading volume exceeding daily average levels, reflecting capital-driven momentum behind the price movement.
The primary drivers of this unusual movement were concentrated whale fund buying and a breakout through key technical levels. On-chain monitoring data showed 4 transactions each exceeding 1,000 BTC during the anomaly period.
GateNews1h ago