Tentukan Waktu Pembelian dan Penjualan
Garis tren tidak benar-benar ada secara fisik, melainkan dibuat oleh trader untuk mencerminkan arah dan kekuatan pergerakan tren. Sebagai alat analisis teknikal yang bersifat subjektif, garis tren berfungsi sama seperti moving average untuk membantu trader memperkirakan pergerakan pasar berdasarkan fluktuasi harga historis. Garis tren tidak merepresentasikan tren yang sedang berlangsung, melainkan mengonfirmasi tren yang telah terbentuk.
Waktu Pembelian
Menentukan waktu terbaik untuk membeli aset merupakan bagian dari manajemen posisi di pasar bullish. Prinsip-prinsip utamanya sebagai berikut:
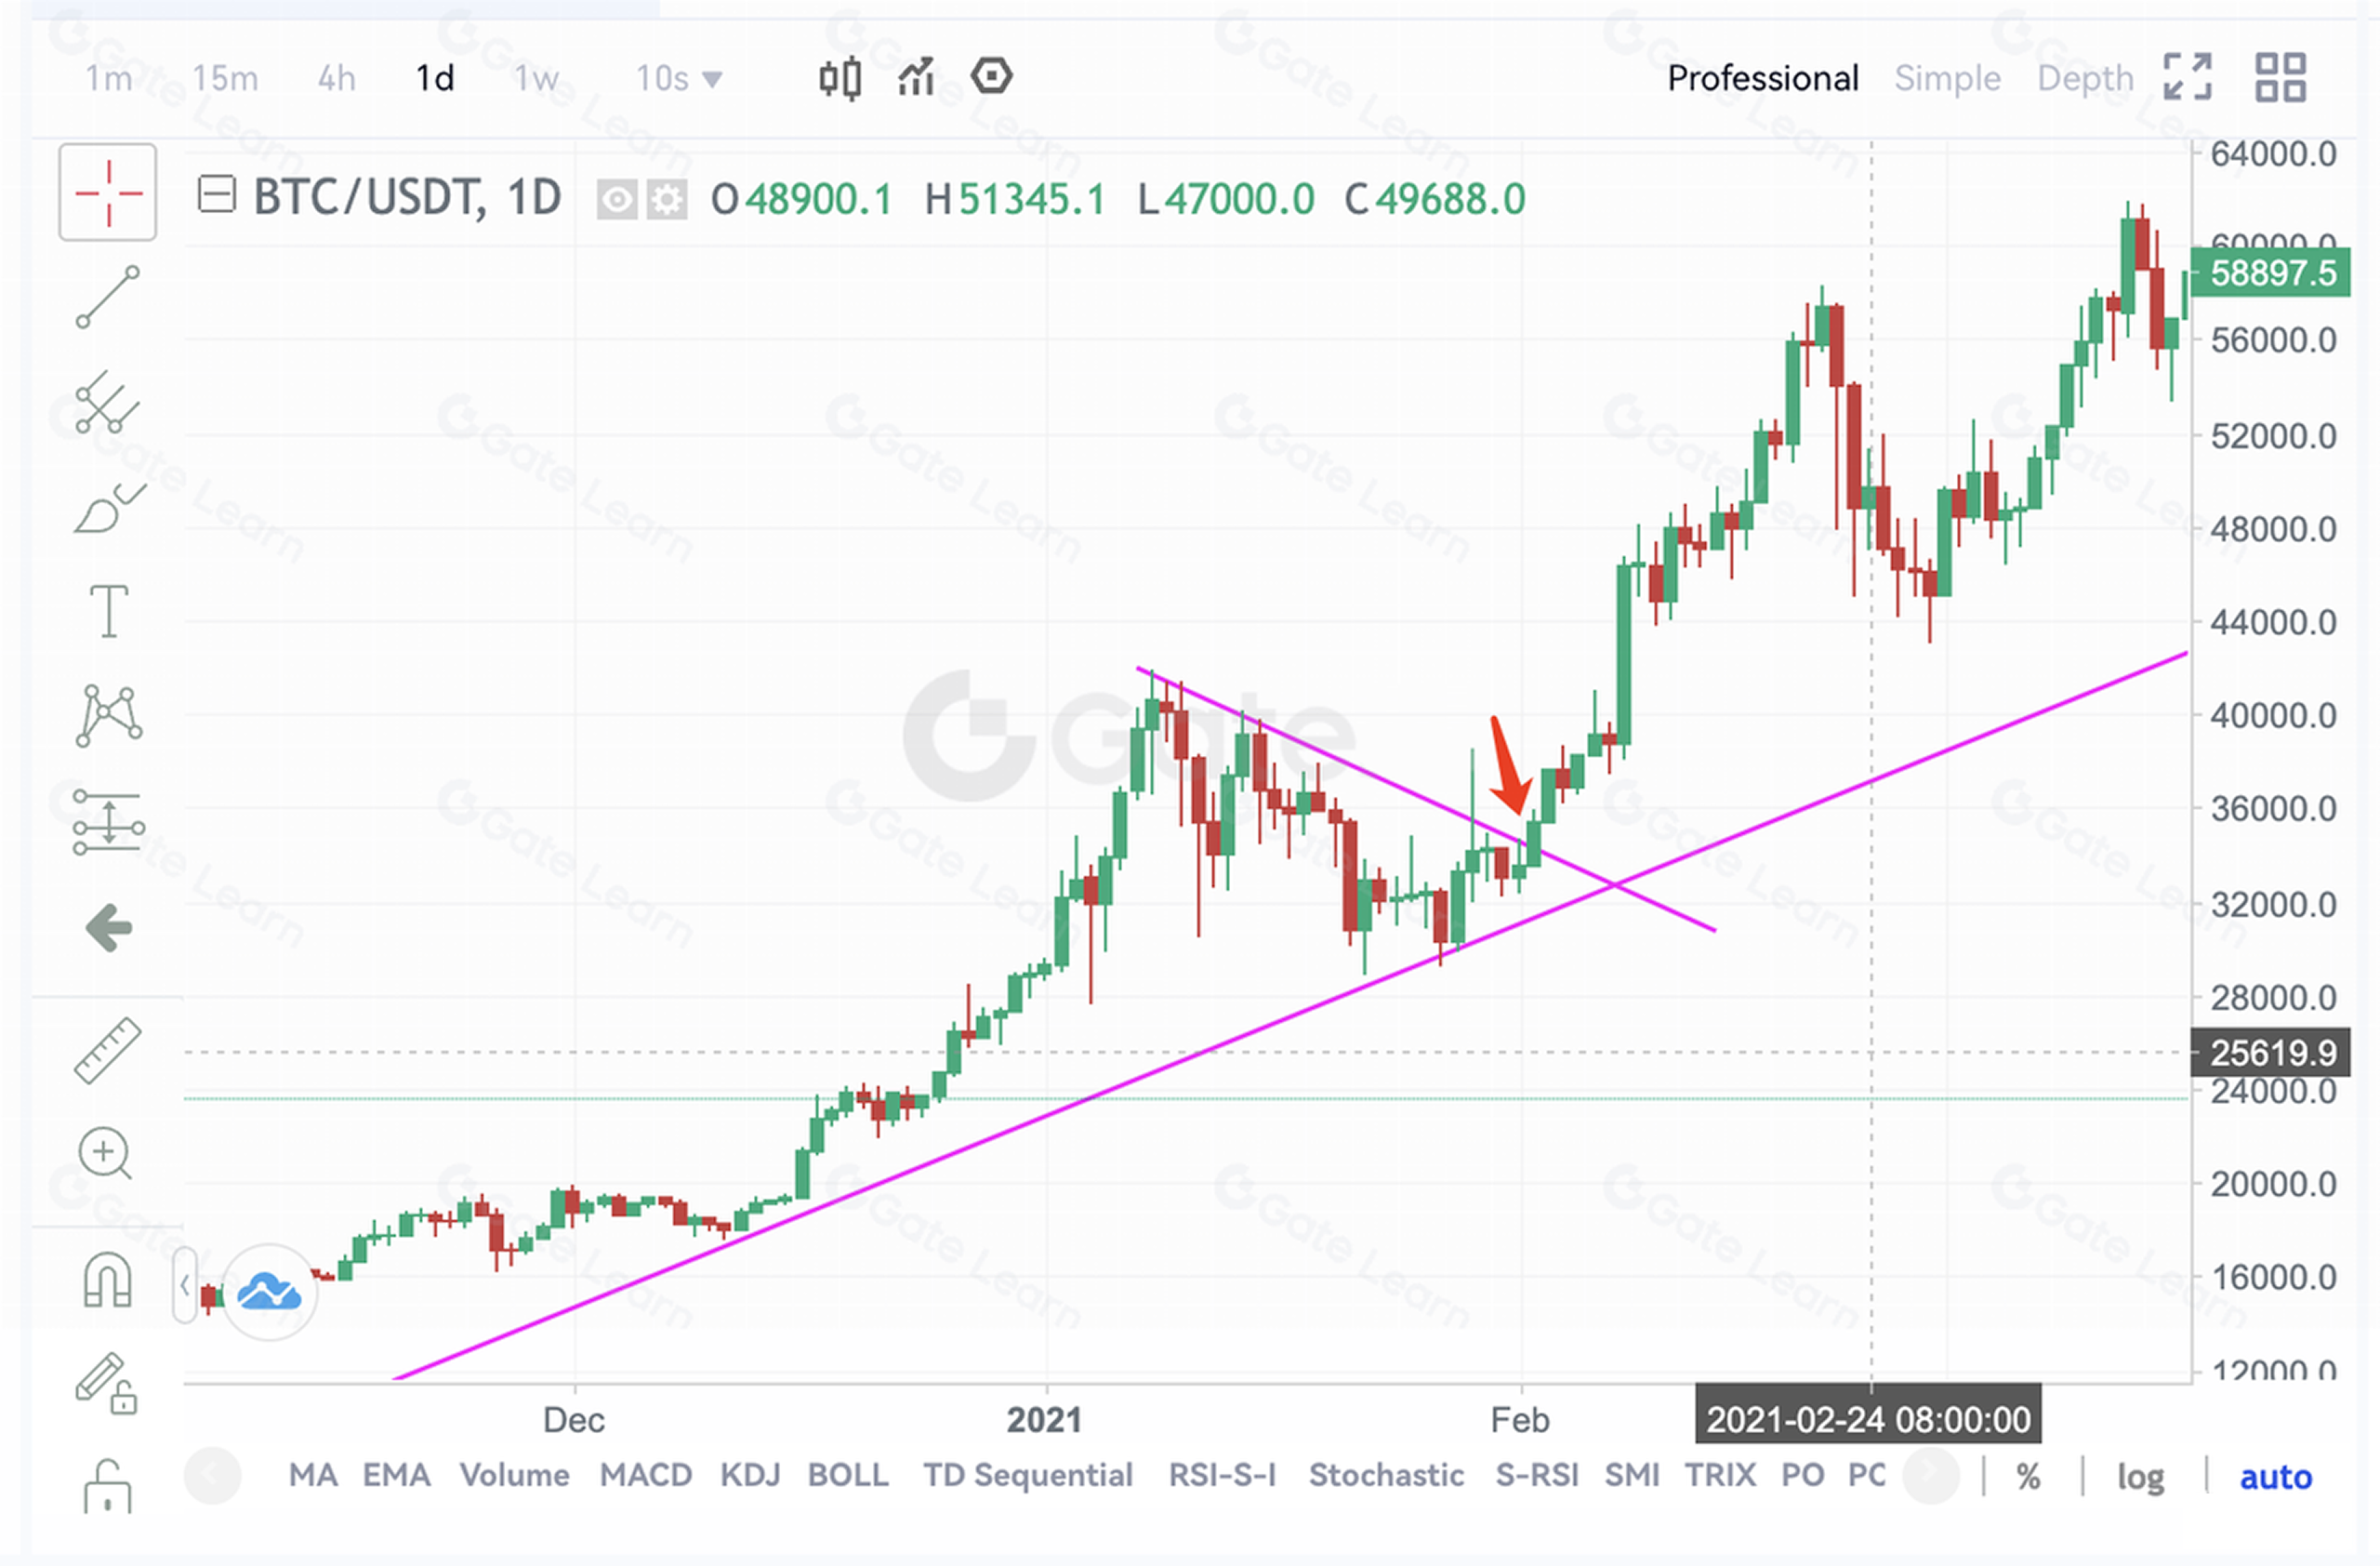
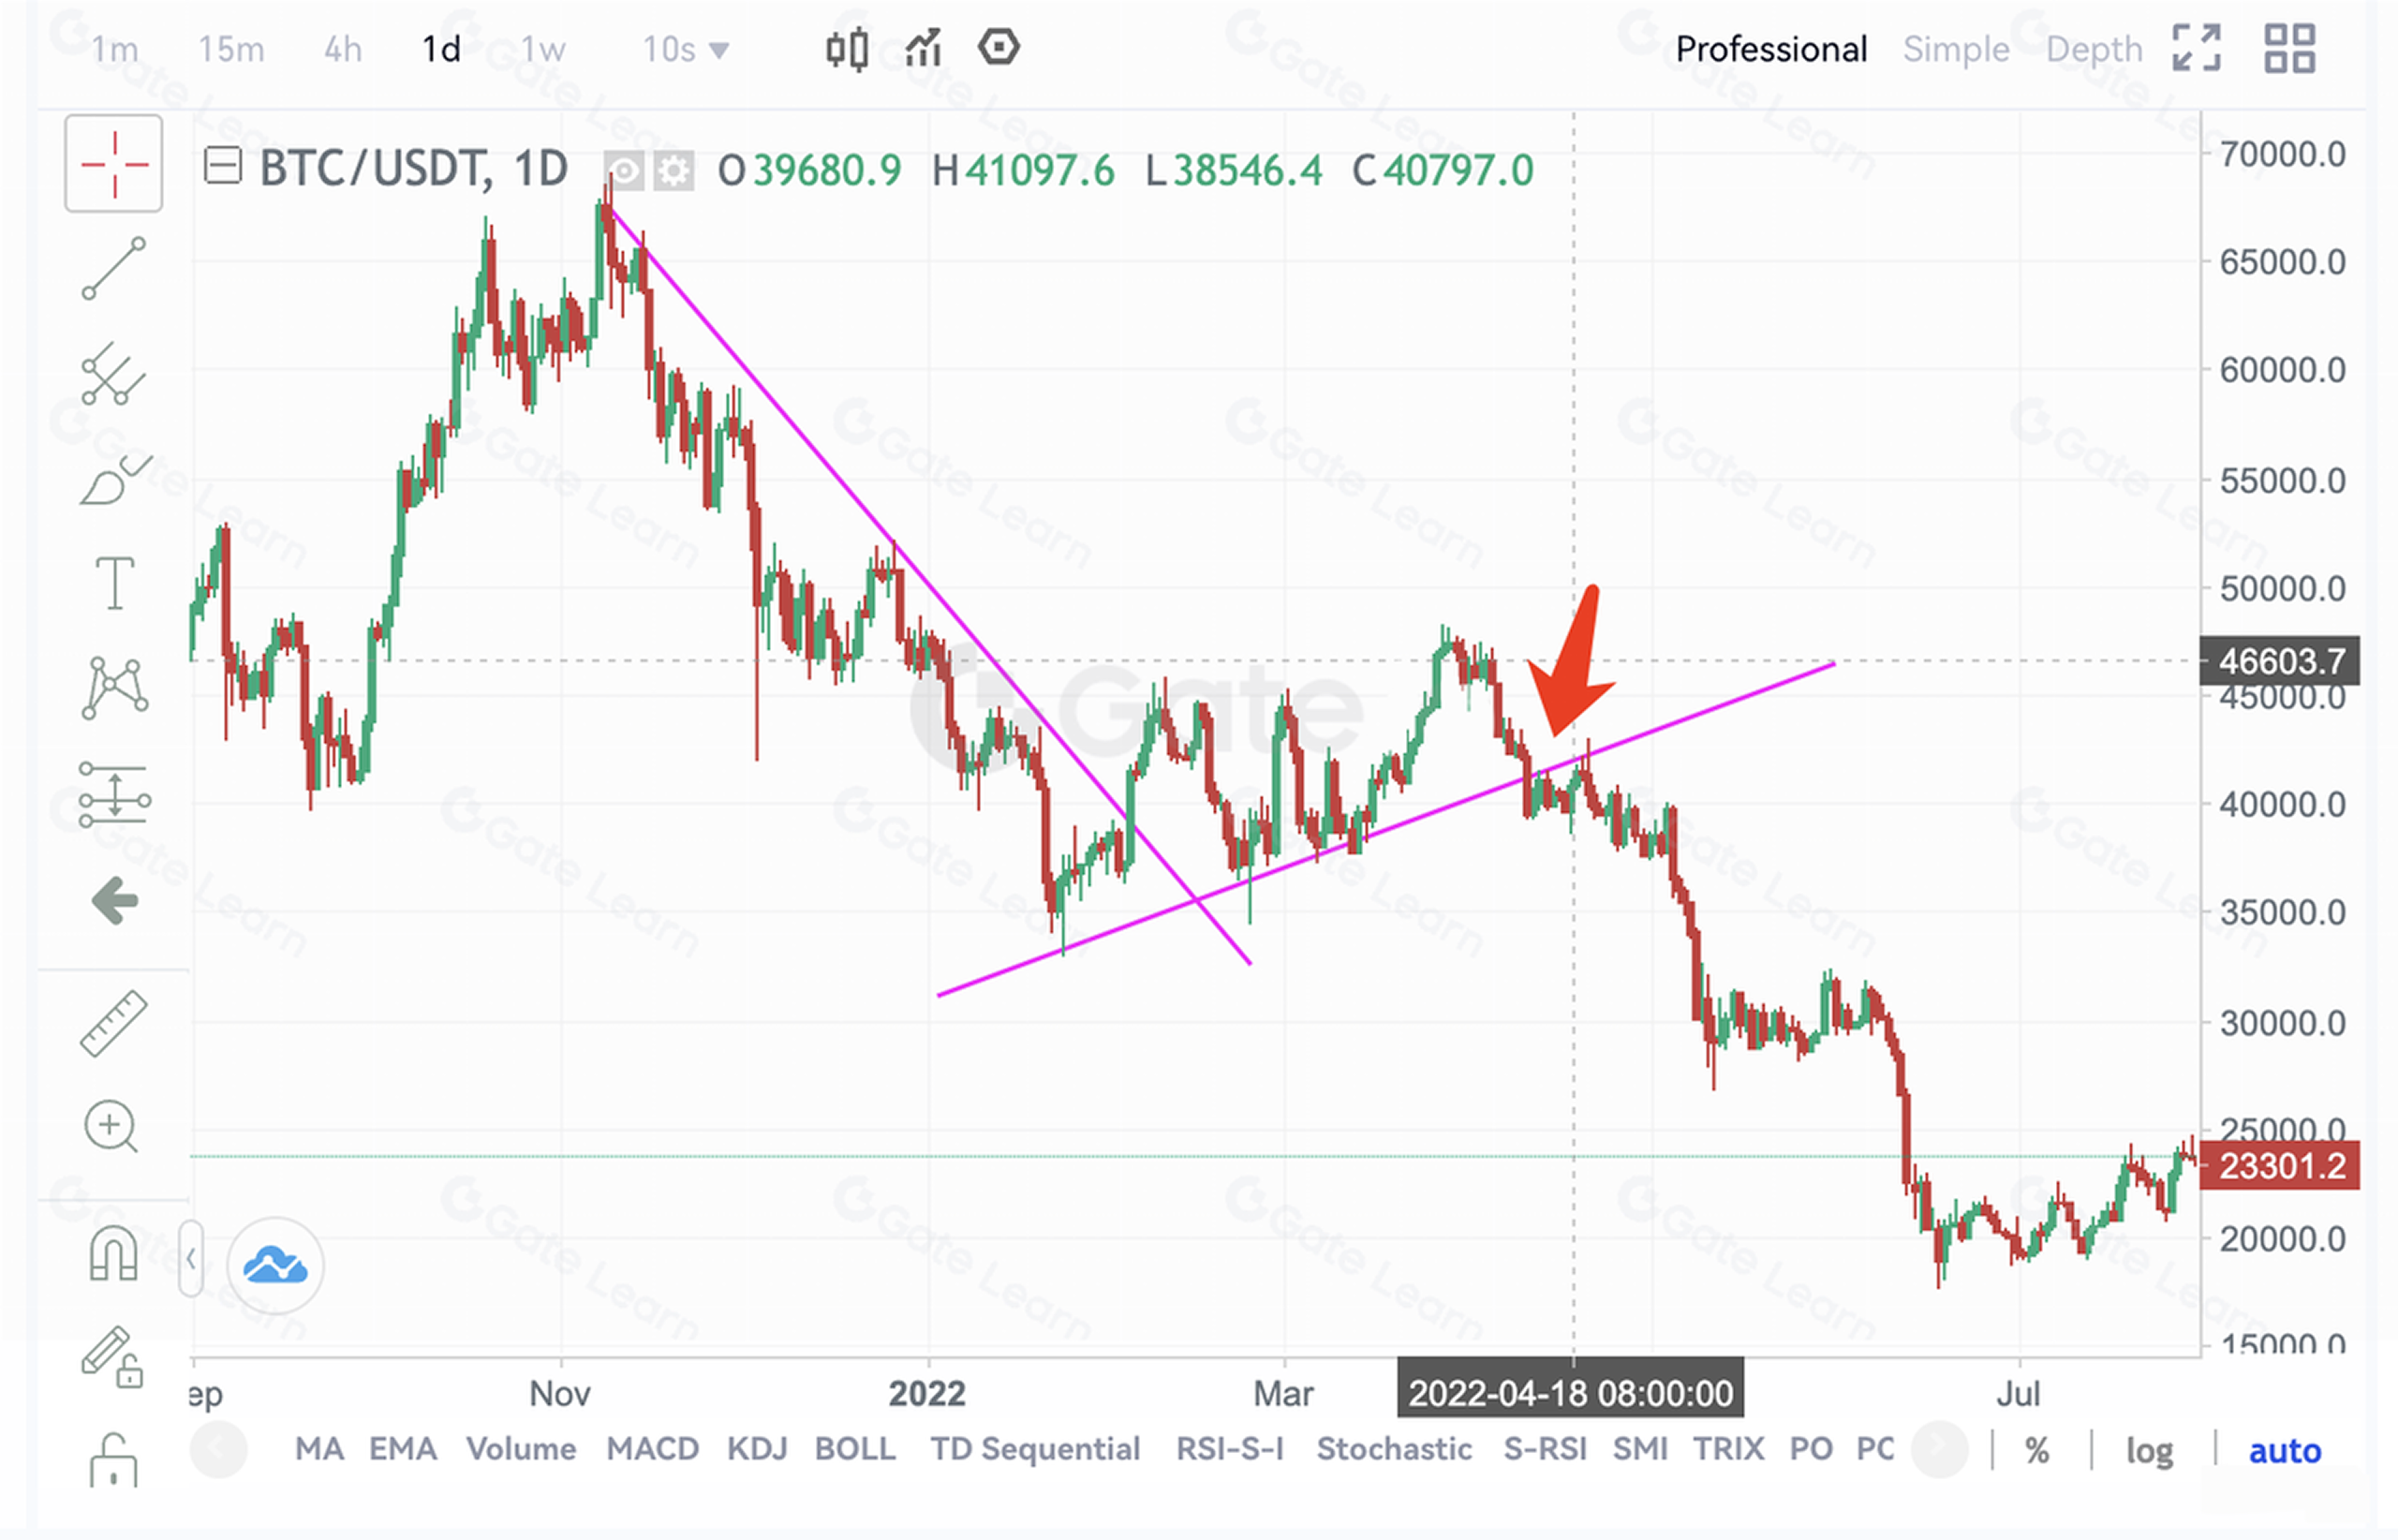
1. Beli aset: Setelah harga menembus garis tren penurunan jangka panjang, harga mulai berfluktuasi namun tidak pernah turun hingga melewati garis tren kenaikan jangka menengah, atau tidak pernah turun hingga menembus garis tren penurunan jangka panjang dan garis tren kenaikan jangka menengah.
2. Beli aset atau tambah posisi: Selama harga berada di atas garis tren kenaikan jangka panjang, harga menembus garis tren penurunan jangka menengah.
3. Beli aset atau tambah posisi: Selama harga berada di atas garis tren kenaikan jangka panjang, harga tiba-tiba anjlok lalu memantul kembali menembus garis tren penurunan jangka pendek.
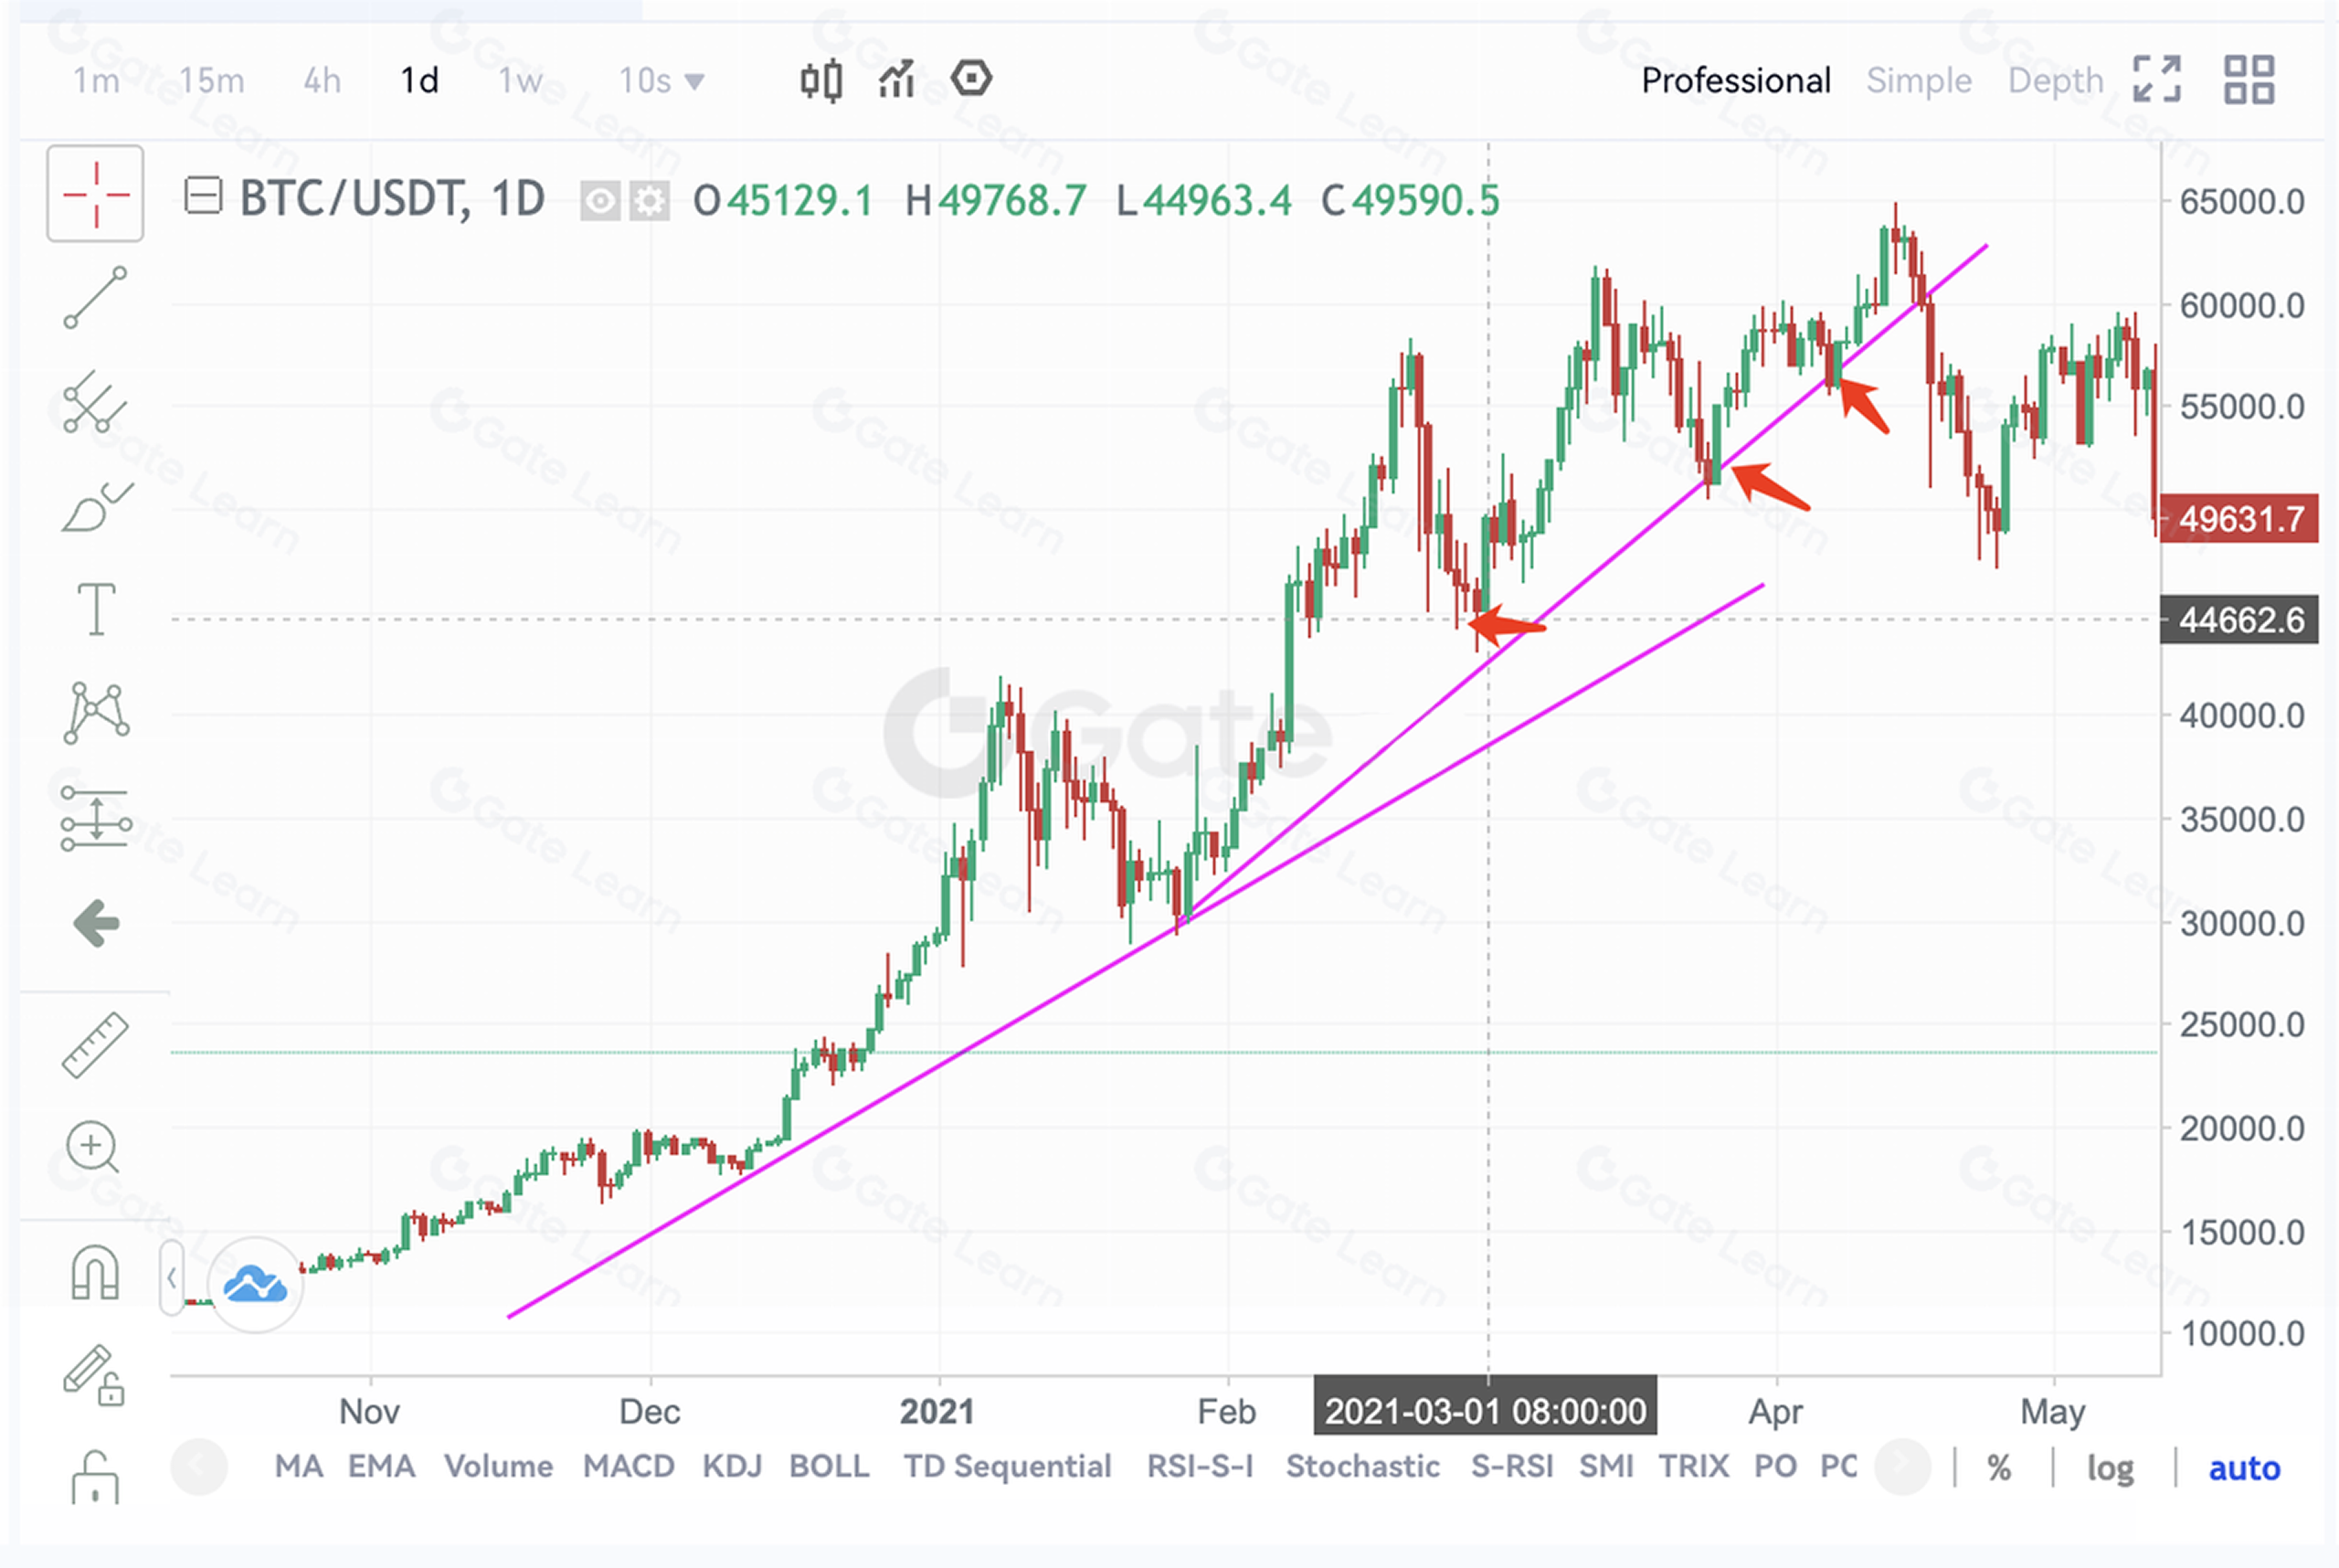
4. Beli aset atau tambah posisi: Harga turun, lalu memantul di atas support garis tren kenaikan jangka panjang.
5. Beli aset atau tambah posisi: Harga turun, lalu memantul di atas support garis tren kenaikan jangka menengah.
Waktu Penjualan
Sebaliknya, penentuan waktu penjualan aset berkaitan dengan manajemen posisi di pasar bearish. Ini berarti menentukan waktu penjualan aset dan jual pendek. Prinsip-prinsipnya adalah sebagai berikut:
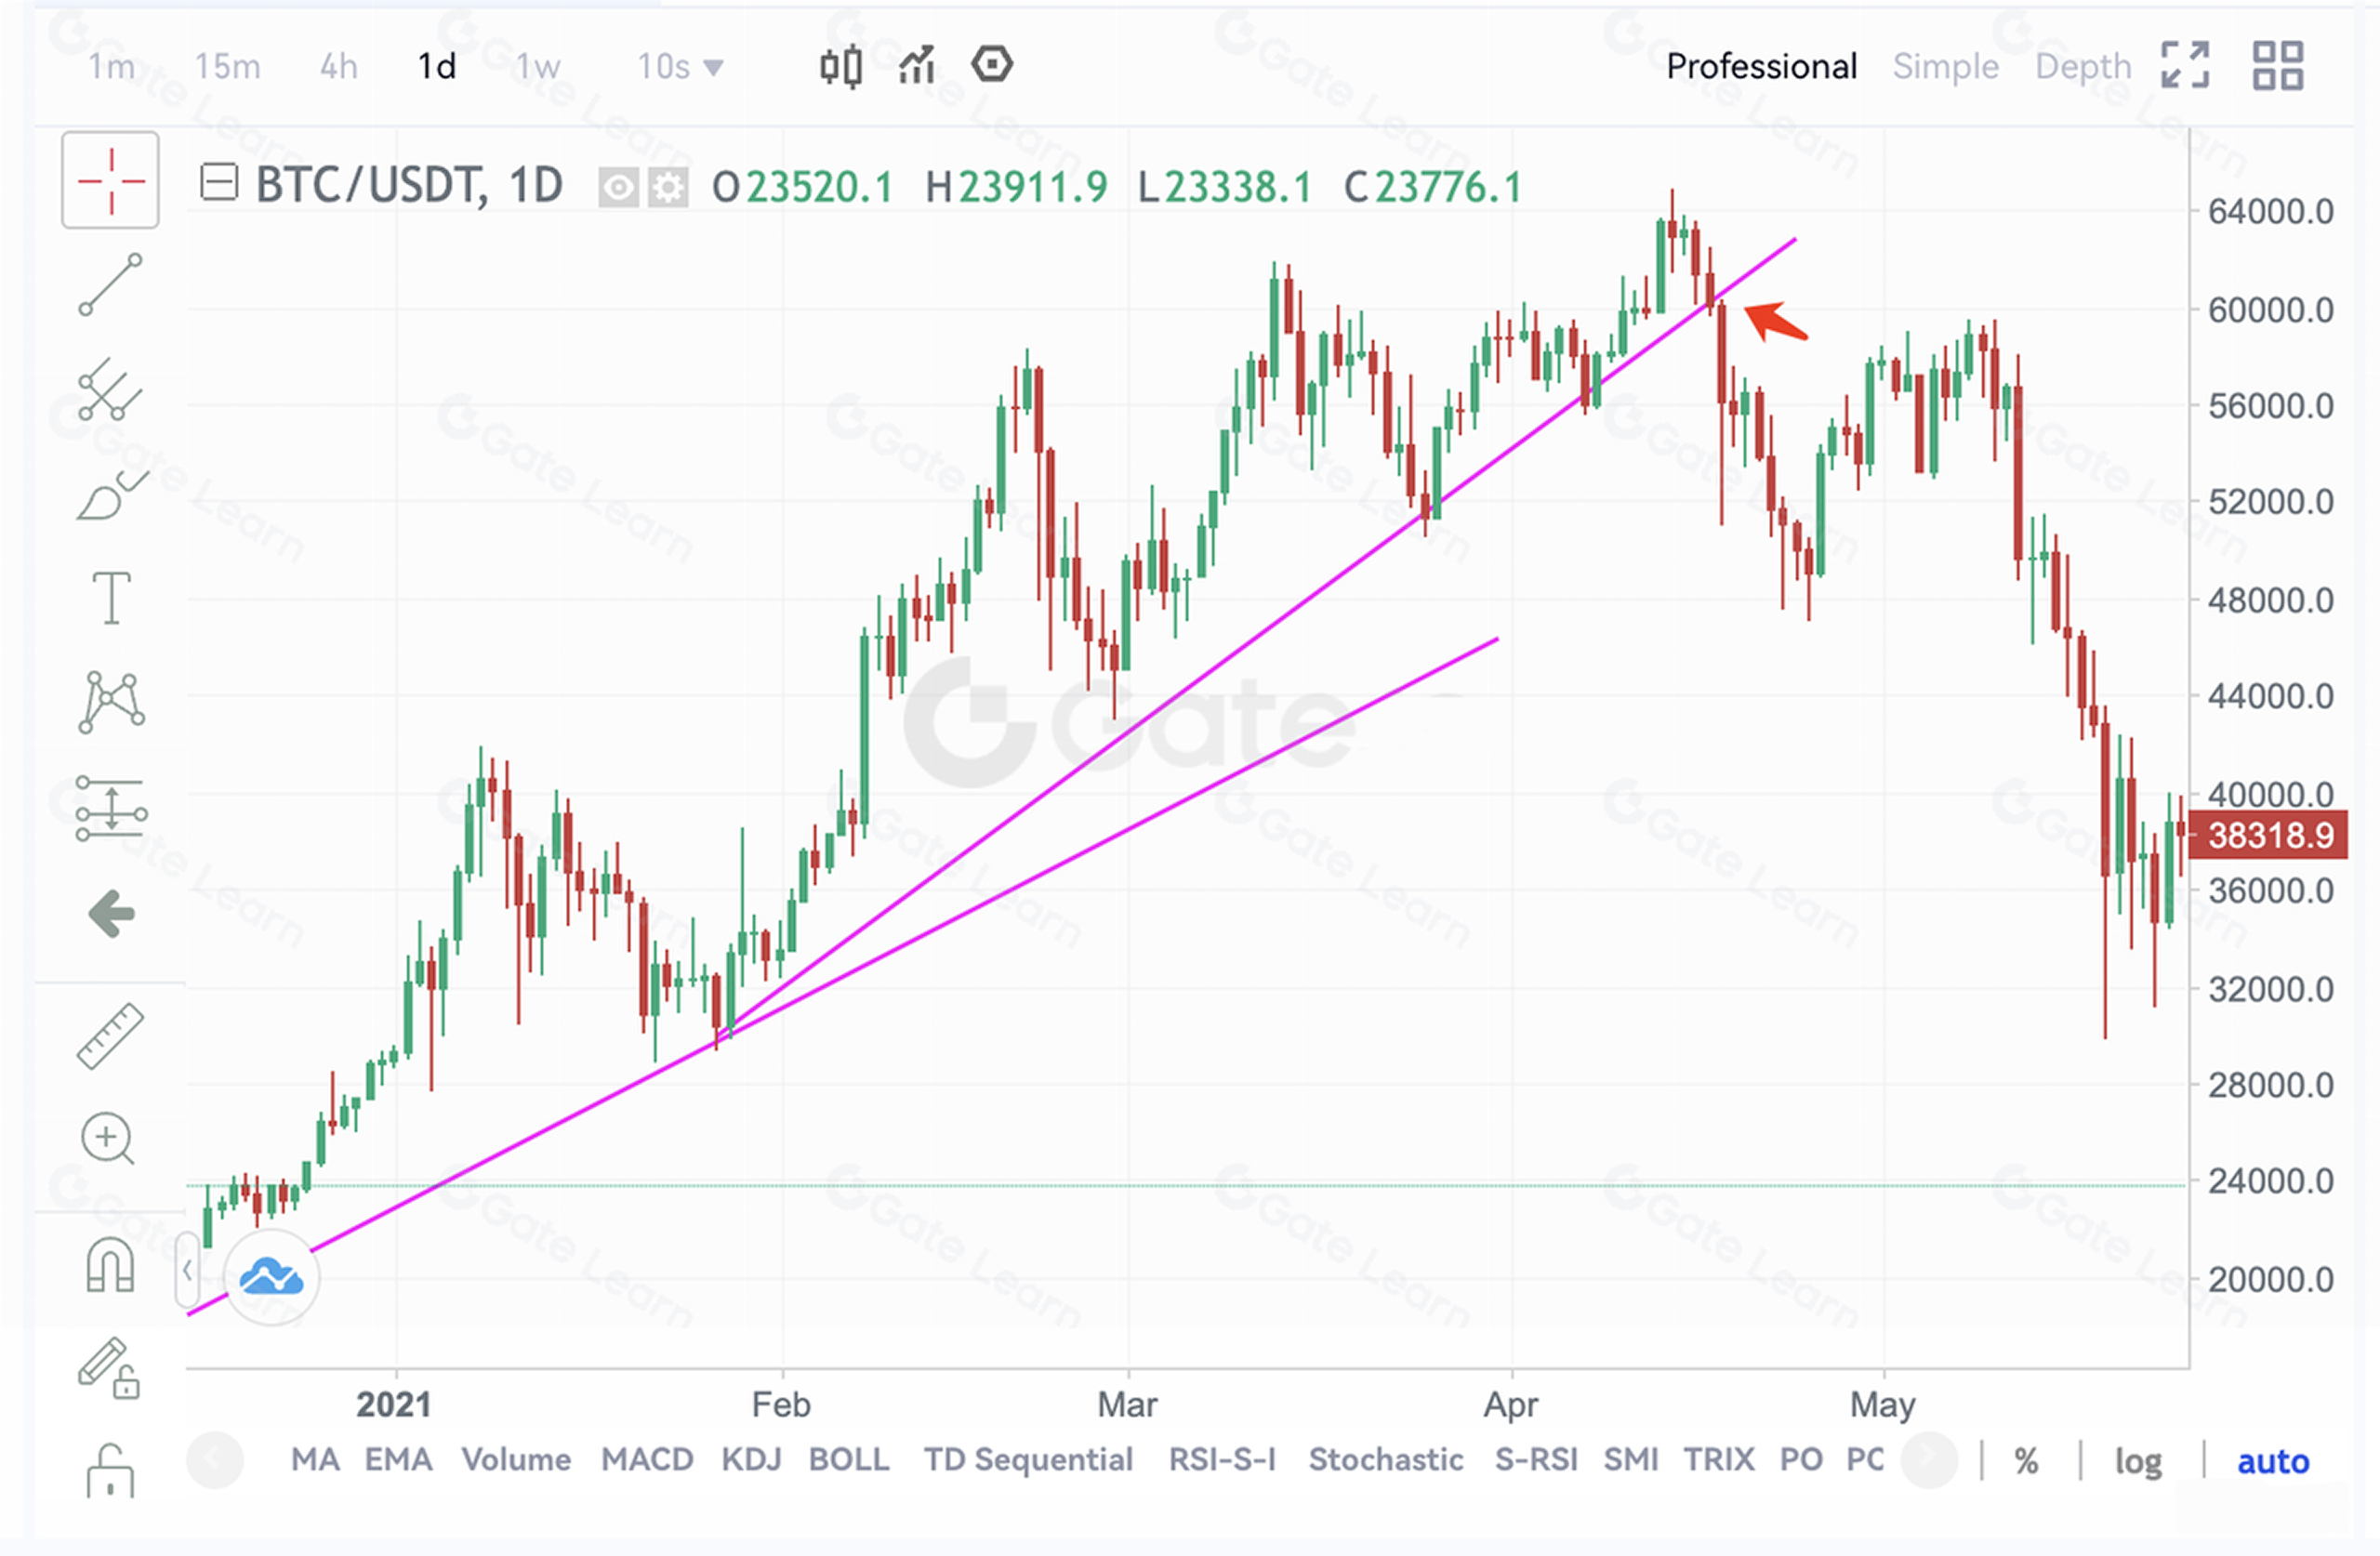
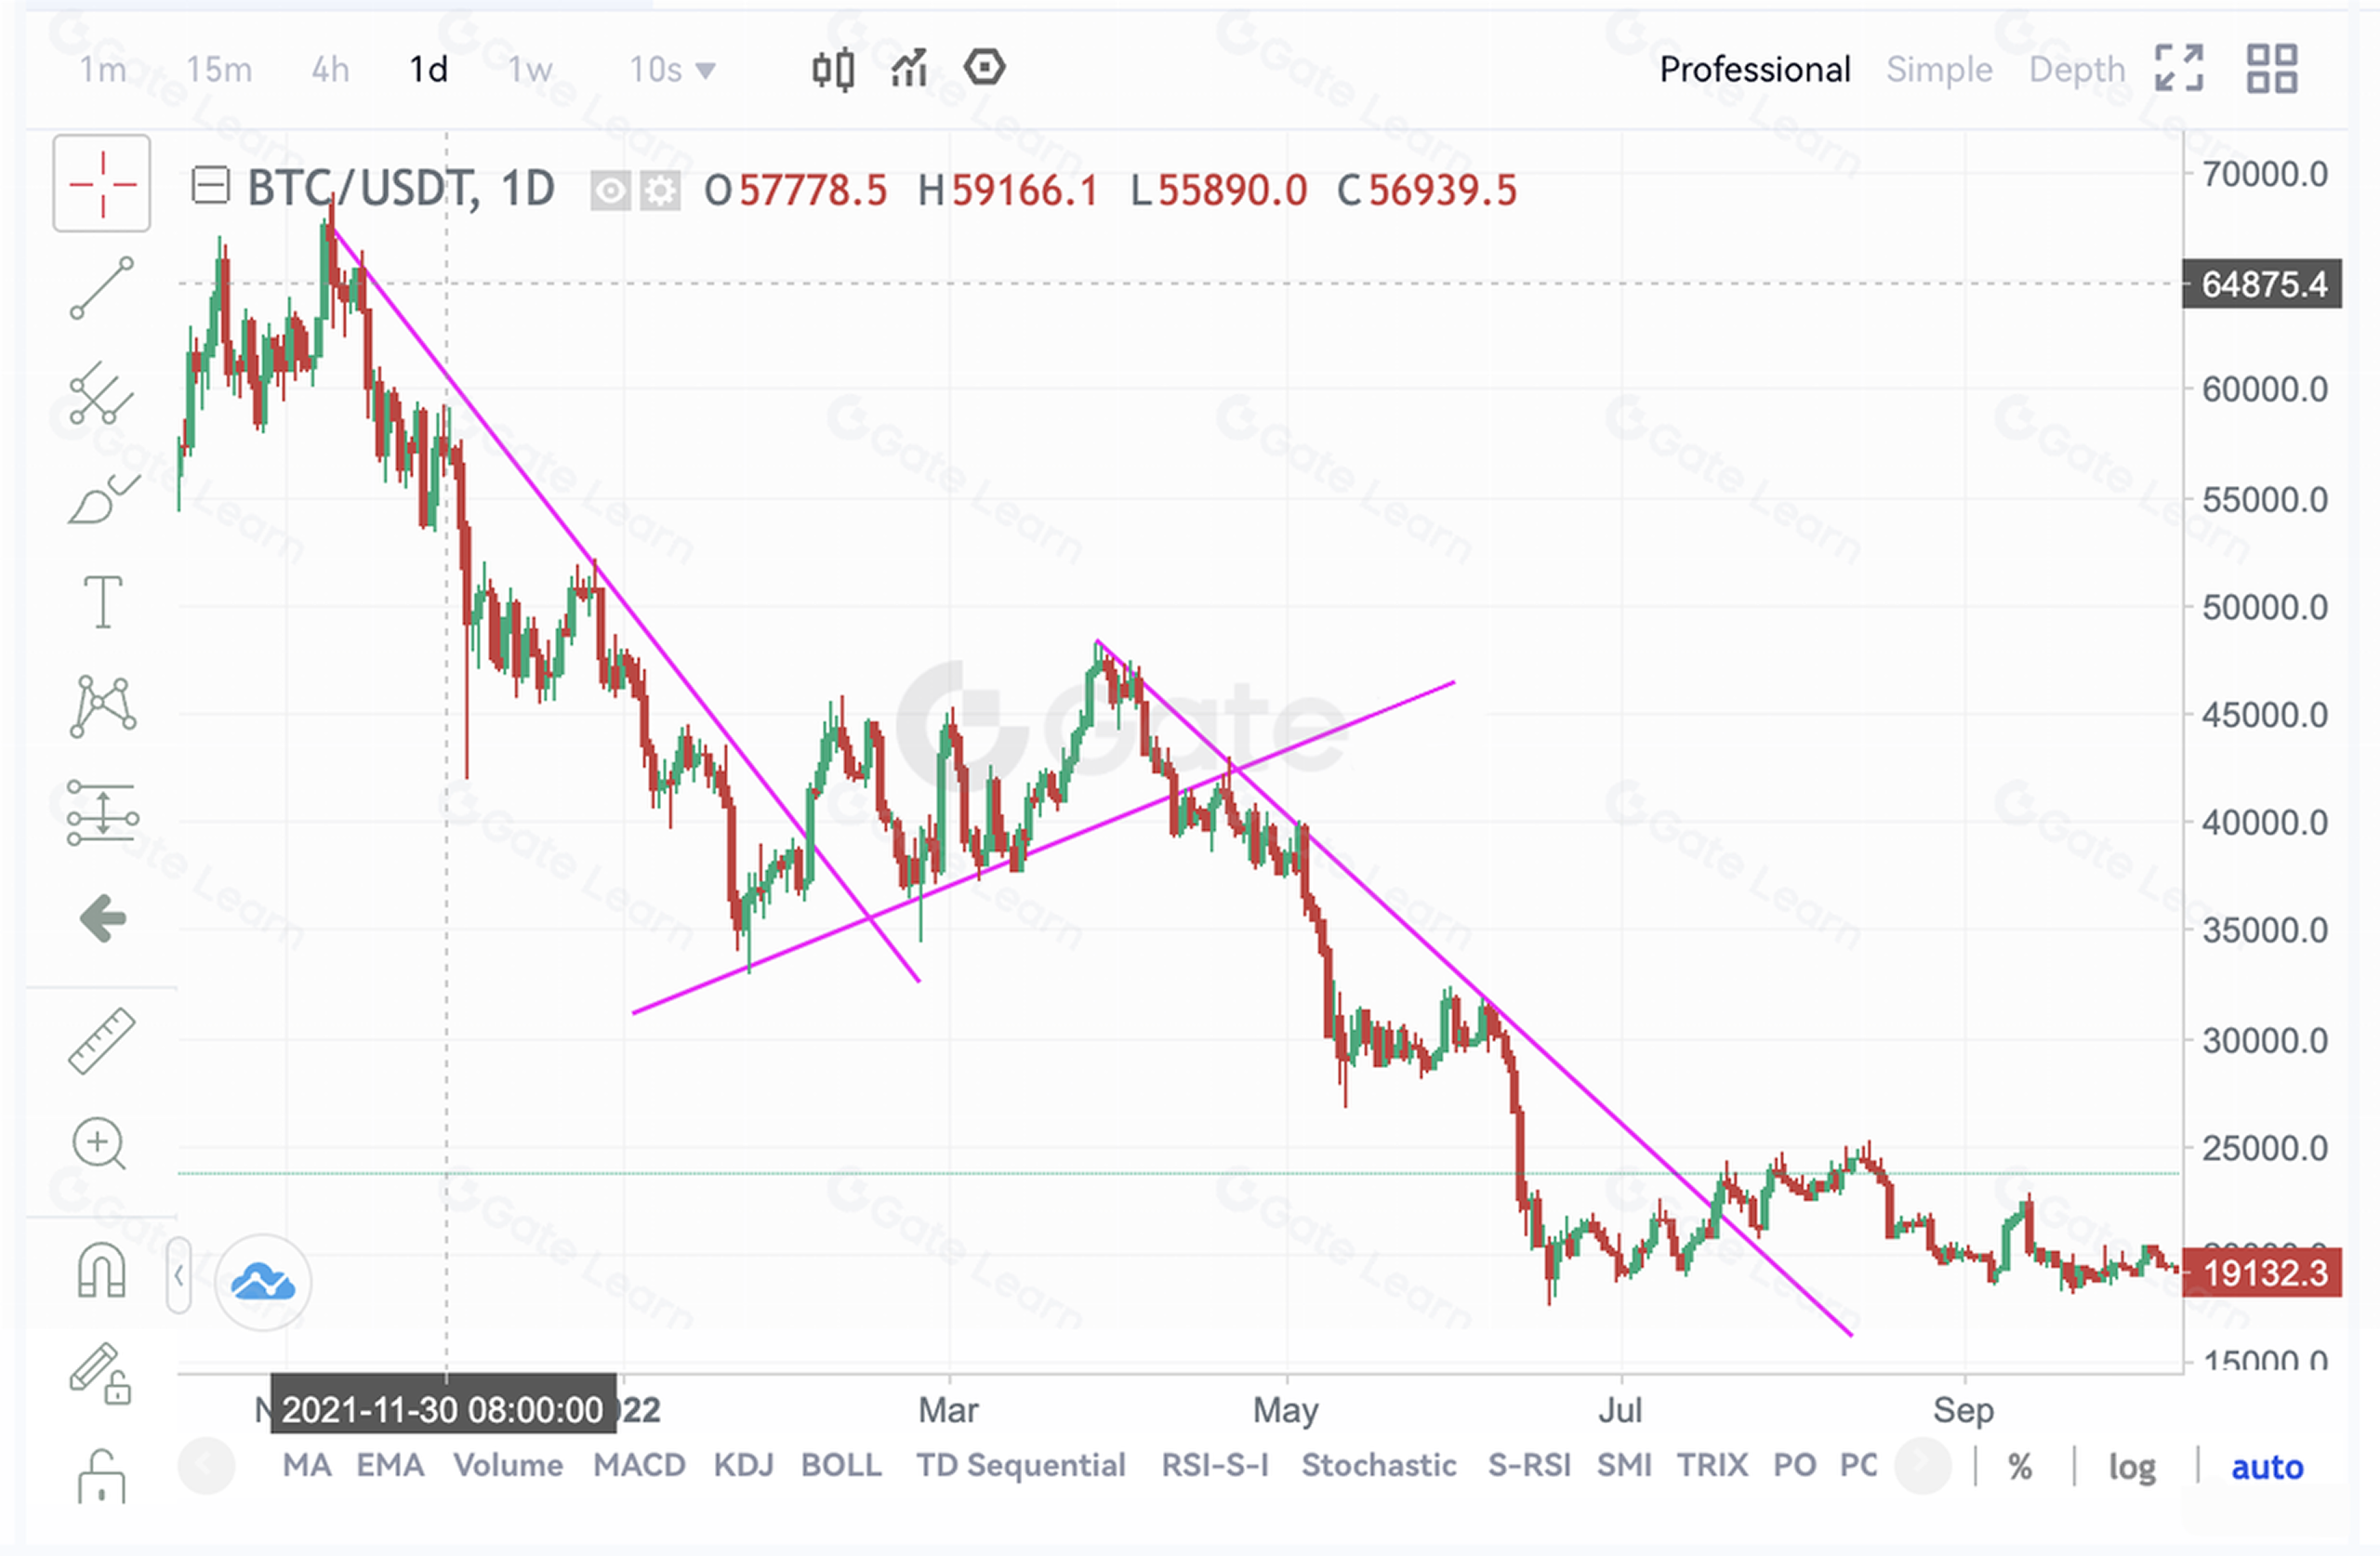
1. Likuidasi posisi: Harga turun dan menembus garis tren kenaikan jangka panjang.
2. Jual pendek: Harga bergerak di atas garis tren kenaikan jangka panjang dalam waktu lama, lalu berbalik turun di bawah garis tren kenaikan jangka menengah.
3. Jual pendek: Harga bergerak di atas garis tren kenaikan jangka panjang dalam waktu lama. Setelah periode kenaikan tajam, harga turun di bawah garis tren kenaikan jangka pendek.
4. Kurangi atau likuidasi posisi: Harga menembus garis tren penurunan jangka panjang, lalu berfluktuasi turun di bawah garis tren kenaikan jangka menengah.
5. Likuidasi posisi: Harga bertahan di bawah garis tren penurunan jangka panjang dalam waktu lama.
Ringkasan
Garis tren merupakan alat sangat penting untuk menentukan waktu pembelian dan penjualan aset. Dalam trading, Anda sebaiknya menggunakannya bersama metode analisis teknikal lain seperti grafik lilin agar tingkat keberhasilan trading semakin tinggi.
Daftar di platform Gate Futures untuk mulai trading!
Disclaimer
Harap diperhatikan, artikel ini hanya untuk tujuan informasi dan bukan merupakan nasihat investasi. Gate tidak bertanggung jawab atas keputusan investasi apa pun. Informasi terkait analisis teknikal, penilaian pasar, keterampilan trading, serta berbagi pengalaman trader tidak dapat dijadikan acuan untuk investasi. Investasi mengandung risiko dan ketidakpastian, dan artikel ini tidak menjamin imbal hasil atas investasi apa pun.