Що таке лінія підтримки та лінія опору
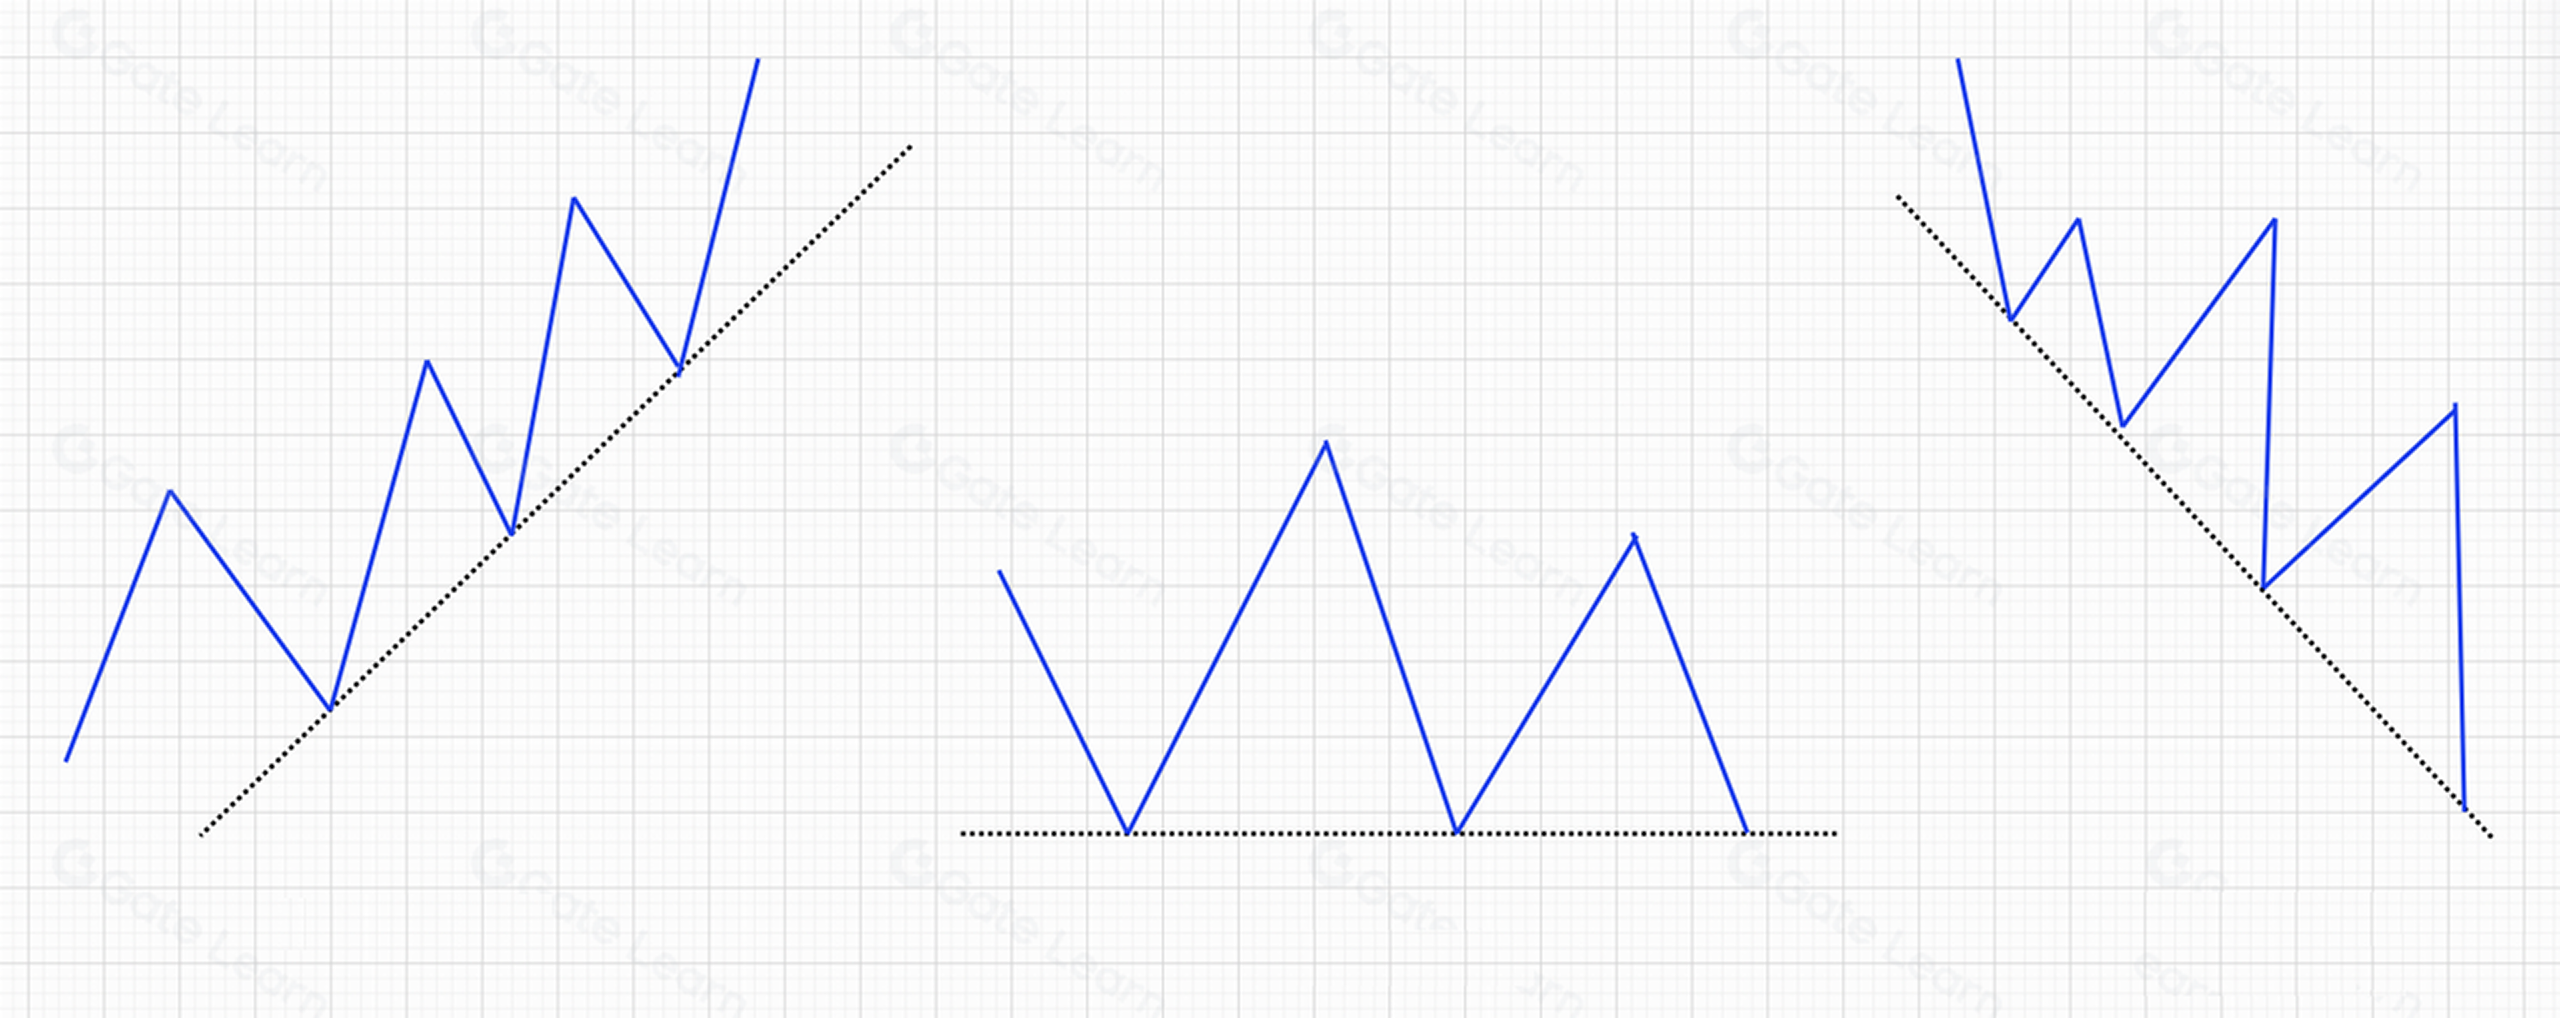
Лінія підтримки — це пряма, що з’єднує дві або більше впадин цінового графіка й не перетинається з ціновою кривою. Вона слугує рівнем підтримки для ціни під час падіння. Тобто коли ціна знижується, вона відбивається від лінії підтримки. Приклад наведено нижче:
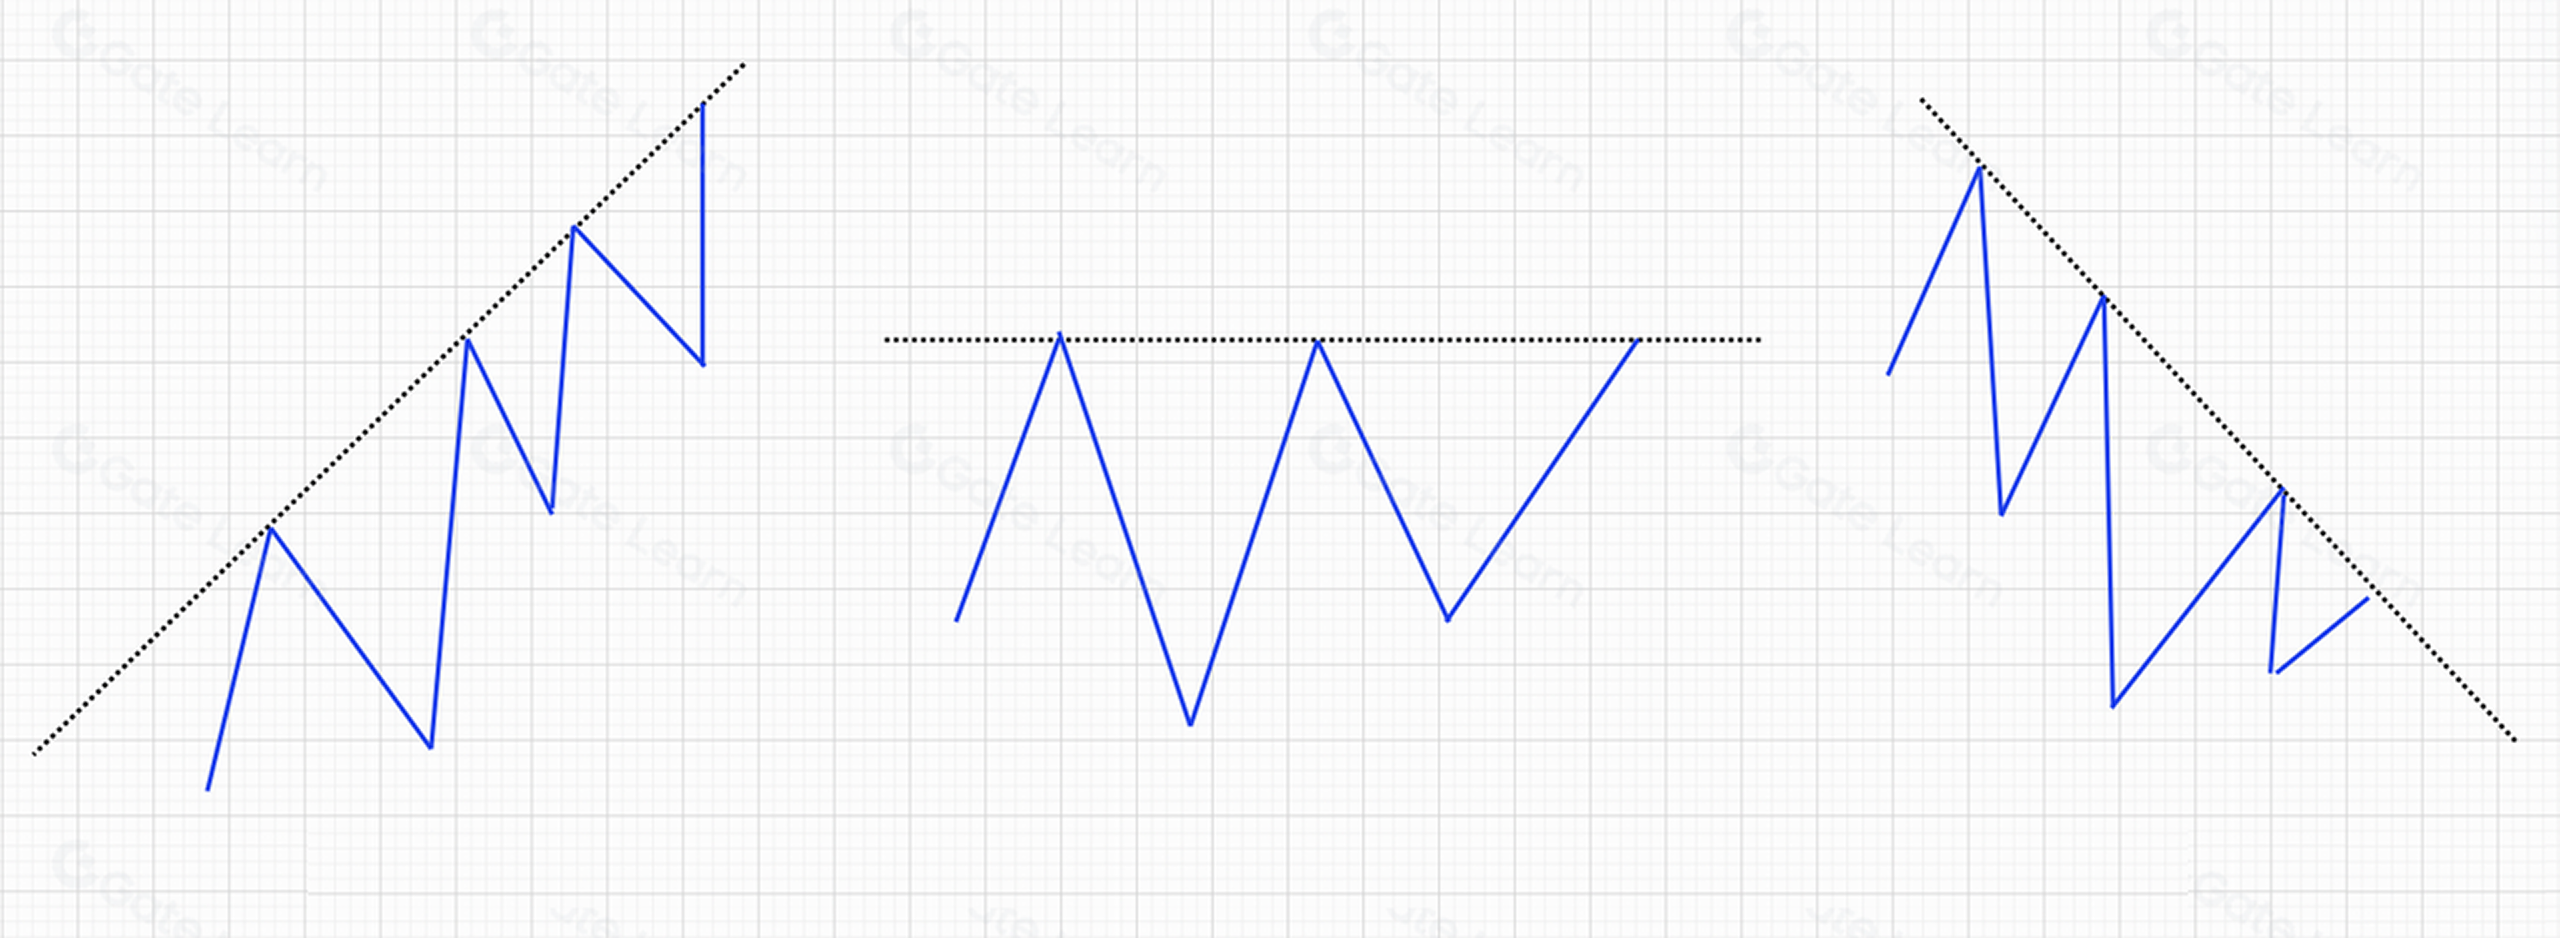
Лінія опору — це пряма, яка з’єднує два чи більше піки цінового графіка й не перетинається з ціновою кривою. Лінія опору обмежує зростання ціни: при підйомі ціни, дійшовши до лінії опору, вона розвертається й знижується.
Лінії підтримки та опору мають різні форми — трендові лінії, канальні лінії, лінії золотого перетину, бічні лінії, лінії шиї технічних фігур, рівні опору й підтримки, а також лінії, що з’єднують відносні максимуми чи мінімуми.
Застосування лінії підтримки
- Зростаюча лінія підтримки має нахил угору.
Дві ключові ознаки зростаючої лінії підтримки:
- Має нахил угору.
- Формується під час бичачого тренду або в періоди цінових коливань.
Технічне значення зростаючої лінії підтримки:
- Якщо ціна, що падає, відштовхується від зростаючої лінії підтримки — це сигнал до купівлі активу.
- Якщо ціна активу опускається нижче зростаючої лінії підтримки, це свідчить про ослаблення купівельної сили й імовірну зміну тренду — сигнал до продажу активу.
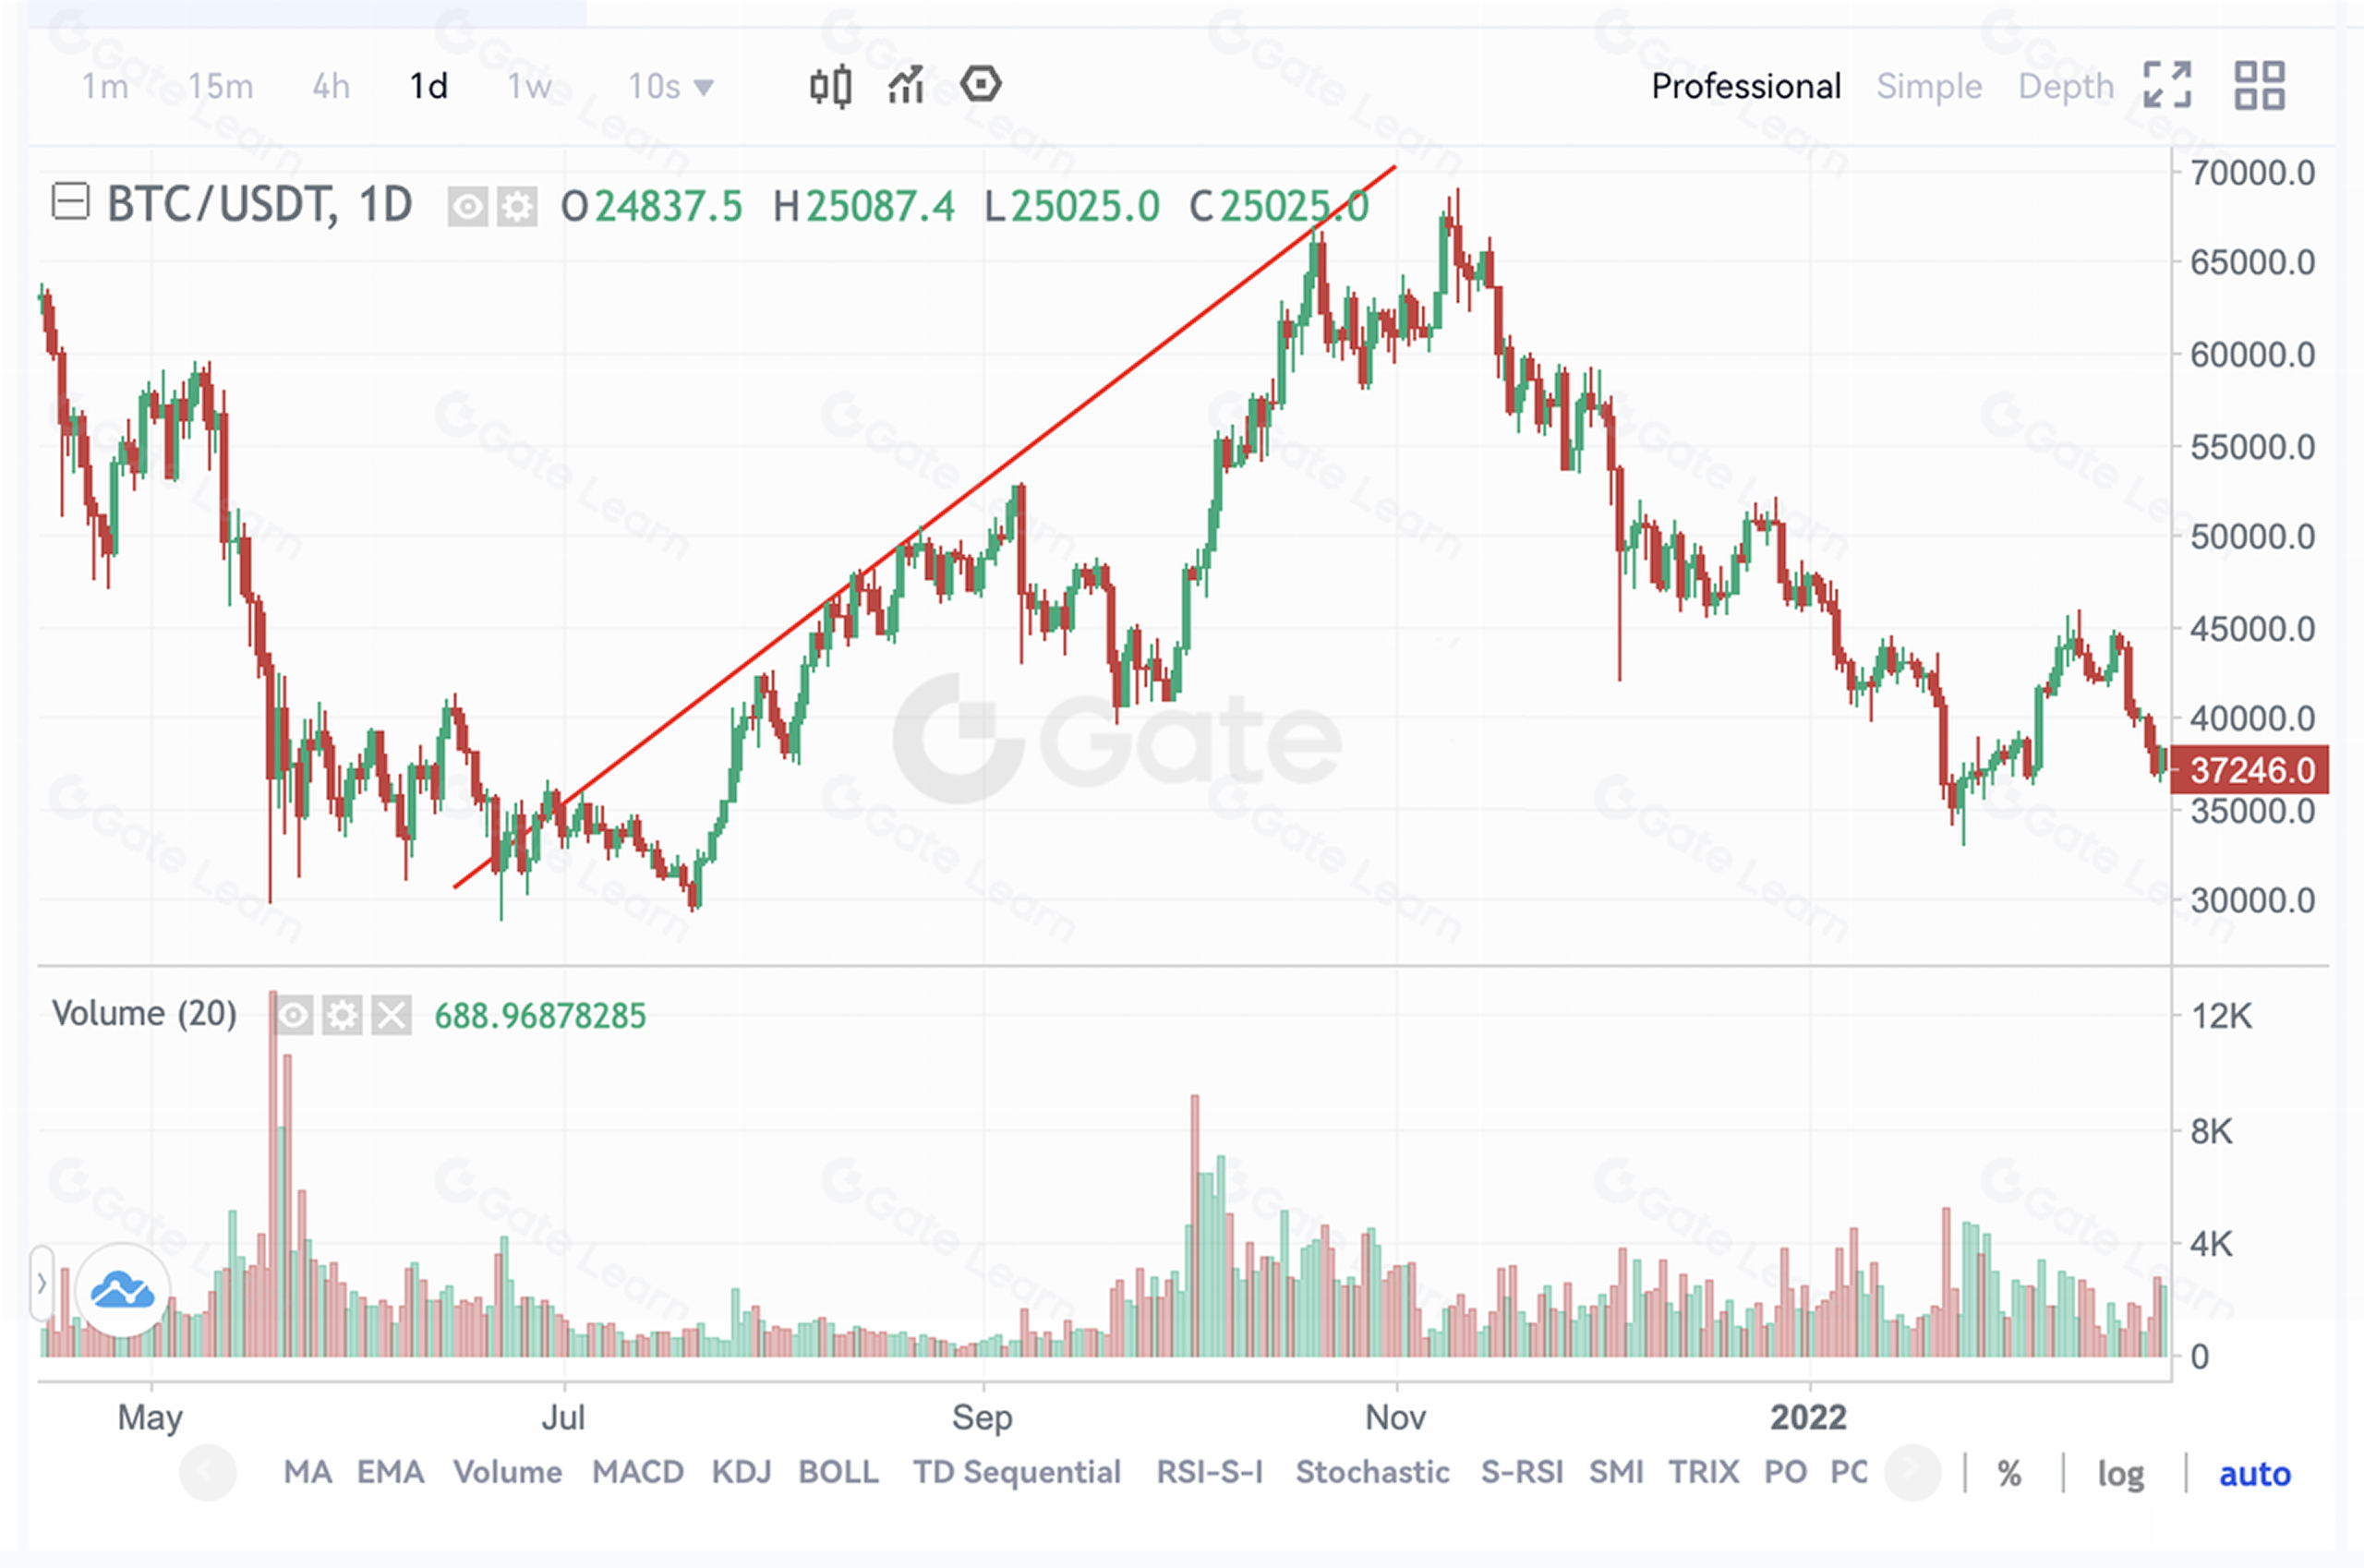
Приклад зростаючої лінії підтримки на ринку BTC
- Спадна лінія підтримки
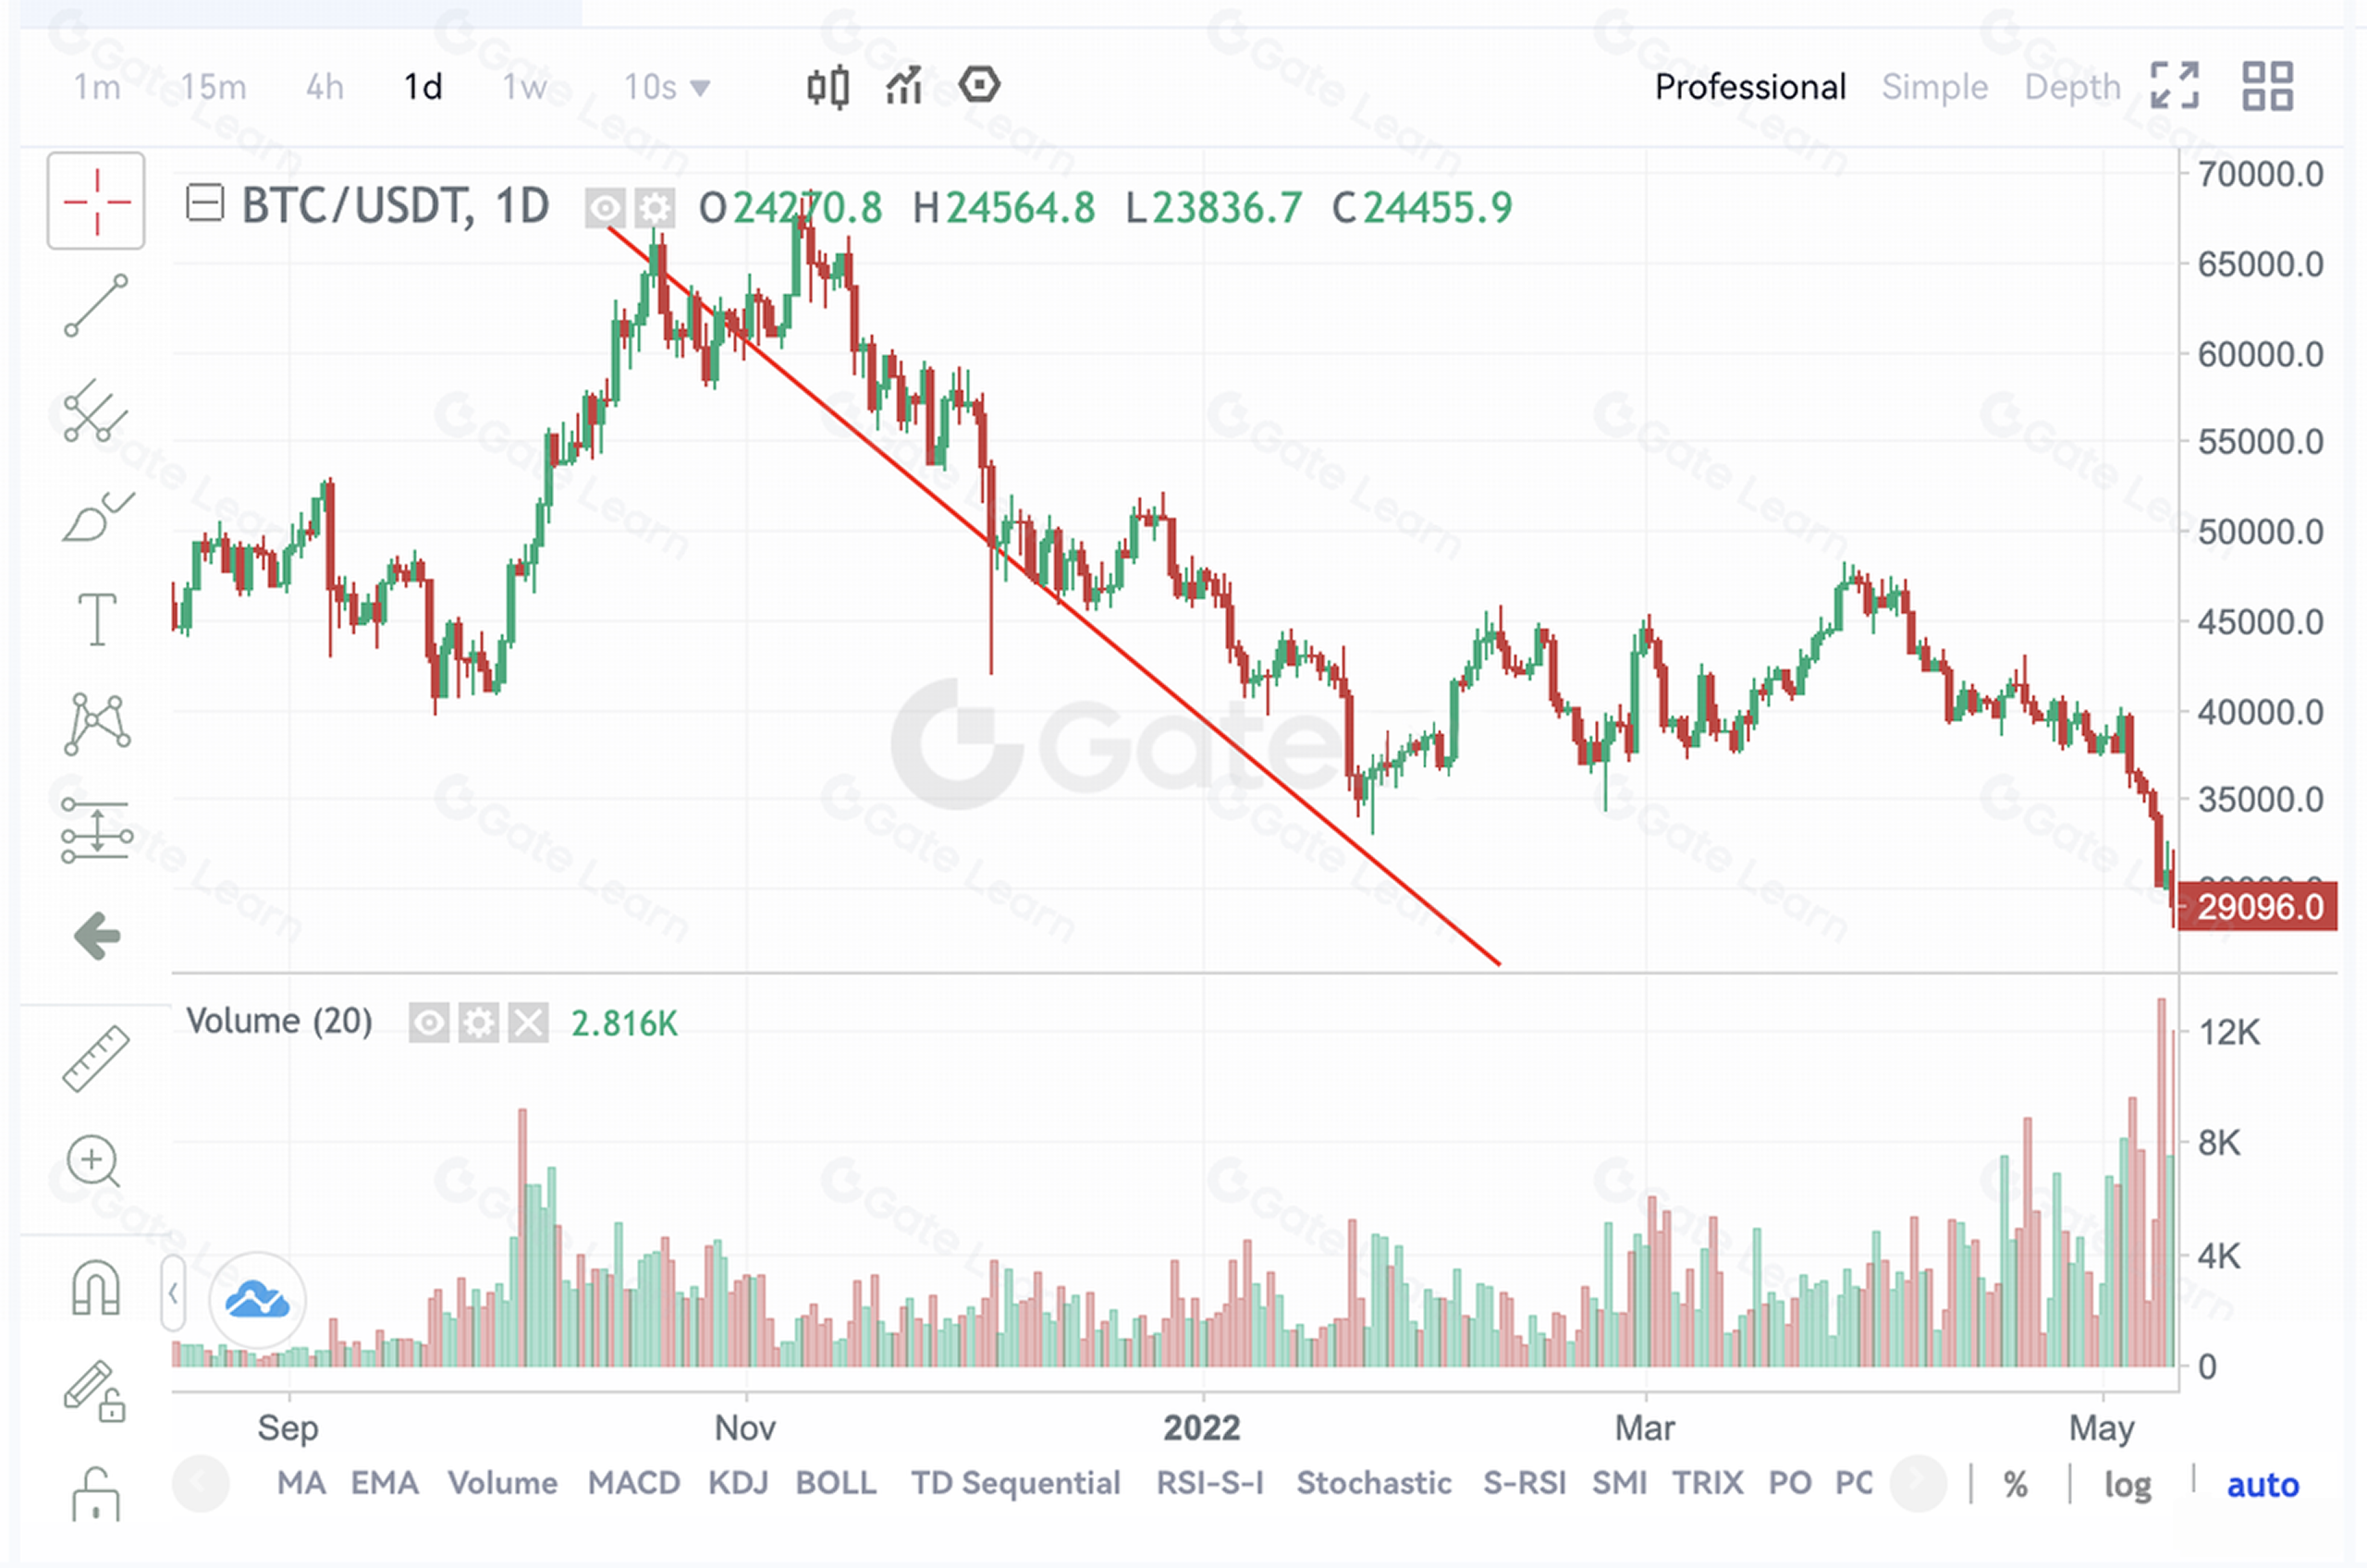
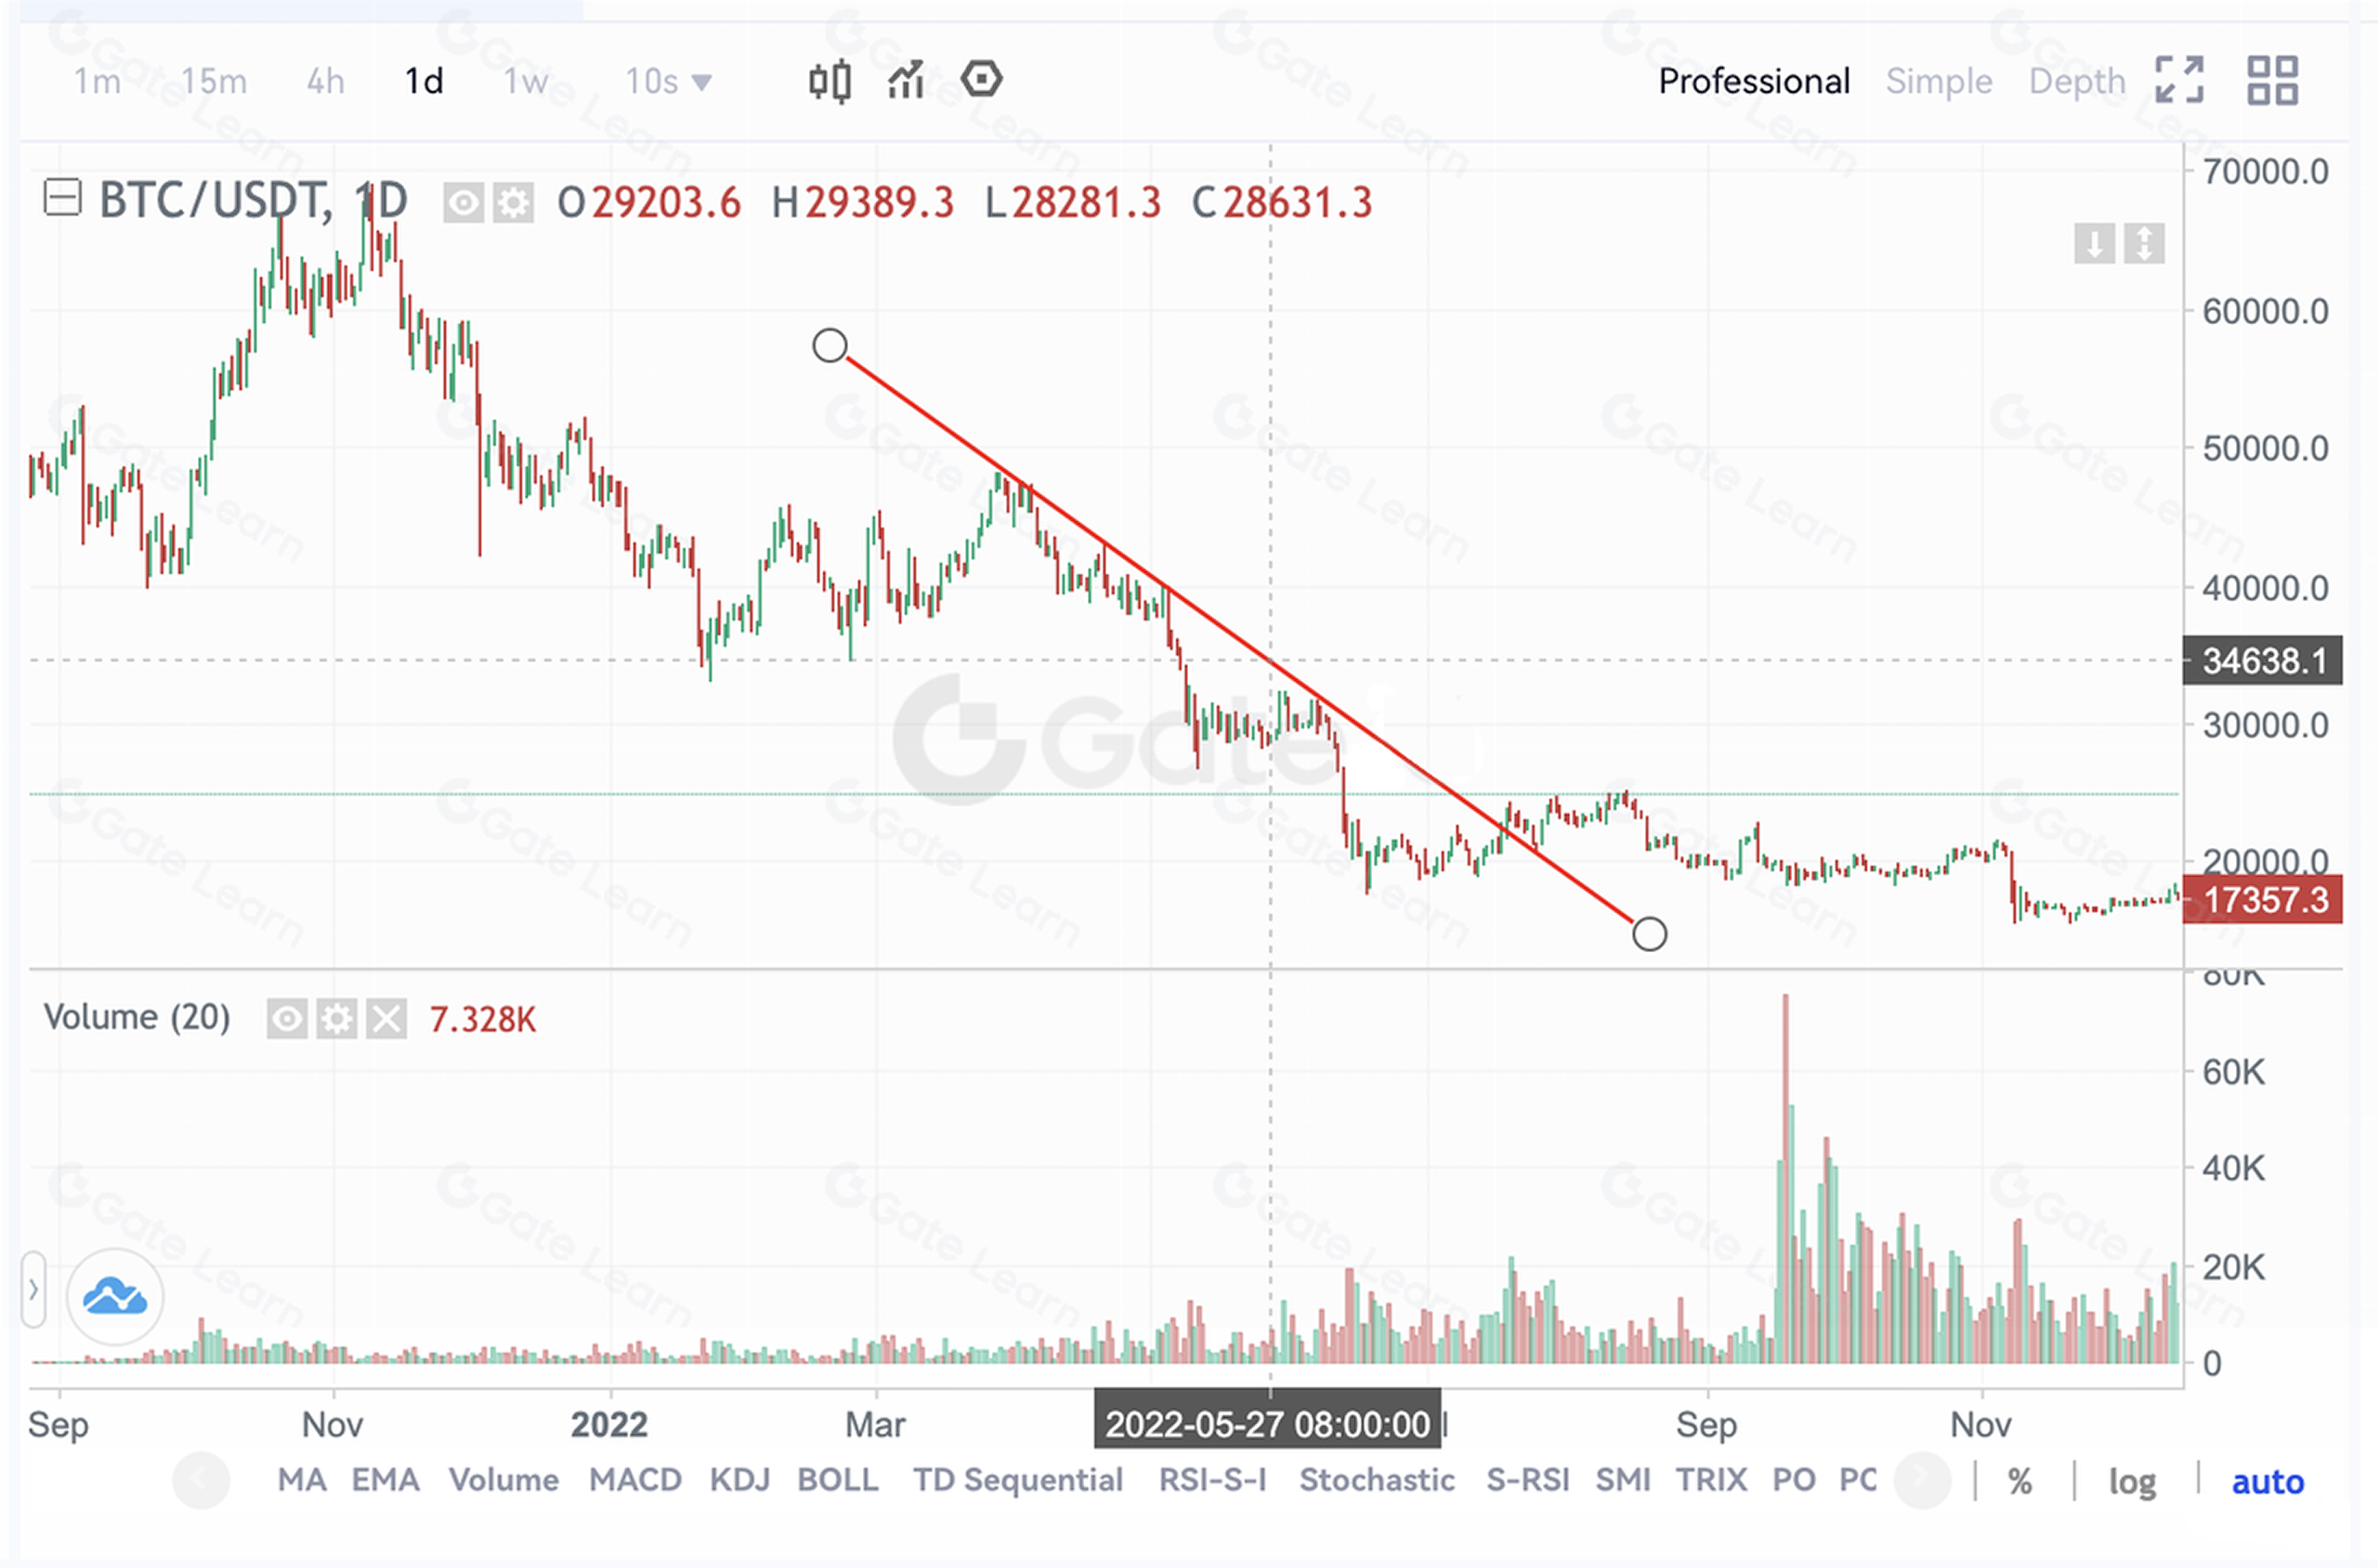
Спадна лінія підтримки має таке ж технічне значення, як і зростаюча. Нижче — приклад спадної лінії підтримки на ринку BTC:
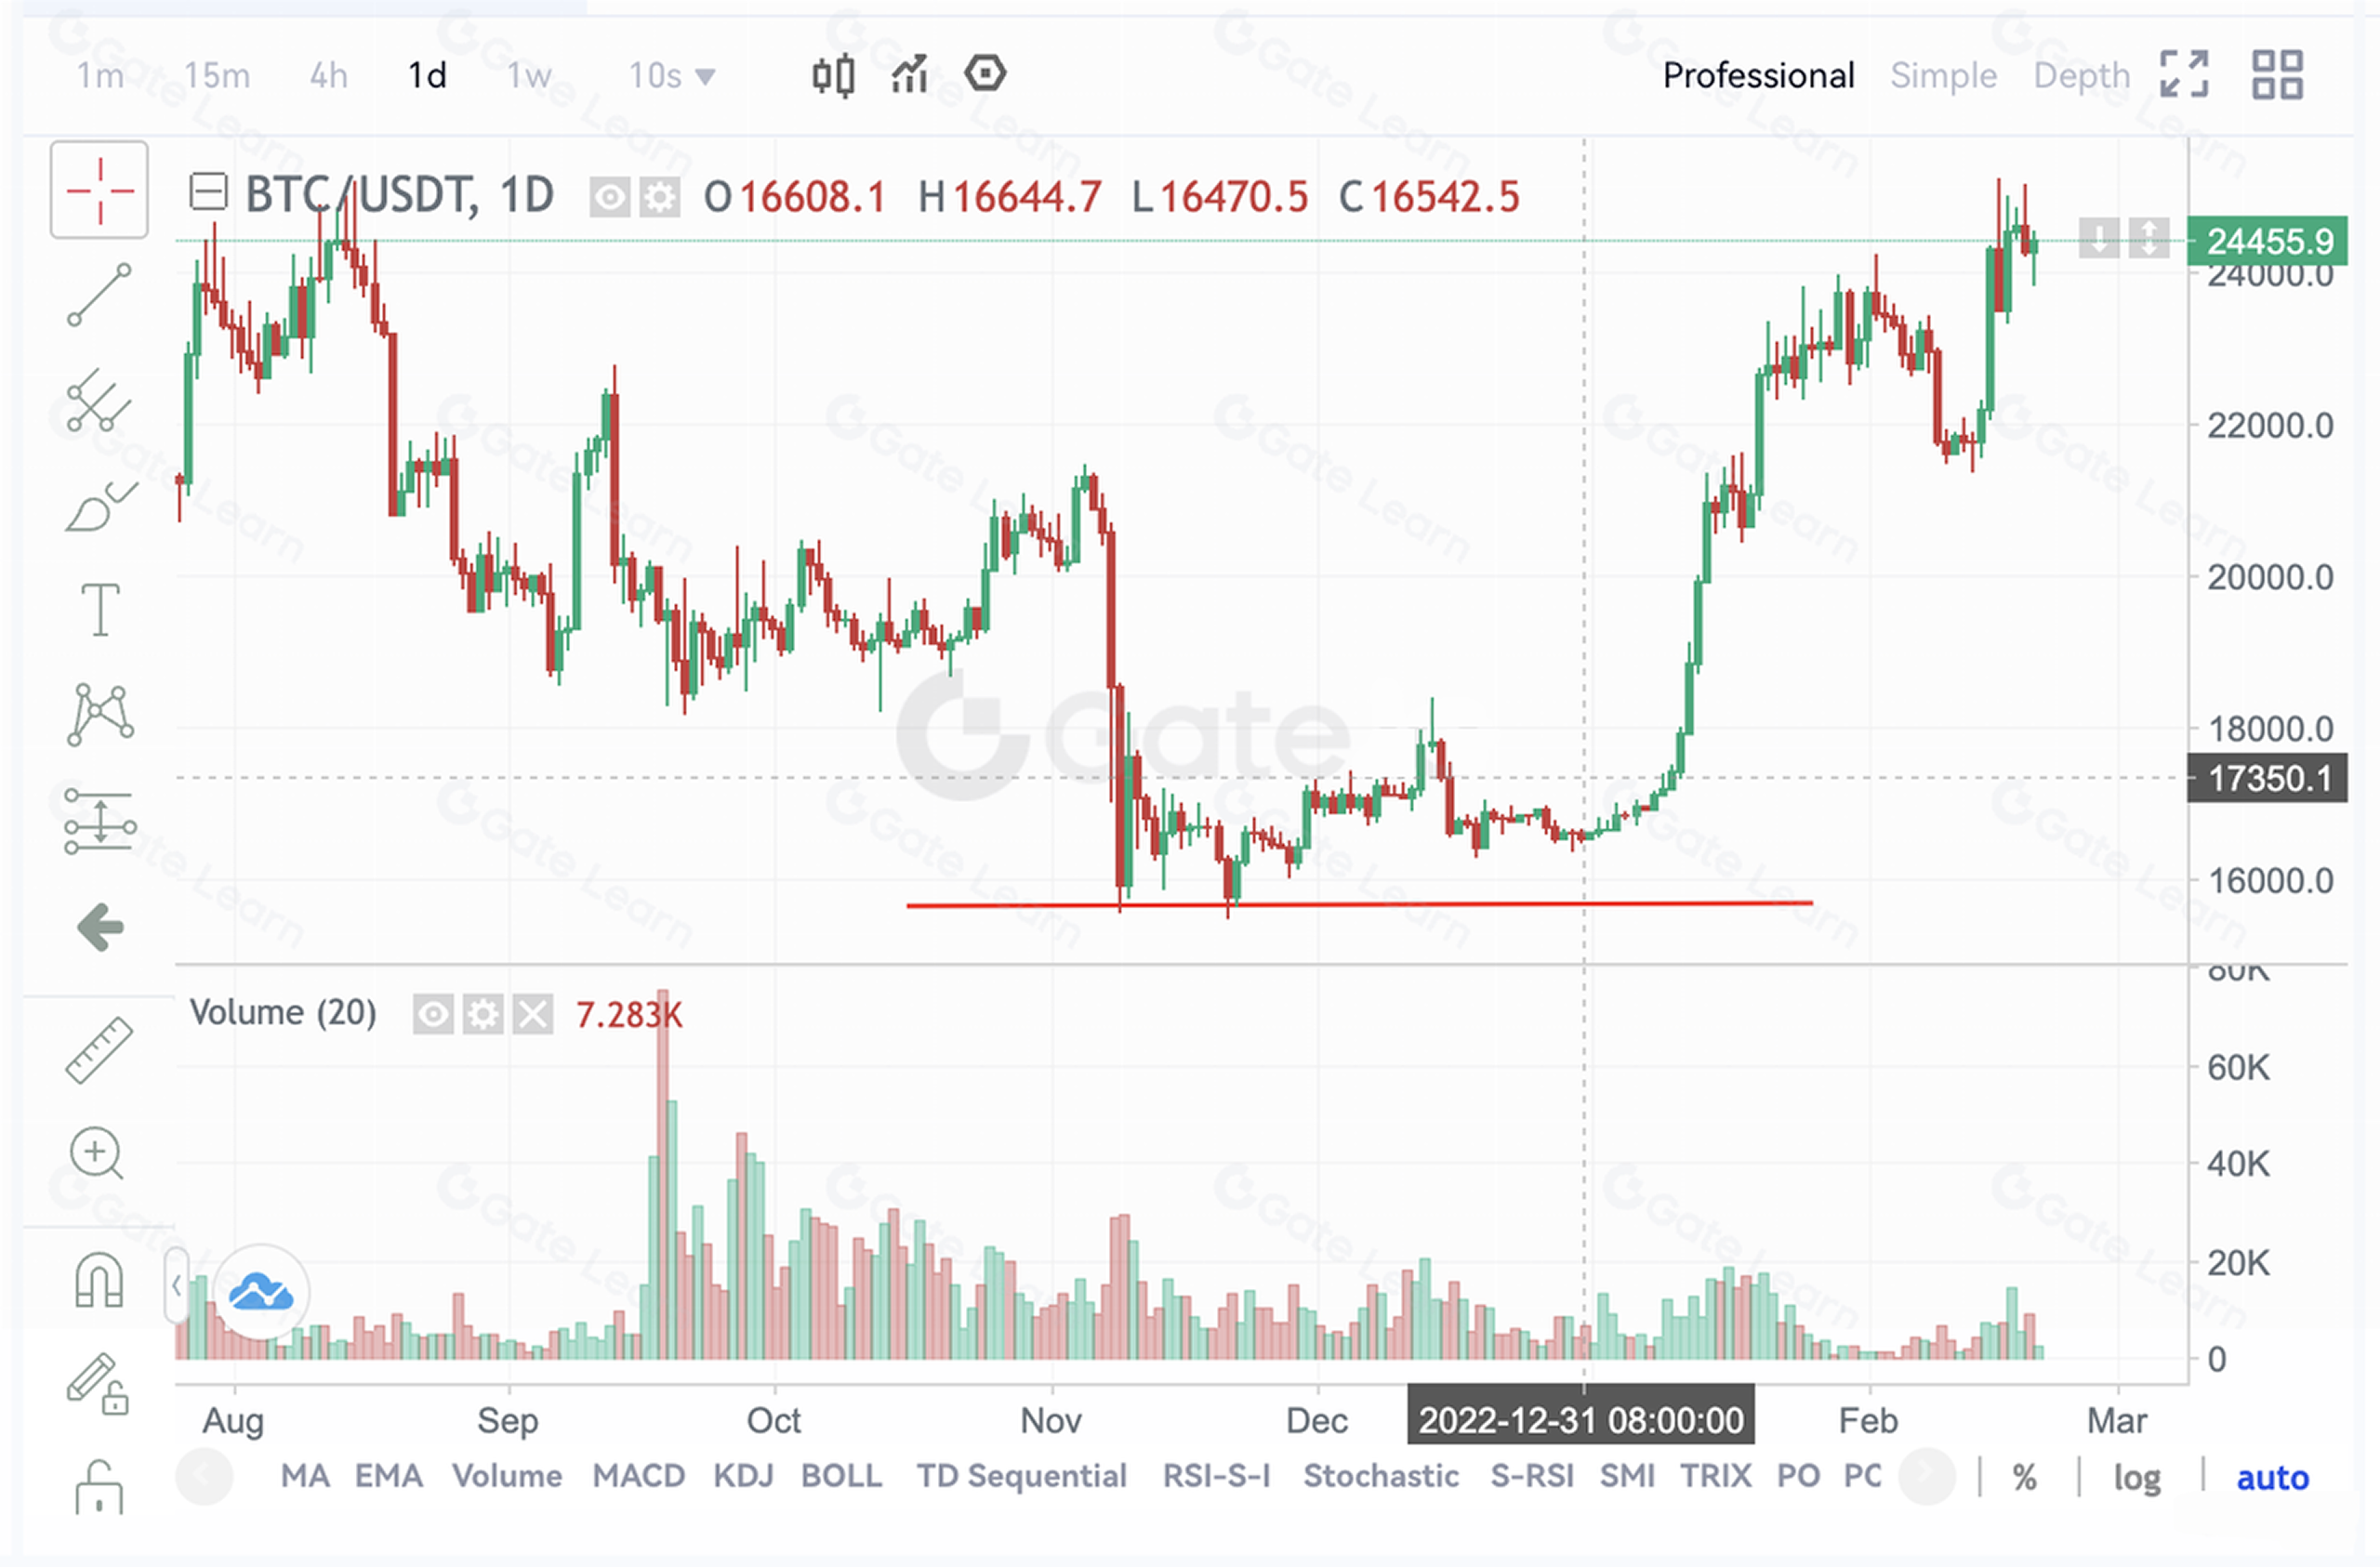
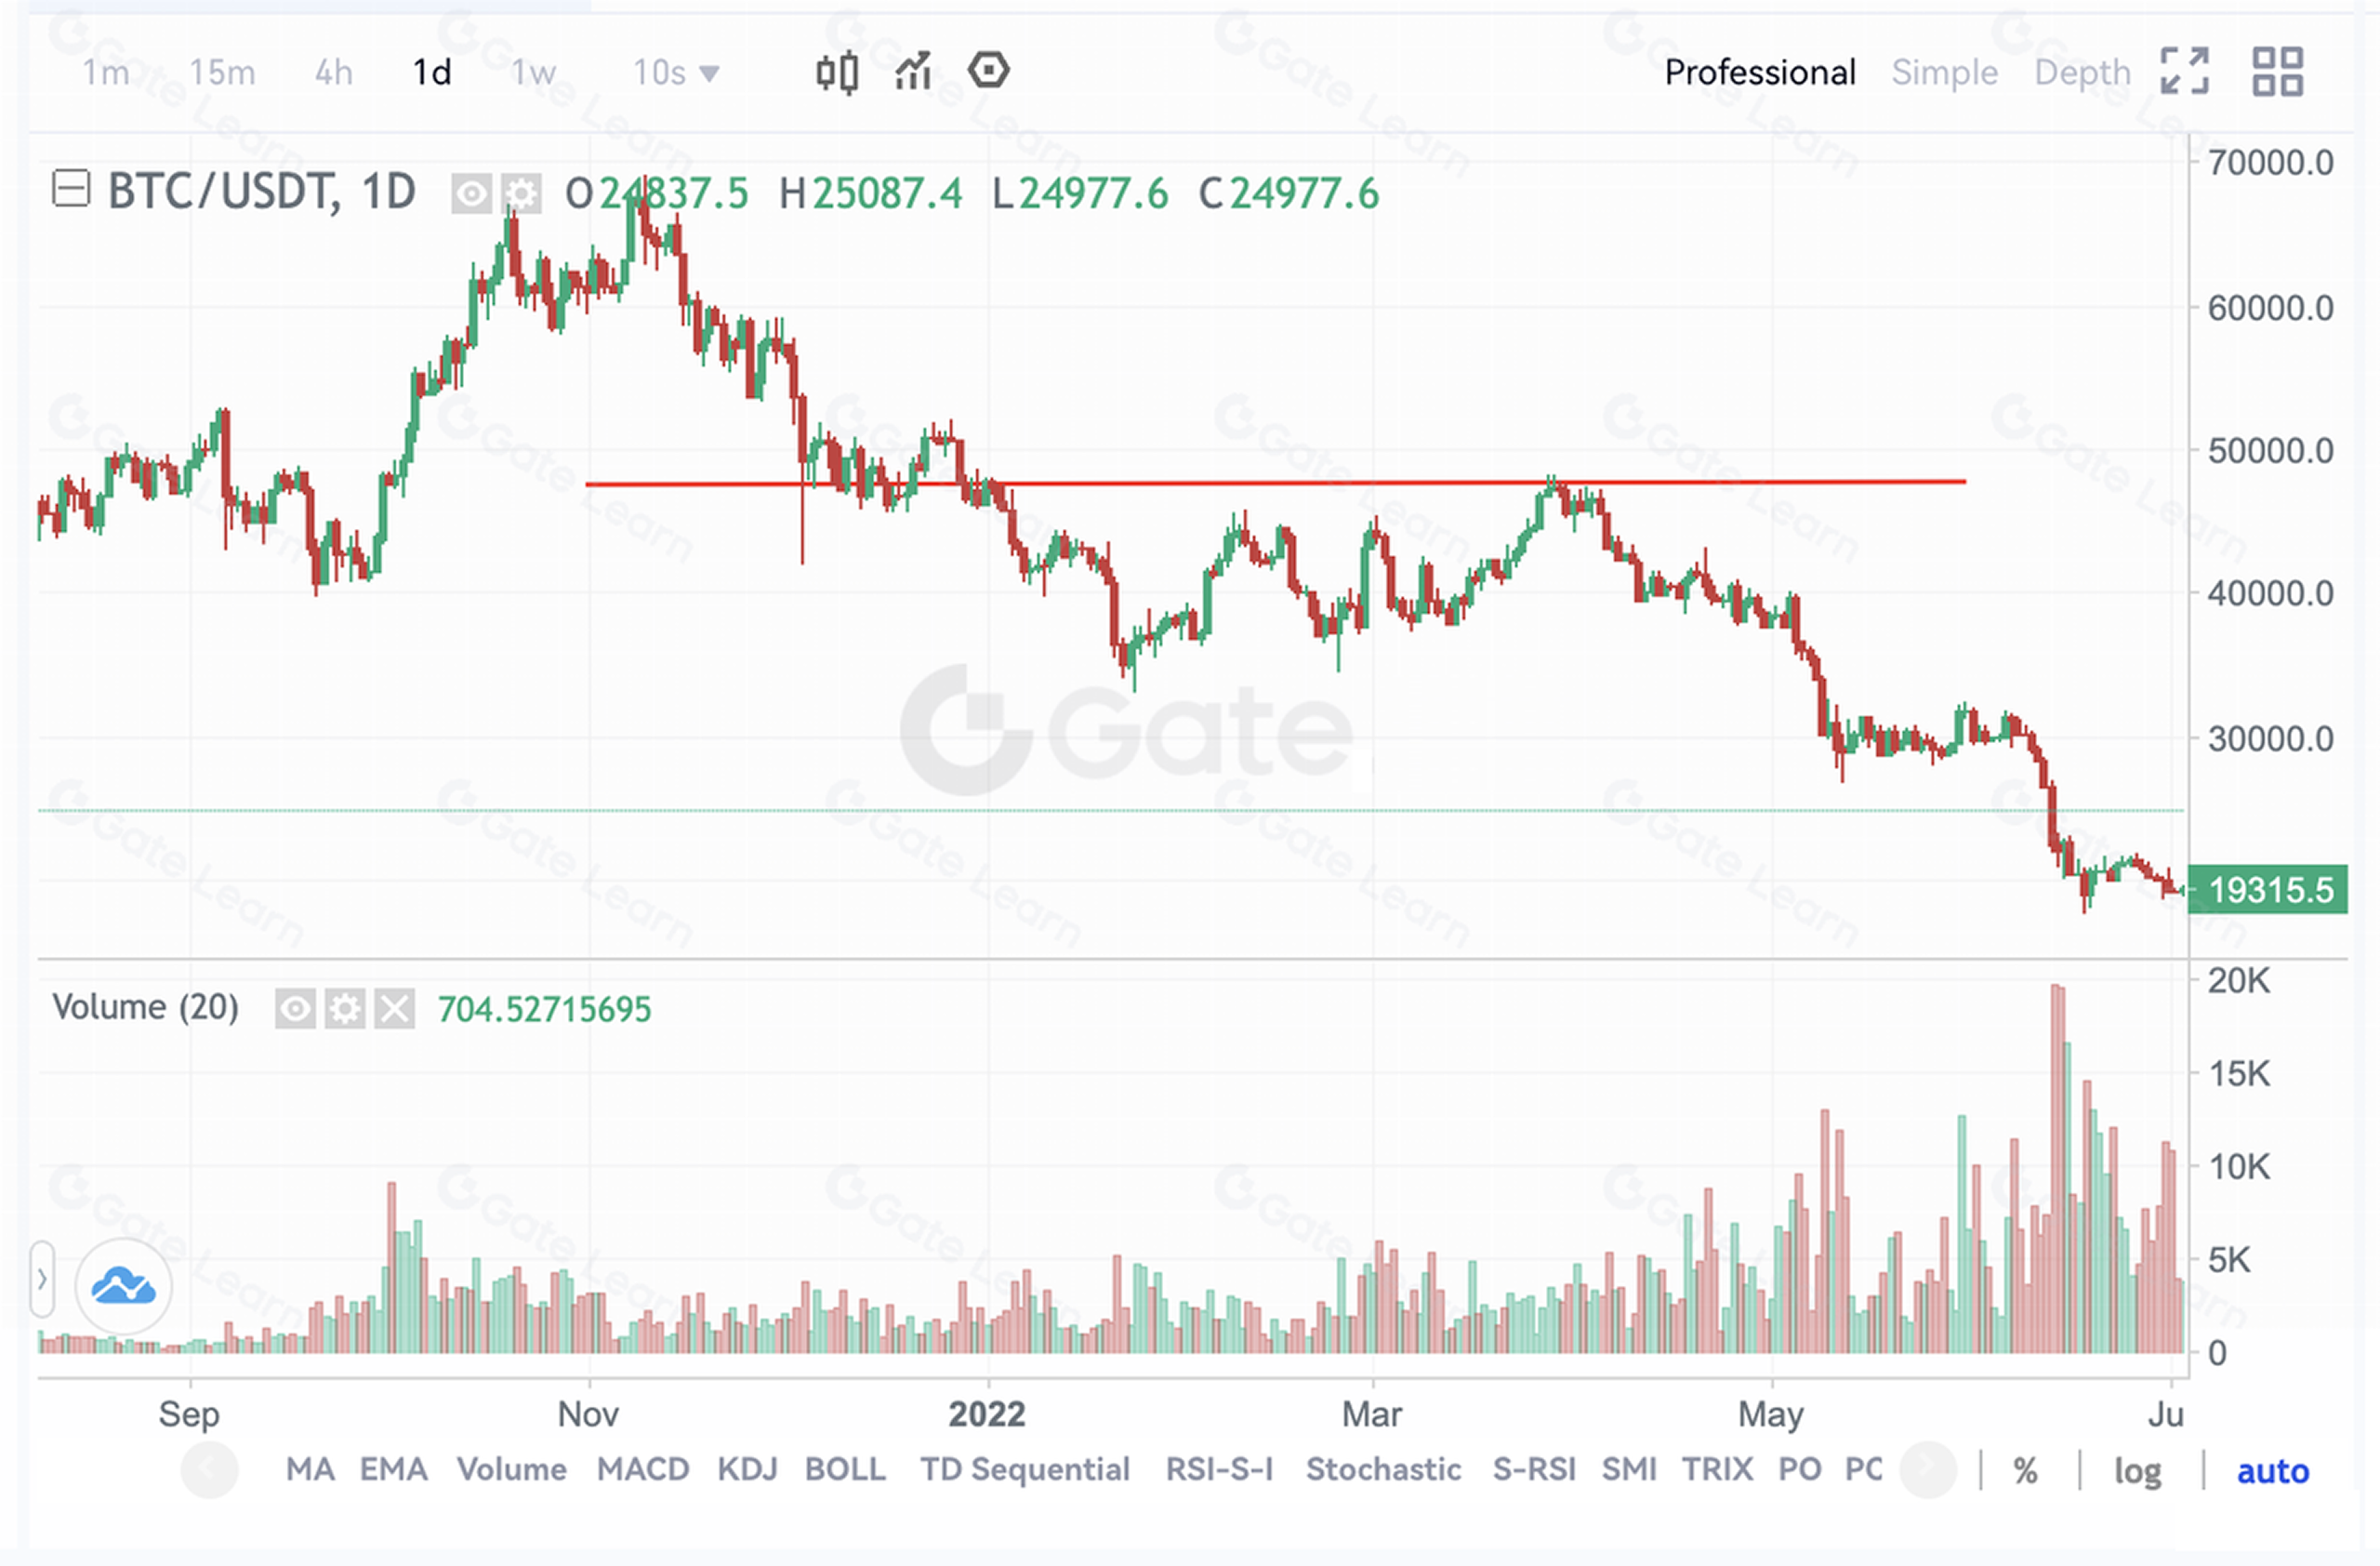
- Горизонтальна лінія підтримки інтерпретується аналогічно. Далі — приклад горизонтальної лінії підтримки на ринку BTC:
Застосування лінії опору
- Зростаюча лінія опору має нахил угору.
Дві ключові ознаки зростаючої лінії опору:
- Має нахил угору.
- Формується під час бичачого тренду або в періоди цінових коливань.
Технічне значення зростаючої лінії опору:
- Коли ціна, що зростала, починає знижуватися і досягає рівня лінії опору — це сигнал для відкриття коротких позицій.
- Якщо ціна пробиває зростаючу лінію опору, це свідчить про потенційне сильне зростання — сигнал утримувати або збільшувати позиції.
Приклад зростаючої лінії опору на ринку BTC
- Горизонтальна лінія опору має таке ж технічне значення, як і зростаюча. Далі — приклад для ринку BTC:
- Спадна лінія опору має таке ж технічне значення, як і зростаюча. Далі — приклад спадної лінії опору на ринку BTC:
Підсумки
Лінії підтримки, опору й трендові лінії — це умовні інструменти, які трейдери використовують для аналізу ринкового тренду та визначення моментів купівлі або продажу активів. Рекомендуємо додатково користуватися іншими інструментами для точнішого прогнозування ринку.
Зареєструйтеся на платформі Gate Futures, щоб розпочати торгівлю!
Відмова від відповідальності
Зверніть увагу: цей матеріал підготовлено виключно з інформаційною метою і не є інвестиційною порадою. Gate не несе відповідальності за жодні інвестиційні рішення. Інформація щодо технічного аналізу, ринкових оцінок, торгових навичок і досвіду трейдерів не повинна сприйматися як основа для інвестицій. Інвестування пов’язане з ризиками та невизначеністю, і цей матеріал не гарантує прибутку від жодної інвестиції.
Відмова від відповідальності
* Криптоінвестиції пов'язані зі значними ризиками. Дійте обережно. Курс не є інвестиційною консультацією.
* Курс створений автором, який приєднався до Gate Learn. Будь-яка думка, висловлена автором, не є позицією Gate Learn.