Trade
Basic
Futures
Futures
Hundreds of contracts settled in USDT or BTC
TradFi
Gold
Trade global traditional assets with USDT in one place
Options
Hot
Trade European-style vanilla options
Unified Account
Maximize your capital efficiency
Demo Trading
Futures Kickoff
Get prepared for your futures trading
Futures Events
Participate in events to win generous rewards
Demo Trading
Use virtual funds to experience risk-free trading
Earn
Launch
CandyDrop
Collect candies to earn airdrops
Launchpool
Quick staking, earn potential new tokens
HODLer Airdrop
Hold GT and get massive airdrops for free
Launchpad
Be early to the next big token project
Alpha Points
Trade on-chain assets and enjoy airdrop rewards!
Futures Points
Earn futures points and claim airdrop rewards
Investment
Simple Earn
Earn interests with idle tokens
Auto-Invest
Auto-invest on a regular basis
Dual Investment
Buy low and sell high to take profits from price fluctuations
Soft Staking
Earn rewards with flexible staking
Crypto Loan
0 Fees
Pledge one crypto to borrow another
Lending Center
One-stop lending hub
VIP Wealth Hub
Customized wealth management empowers your assets growth
Private Wealth Management
Customized asset management to grow your digital assets
Quant Fund
Top asset management team helps you profit without hassle
Staking
Stake cryptos to earn in PoS products
Smart Leverage
New
No forced liquidation before maturity, worry-free leveraged gains
GUSD Minting
Use USDT/USDC to mint GUSD for treasury-level yields
More
JackBTC
No content yet
Pin
JackBtc
- Reward
- 3
- Comment
- Repost
- Share
- Reward
- like
- Comment
- Repost
- Share
- Reward
- like
- Comment
- Repost
- Share
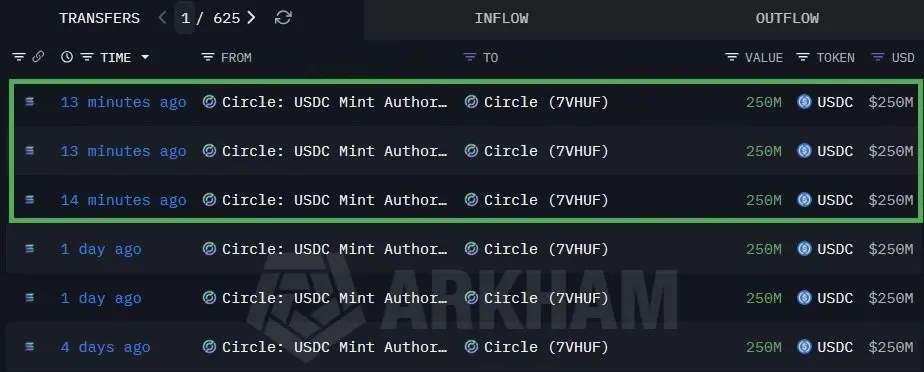
$750 million worth of USDC has just been issued.New capital is flowing into the market.
- Reward
- 1
- Comment
- Repost
- Share
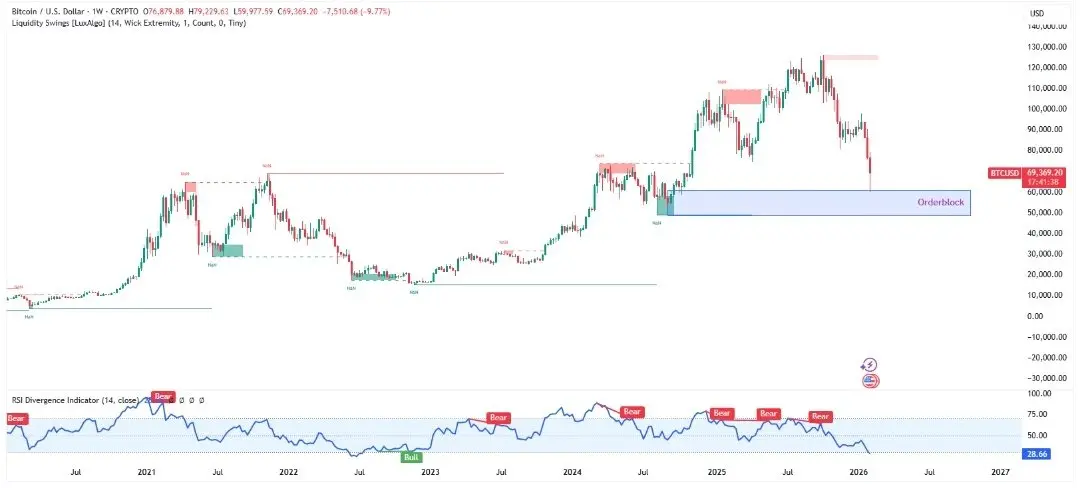
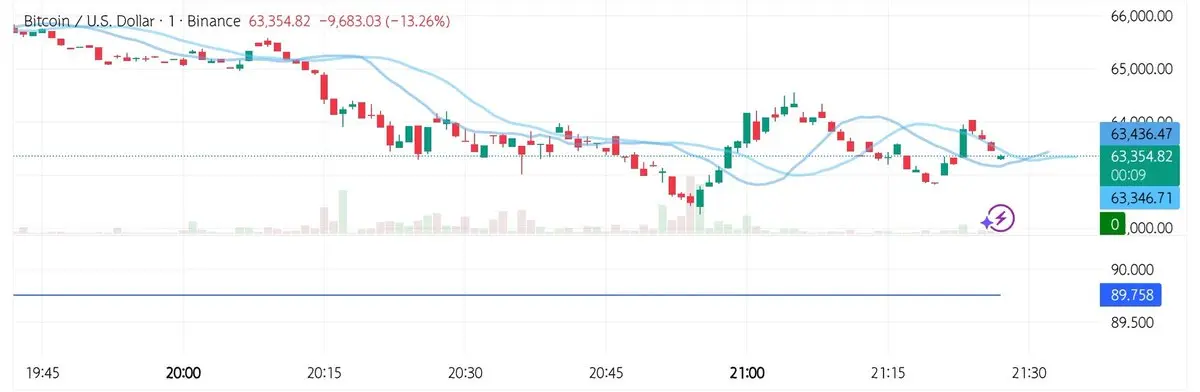
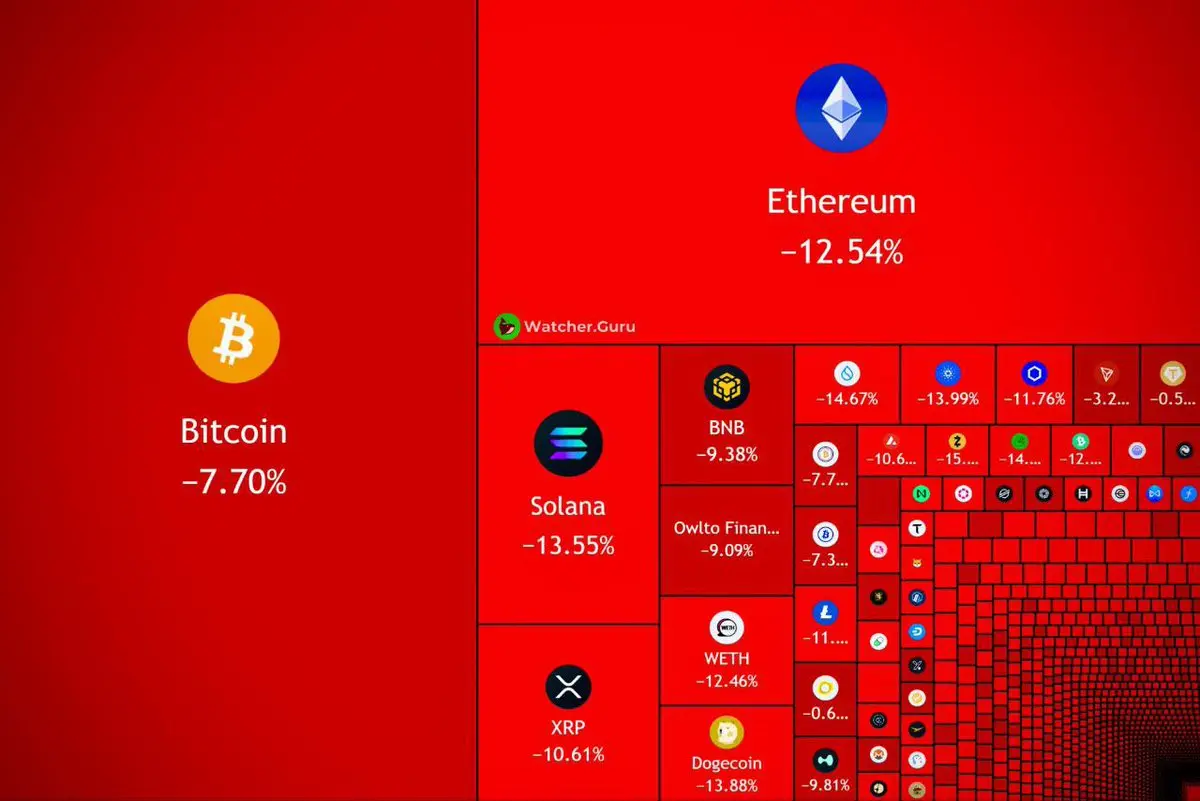
Over $230 billion has vanished from the market.Hopefully, you didn’t go in with everything on the line.
- Reward
- 2
- Comment
- Repost
- Share
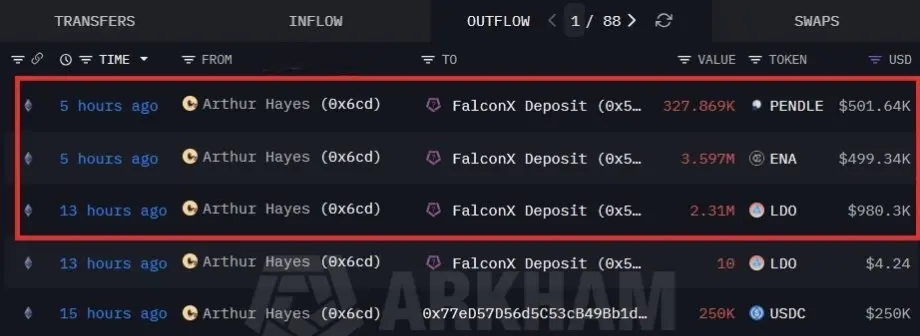
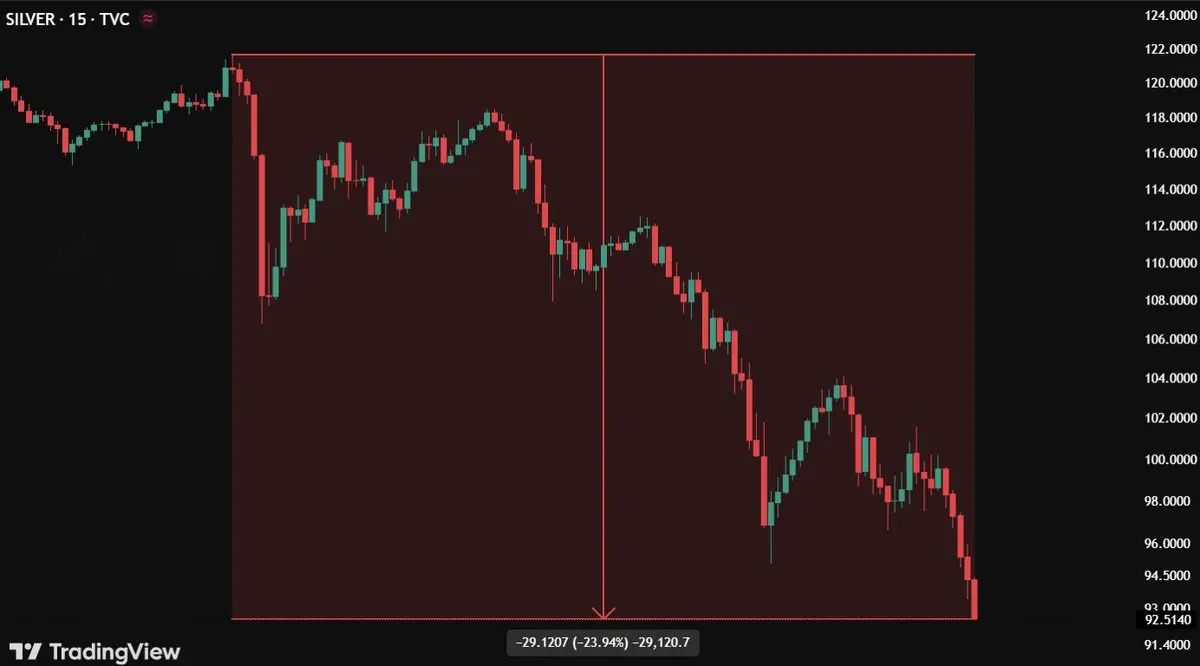
Silver just suffered a brutal sell-off, dropping nearly a quarter in 24 hours and erasing around $1.6 trillion in value.Naturally, questions are starting to surface, is the team still fully committed to the project?
- Reward
- 2
- Comment
- Repost
- Share
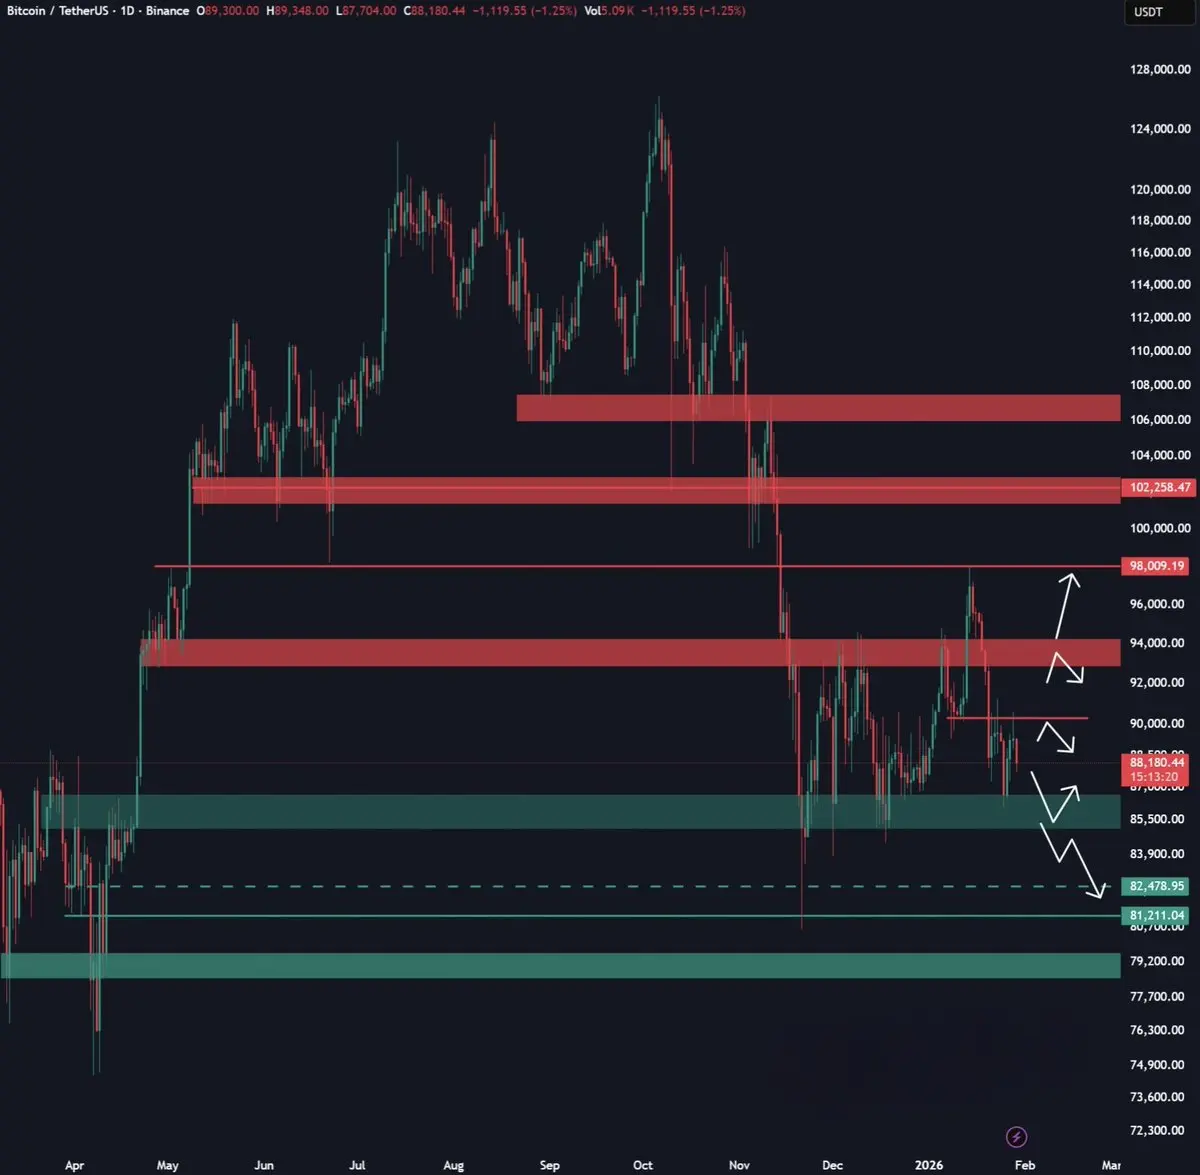
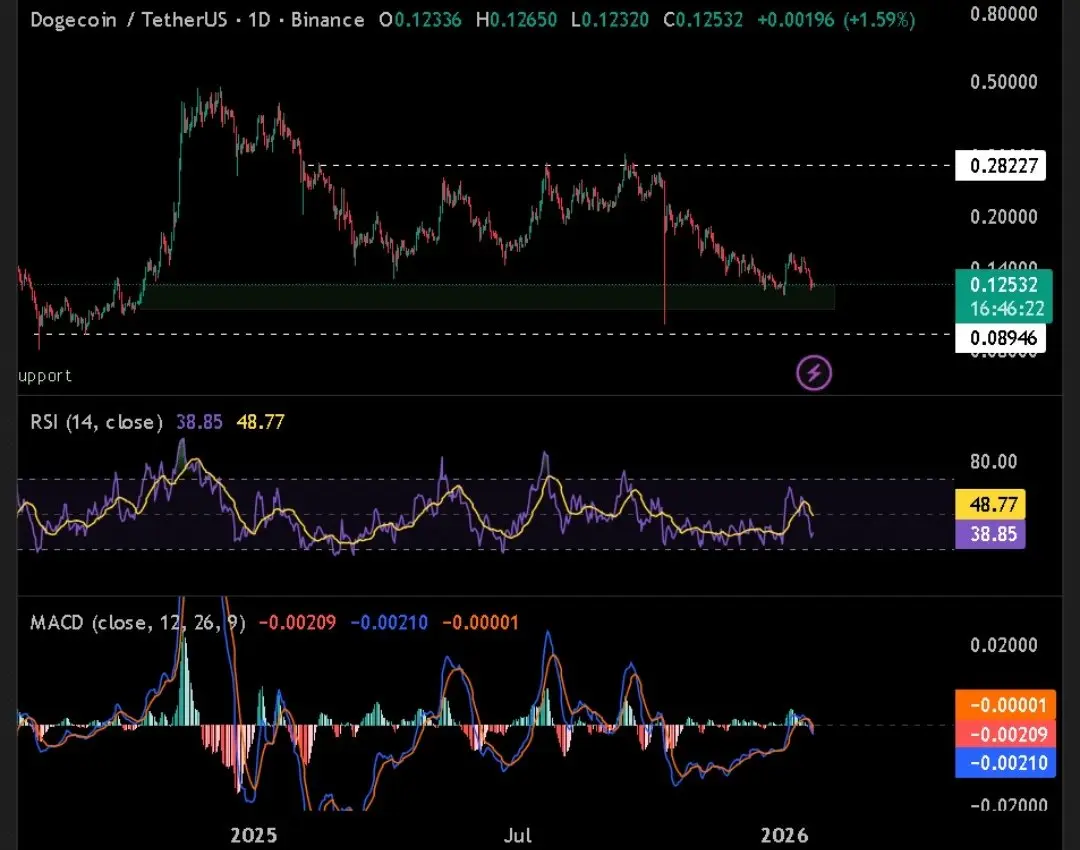
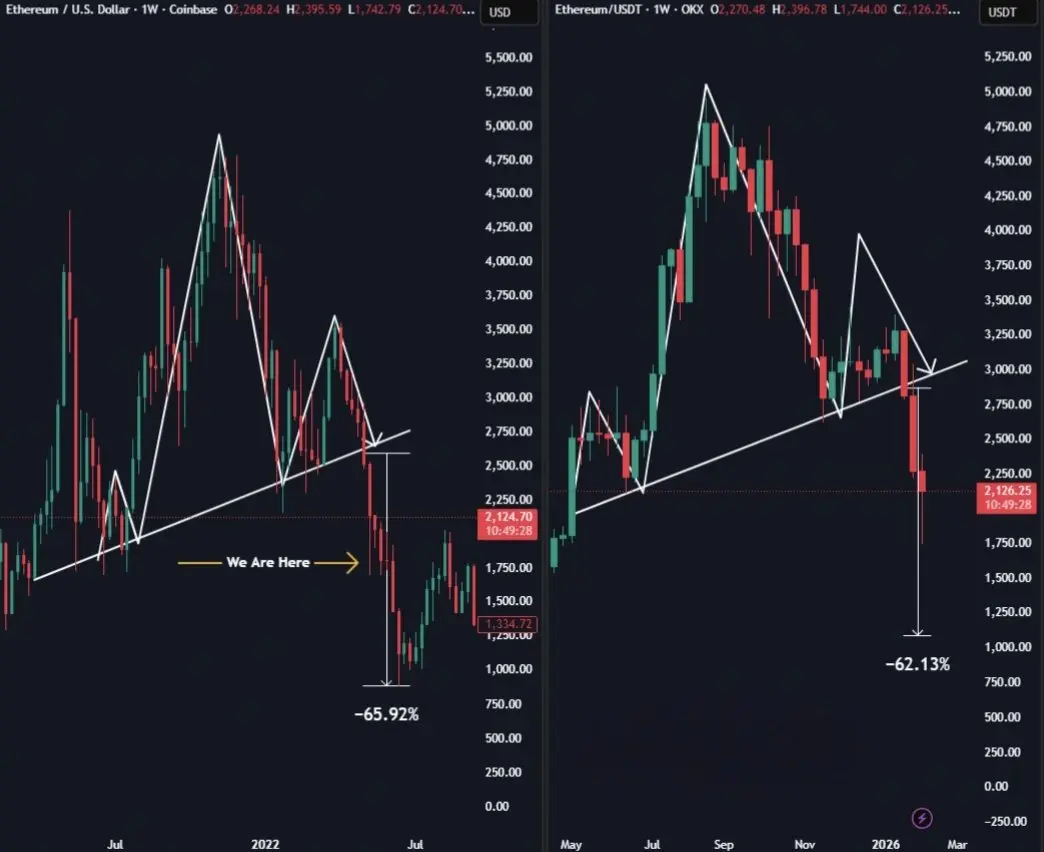
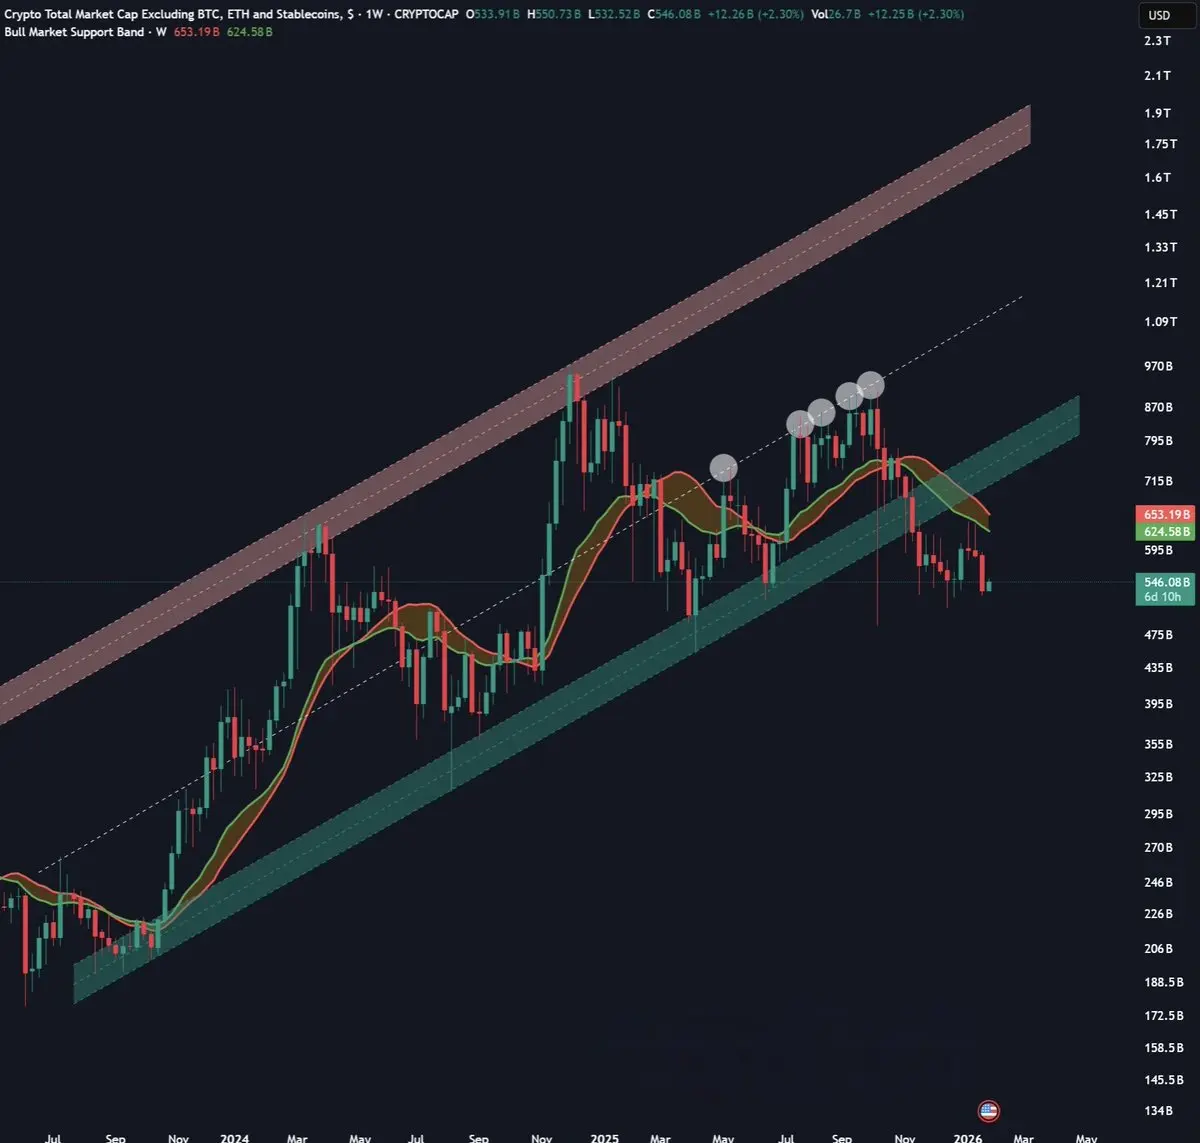
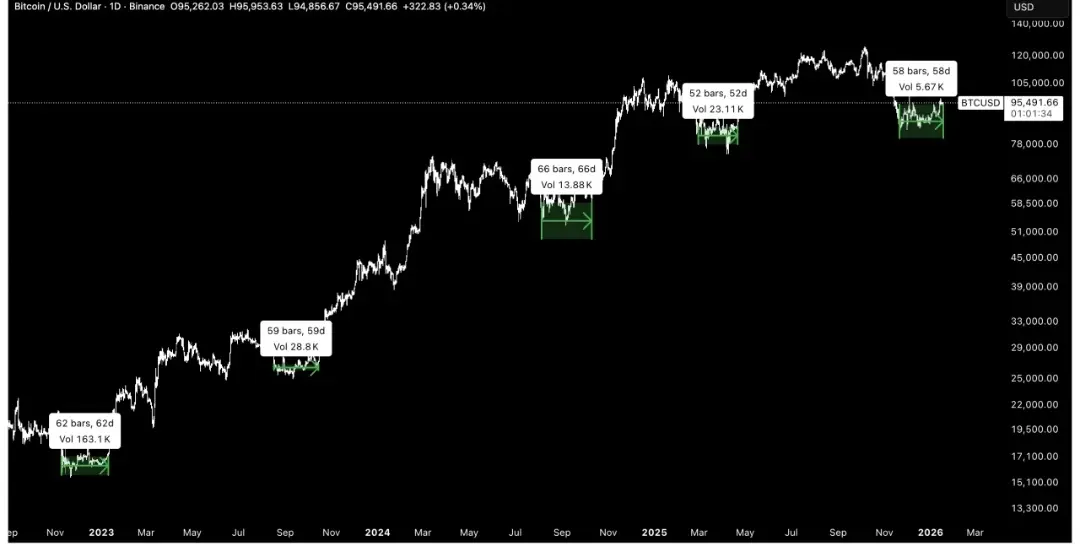
Altcoins are under heavy pressure right now.▫️ A multi-year support level has broken▫️ Price failed to hold above the bull-market support zoneFor a real turnaround, total altcoin market cap must regain the weekly bull-market support range.
- Reward
- 3
- Comment
- Repost
- Share
Gate CrossEx Account Now Live
Experience unified multi-exchange trading with spot, cross margin, and USDT perpetuals.
Up to 20× leverage, advanced risk control, and API-only trading for professionals.
VIP+3 Fee Benefit: Jan 19 – Feb 19, 2026
Open Now:
Experience unified multi-exchange trading with spot, cross margin, and USDT perpetuals.
Up to 20× leverage, advanced risk control, and API-only trading for professionals.
VIP+3 Fee Benefit: Jan 19 – Feb 19, 2026
Open Now:
- Reward
- 3
- Comment
- Repost
- Share