Trade
Basic
Futures
Futures
Hundreds of contracts settled in USDT or BTC
Options
HOT
Trade European-style vanilla options
Unified Account
Maximize your capital efficiency
Demo Trading
Futures Kickoff
Get prepared for your futures trading
Futures Events
Futures Mall
Participate in events to win generous rewards
Demo Trading
Use virtual funds to experience risk-free trading
Earn
Launch
CandyDrop
Collect candies to earn airdrops
Launchpool
Quick staking, earn potential new tokens
HODLer Airdrop
Hold GT and get massive airdrops for free
Launchpad
Be early to the next big token project
Alpha Points
NEW
Trade on-chain assets and enjoy airdrop rewards!
Futures Points
NEW
Earn futures points and claim airdrop rewards
Investment
Simple Earn
Earn interests with idle tokens
Auto-Invest
Auto-invest on a regular basis
Dual Investment
Buy low and sell high to take profits from price fluctuations
Soft Staking
Earn rewards with flexible staking
Crypto Loan
0 Fees
Pledge one crypto to borrow another
Lending Center
One-stop lending hub
VIP Wealth Hub
Customized wealth management empowers your assets growth
Private Wealth Management
Customized asset management to grow your digital assets
Quant Fund
Top asset management team helps you profit without hassle
Staking
Stake cryptos to earn in PoS products
Smart Leverage
NEW
No forced liquidation before maturity, worry-free leveraged gains
GUSD Minting
Use USDT/USDC to mint GUSD for treasury-level yields
More
# GoldAndSilverHitRecordHighs,
69
GateUser-da807dab
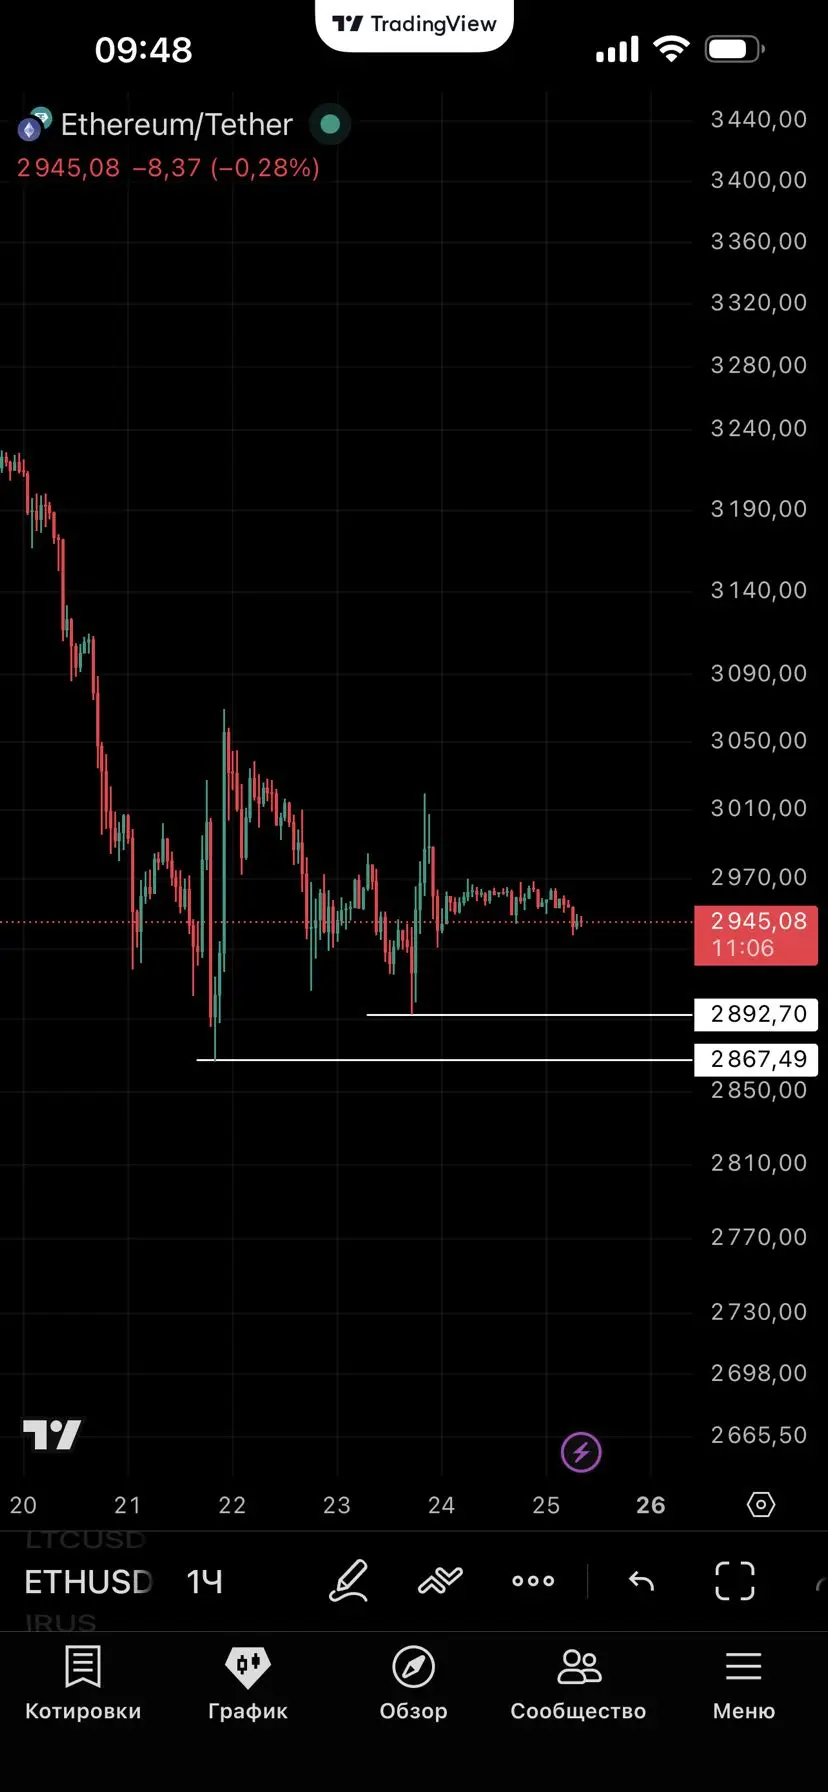
Ethereum Chart Analysis
On the 1-hour timeframe (1H), a clear bearish trend is visible. After a sharp decline from levels above 3400, the price of Ethereum entered a prolonged correction and consolidation phase. Currently, the asset is trading around $2945, trying to find solid ground beneath its feet.
Key support levels:
• $2892: An intermediate level where buyers previously showed activity.
• $2867: A local minimum. If the price breaks below this mark, the decline could accelerate to the $2700–$2800 zone.
Overall Context
Although the #GoldAndSilverHitRecordHighs, cryptomarket has not yet sho
ETH-0,88%

- Reward
- 1
- Comment
- Repost
- Share
Ethereum Chart Analysis
On the 1-hour timeframe (1H), a clear bearish trend is visible. After a sharp decline from levels above 3400, the price of Ethereum entered a prolonged correction and consolidation phase. Currently, the asset is trading around $2945, trying to find solid ground beneath its feet.
Key support levels:
• $2892: An intermediate level where buyers previously showed activity.
• $2867: A local minimum. If the price breaks below this mark, the decline could accelerate to the $2700–$2800 zone.
Overall Context
Although the #GoldAndSilverHitRecordHighs, cryptomarket has not yet sho
On the 1-hour timeframe (1H), a clear bearish trend is visible. After a sharp decline from levels above 3400, the price of Ethereum entered a prolonged correction and consolidation phase. Currently, the asset is trading around $2945, trying to find solid ground beneath its feet.
Key support levels:
• $2892: An intermediate level where buyers previously showed activity.
• $2867: A local minimum. If the price breaks below this mark, the decline could accelerate to the $2700–$2800 zone.
Overall Context
Although the #GoldAndSilverHitRecordHighs, cryptomarket has not yet sho
ETH-0,88%
- Reward
- like
- Comment
- Repost
- Share
Load More
Join 40M users in our growing community
⚡️ Join 40M users in the crypto craze discussion
💬 Engage with your favorite top creators
👍 See what interests you
Trending Topics
64.83K Popularity
39.32K Popularity
32.46K Popularity
14.58K Popularity
26.32K Popularity
18.42K Popularity
15.88K Popularity
84.97K Popularity
44.68K Popularity
25.73K Popularity
15.79K Popularity
4.59K Popularity
261.51K Popularity
25.41K Popularity
166.43K Popularity
News
View MoreHong Kong police investigate a virtual currency scam involving HKD 21.4 million, no arrests made yet.
6 m
Opinion: It is unrealistic for Chinese victims of the Qian Zhimin case to expect BTC prices to soar and receive "satisfactory" high compensation
9 m
Data: Internal Bitcoin exchange traffic drops to approximately 14,000 coins, the lowest level since 2022
59 m
Qian Zhimin's Bitcoin recovery case holds a procedural hearing in the UK, with the judge focusing on the issue of "proxy proliferation" involving Chinese victims.
1 h
Scroll co-founder’s X account has been compromised. Do not interact with any links or private messages.
1 h
Pin