


#GateSquareAprilPostingChallenge
1 — The Big Picture: Why These Three Assets Are Now One System
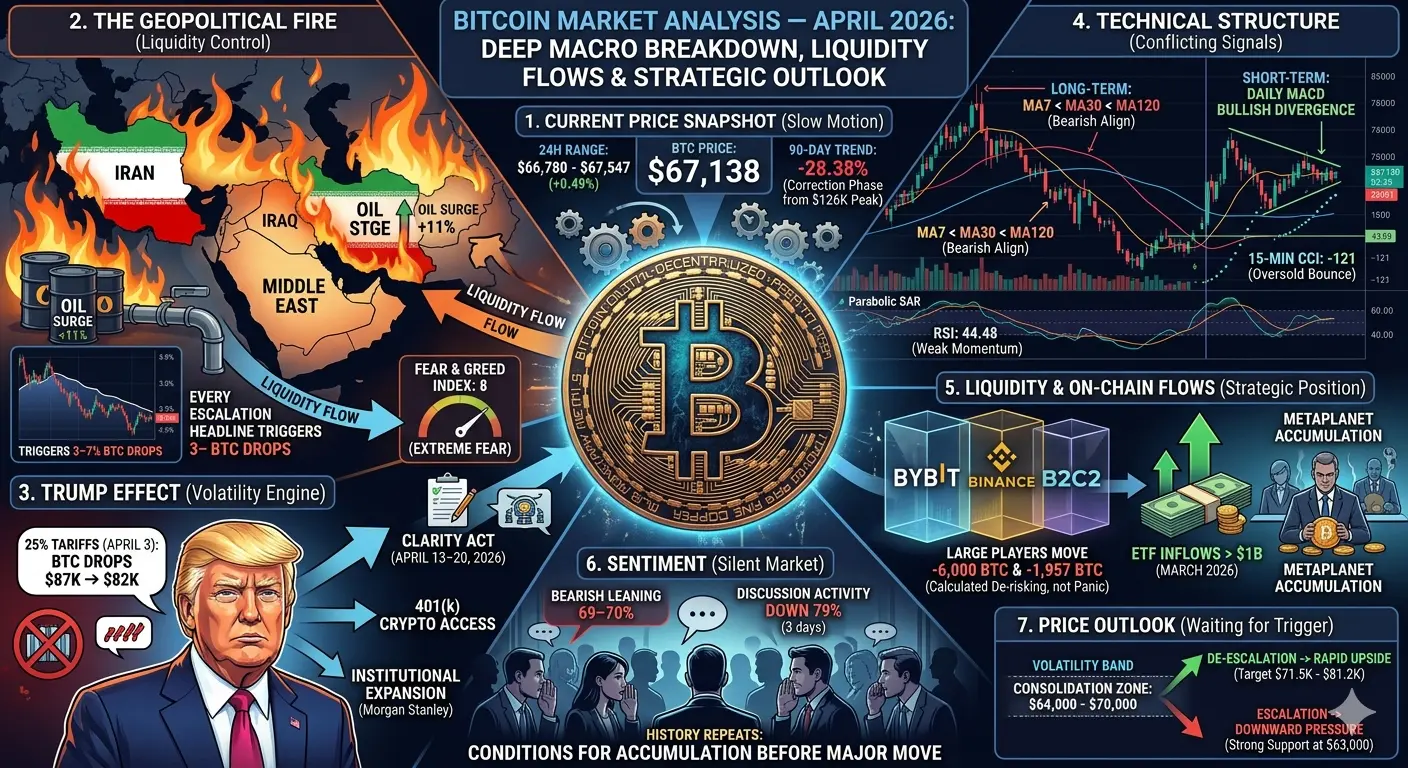
April 2026 is not a typical market environment. What we are witnessing is a macro convergence, where Bitcoin, Crude Oil, and Gold are no longer trading independently — they are reacting to the same global force:
Geopolitical instability.
The ongoing tensions involving United States–Iran conflict dynamics, disruptions in the Strait of Hormuz, and attacks in the Red Sea have created a chain reaction across all markets.
The Core Relationship:
Oil drives inflation
Gold reflects fear
Bitcoin reacts to liquidity
Understanding today’s market means understanding how these three interact as a system, not as separate trades.
2 — Crude Oil (XTI): The Primary Driver of Everything
Right now, oil is the starting point of the entire macro chain.
With XTI trading around the $105 range, markets are pricing in serious supply disruption risk, mainly due to instability near the Strait of Hormuz — a route responsible for nearly 20% of global oil flows.
Step-by-Step Impact:
1. Supply Shock Risk
Any escalation involving Iran threatens global oil supply. Even the fear of disruption pushes prices higher.
2. Inflation Transmission
Higher oil prices increase:
Transport costs
Manufacturing costs
Energy bills globally
This directly pushes inflation higher, especially in economies like the United States.
3. Central Bank Constraint
When inflation rises, the Federal Reserve cannot ease policy easily.
Result: Interest rates stay high → liquidity tightens
4. Liquidity Shock to Risk Assets
When liquidity contracts:
Crypto markets weaken
Equities struggle
Investors move to safer assets
Scenario Mapping:
$105 Oil → Uncertainty, sideways crypto
$110–$120 Oil → Strong risk-off pressure
$120+ Oil → Panic environment, aggressive capital rotation into gold
👉 Key Insight:
Oil is not just another asset — it is the trigger variable controlling global liquidity in April 2026.
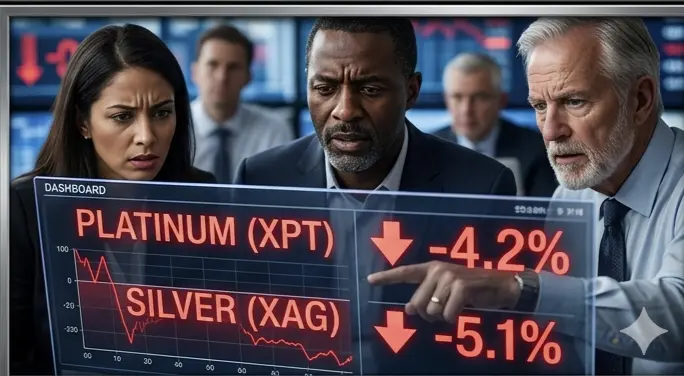
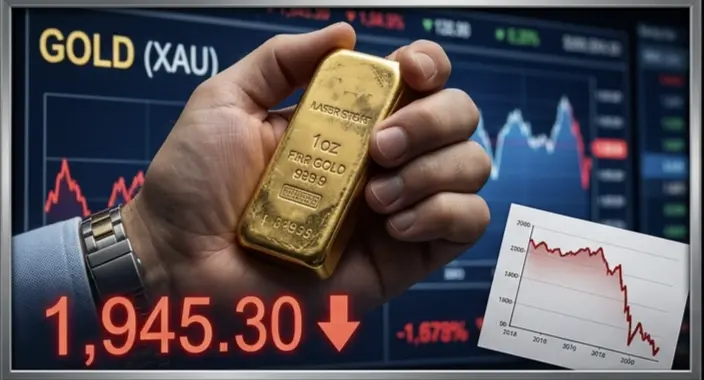
3 — Gold (XAUT): The Market’s Fear Gauge
Gold is currently behaving exactly as expected in a geopolitical crisis — strong, bid, and heavily accumulated.
With XAUT near $4,637 and bullish sentiment above 80%, the market is clearly positioning for continued instability.
Why Gold Is Rising:
1. Safe Haven Demand
During conflict, institutions reduce exposure to volatile assets and rotate into gold. This is a decades-proven behavior.
2. Currency Dynamics
If inflation rises but central banks hesitate to tighten further, the US dollar weakens — which boosts gold prices (since gold is USD-denominated).
3. Strategic Positioning
Large funds are not just hedging — they are positioning for prolonged uncertainty.
4. Structural Shift in Crypto Platforms
Platforms like Gate.io introducing XAUT and oil derivatives shows something deeper:
👉 Macro assets are becoming part of crypto-native trading ecosystems
Technical Insight:
Gold is currently in a short-term bullish structure within a broader consolidation phase:
Higher timeframe shows exhaustion after strong Q1 rally
Lower timeframes show continued buying pressure
Forward Outlook:
If tensions escalate → $5,000 becomes realistic
If tensions ease → expect sharp profit-taking
👉 Key Insight:
Gold is already pricing in risk that crypto has not fully reacted to yet.
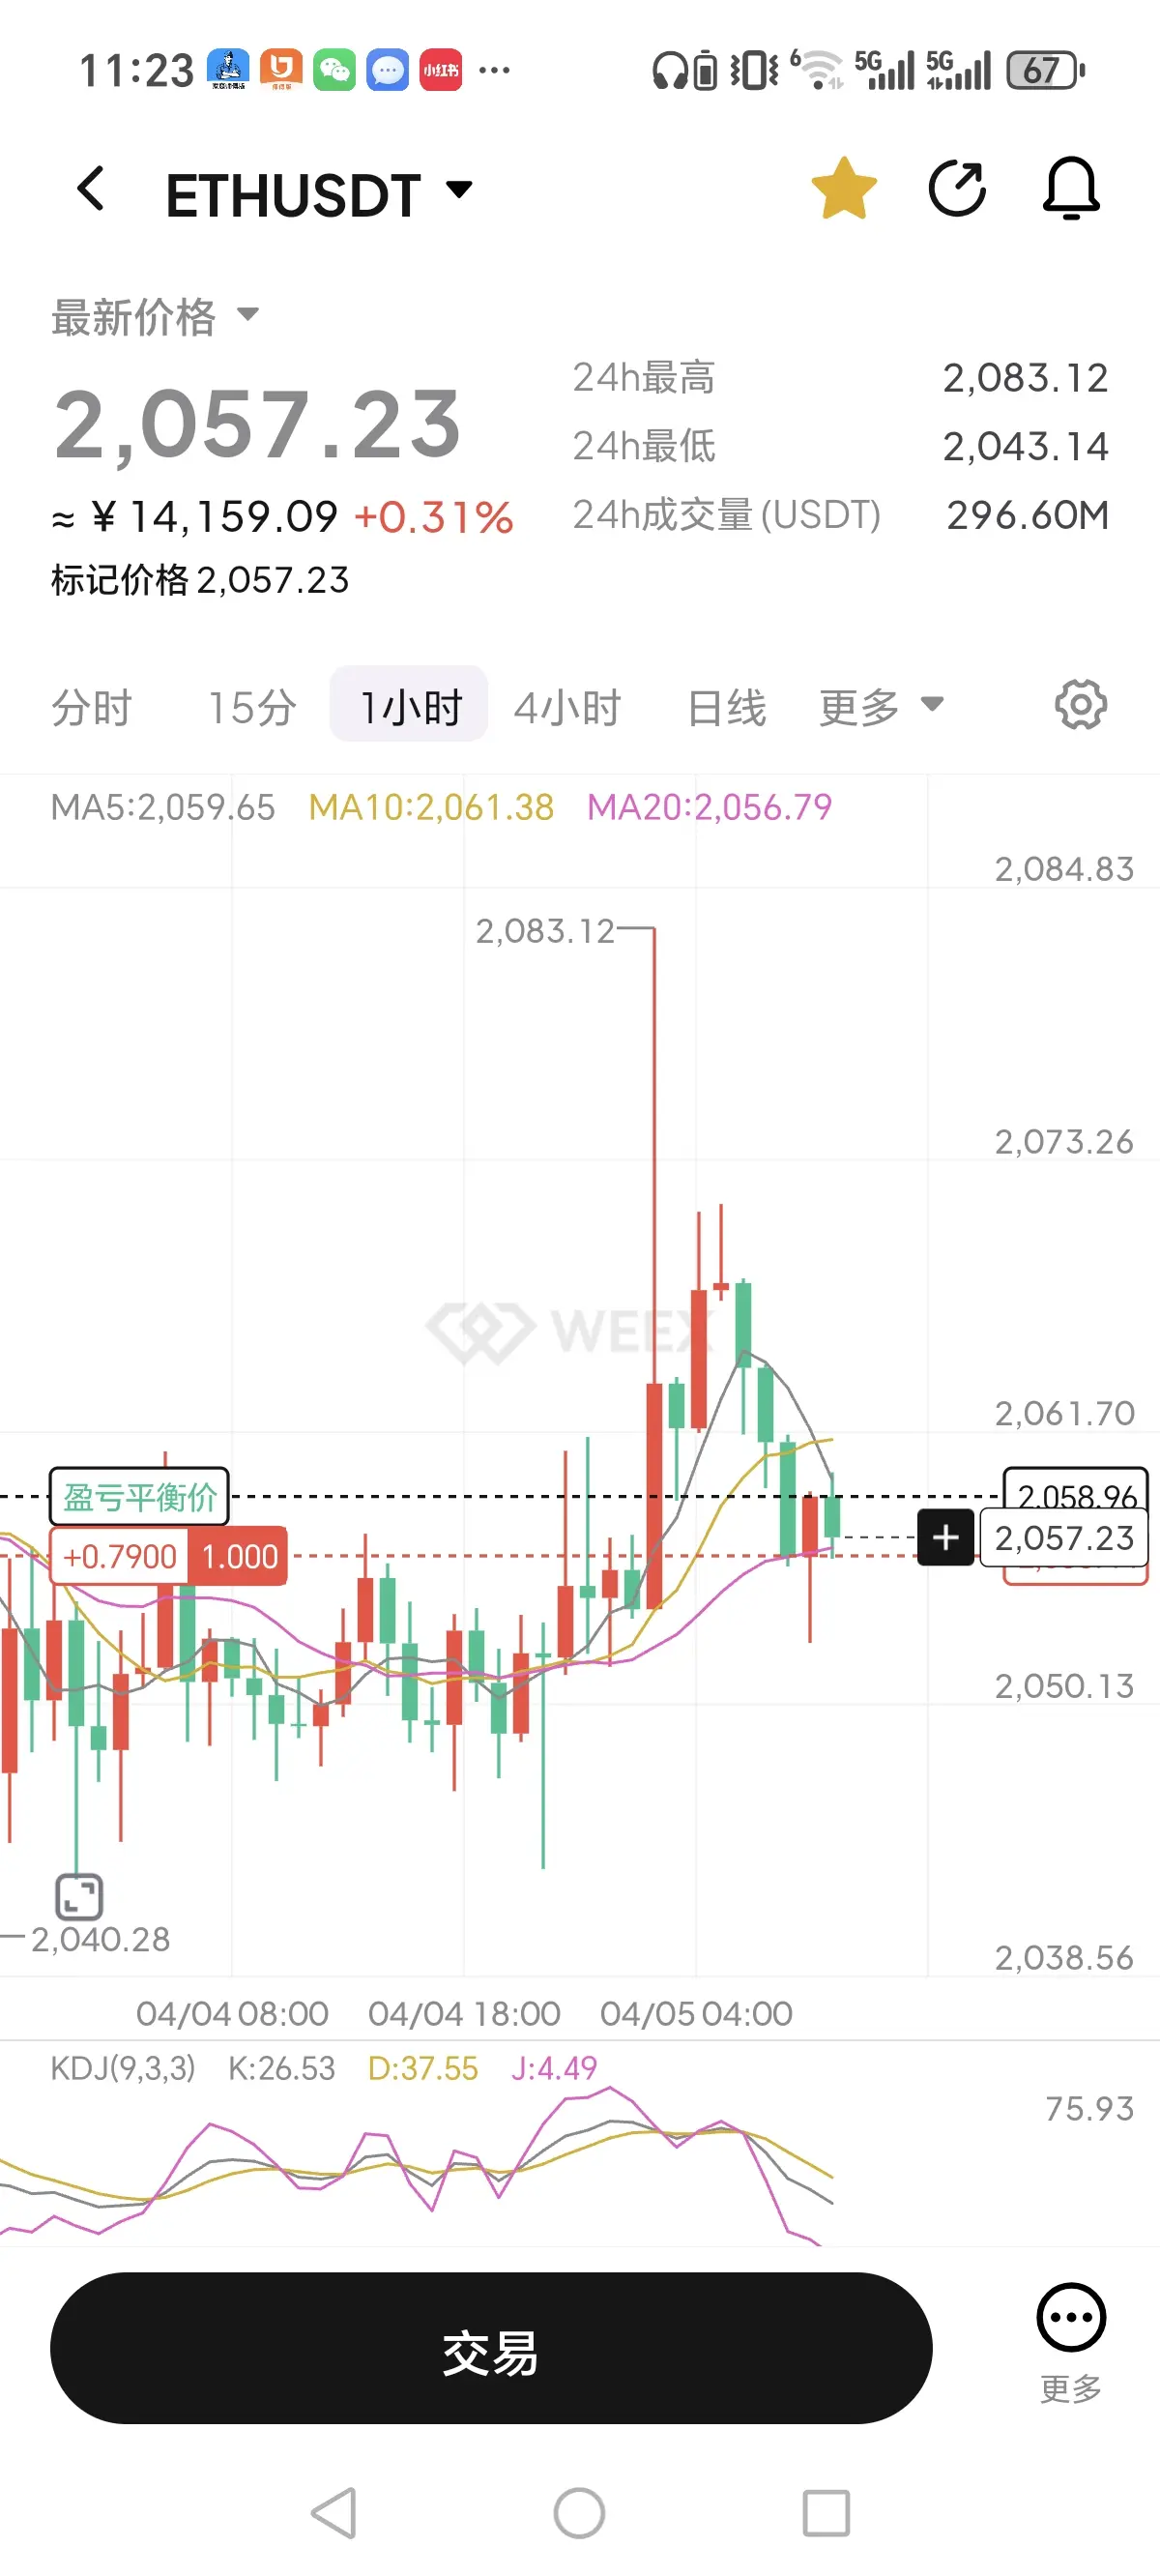
4 — Bitcoin (BTC): Stuck Between Two Identities
Bitcoin is currently in a conflicted state.
It is trying to evolve into “digital gold” — but in reality, it still behaves like a high-risk tech asset.
What’s Happening:
1. Strong Correlation With Tech Markets
BTC maintains high correlation with equity indices like the Nasdaq-100, especially during macro shocks.
👉 When oil rises → inflation fears rise → tech sells off → BTC follows.
2. Liquidity Sensitivity
Bitcoin is extremely sensitive to global liquidity:
Tight liquidity → BTC drops
Easy liquidity → BTC rallies
3. De-Risking Behavior
In crisis moments:
Investors sell liquid assets first
BTC becomes a source of quick liquidity
4. Institutional Transition Phase
Despite short-term weakness, long-term fundamentals are improving:
Charles Schwab planning crypto trading
Corporate accumulation continues
Infrastructure is expanding
Technical Position:
Bearish structure on higher timeframe
Early reversal signals forming (divergence, SAR flips)
Key levels:
Support: $66,700
Resistance: $67,500–$68,000
👉 Key Insight:
BTC is not failing — it is reacting exactly as a liquidity-driven asset should in a macro tightening environment.
5 — The Transmission Mechanism (The Real Market Engine)
Everything connects through a simple but powerful chain:
Geopolitical Conflict
↓
Oil Prices Rise (XTI)
↓
Inflation Increases
↓
Federal Reserve Stays Tight
↓
Liquidity Contracts
↓
Bitcoin Weakens (Short-Term)
Meanwhile:
Same Conflict
↓
Safe Haven Demand
↓
Gold (XAUT) Rises
6 — What Traders Must Watch (Critical Signals)
Focus on these real-time triggers:
Developments near the Strait of Hormuz
Federal Reserve policy tone
Oil breaking above key levels ($110, $120)
Gold momentum continuation or reversal
Correlation breakdown between BTC and equities
7 — Final Conclusion: The Real Insight for April 2026
This market is no longer about isolated charts — it is about macro reactions.
Oil controls inflation and liquidity
Gold reflects fear and capital preservation
Bitcoin reacts to liquidity cycles while building long-term strength
👉 The most important shift:
Crypto is now fully integrated into the global macro system.
Every headline involving Iran, every move by the Federal Reserve, and every spike in oil is directly influencing BTC price action.
Final Trading Insight
This is not a trend market — it is a reaction market.
Watch oil as your leading indicator
Use gold as your risk sentiment gauge
Treat BTC as a liquidity-sensitive instrument
1 — The Big Picture: Why These Three Assets Are Now One System
April 2026 is not a typical market environment. What we are witnessing is a macro convergence, where Bitcoin, Crude Oil, and Gold are no longer trading independently — they are reacting to the same global force:
Geopolitical instability.
The ongoing tensions involving United States–Iran conflict dynamics, disruptions in the Strait of Hormuz, and attacks in the Red Sea have created a chain reaction across all markets.
The Core Relationship:
Oil drives inflation
Gold reflects fear
Bitcoin reacts to liquidity
Understanding today’s market means understanding how these three interact as a system, not as separate trades.
2 — Crude Oil (XTI): The Primary Driver of Everything
Right now, oil is the starting point of the entire macro chain.
With XTI trading around the $105 range, markets are pricing in serious supply disruption risk, mainly due to instability near the Strait of Hormuz — a route responsible for nearly 20% of global oil flows.
Step-by-Step Impact:
1. Supply Shock Risk
Any escalation involving Iran threatens global oil supply. Even the fear of disruption pushes prices higher.
2. Inflation Transmission
Higher oil prices increase:
Transport costs
Manufacturing costs
Energy bills globally
This directly pushes inflation higher, especially in economies like the United States.
3. Central Bank Constraint
When inflation rises, the Federal Reserve cannot ease policy easily.
Result: Interest rates stay high → liquidity tightens
4. Liquidity Shock to Risk Assets
When liquidity contracts:
Crypto markets weaken
Equities struggle
Investors move to safer assets
Scenario Mapping:
$105 Oil → Uncertainty, sideways crypto
$110–$120 Oil → Strong risk-off pressure
$120+ Oil → Panic environment, aggressive capital rotation into gold
👉 Key Insight:
Oil is not just another asset — it is the trigger variable controlling global liquidity in April 2026.
3 — Gold (XAUT): The Market’s Fear Gauge
Gold is currently behaving exactly as expected in a geopolitical crisis — strong, bid, and heavily accumulated.
With XAUT near $4,637 and bullish sentiment above 80%, the market is clearly positioning for continued instability.
Why Gold Is Rising:
1. Safe Haven Demand
During conflict, institutions reduce exposure to volatile assets and rotate into gold. This is a decades-proven behavior.
2. Currency Dynamics
If inflation rises but central banks hesitate to tighten further, the US dollar weakens — which boosts gold prices (since gold is USD-denominated).
3. Strategic Positioning
Large funds are not just hedging — they are positioning for prolonged uncertainty.
4. Structural Shift in Crypto Platforms
Platforms like Gate.io introducing XAUT and oil derivatives shows something deeper:
👉 Macro assets are becoming part of crypto-native trading ecosystems
Technical Insight:
Gold is currently in a short-term bullish structure within a broader consolidation phase:
Higher timeframe shows exhaustion after strong Q1 rally
Lower timeframes show continued buying pressure
Forward Outlook:
If tensions escalate → $5,000 becomes realistic
If tensions ease → expect sharp profit-taking
👉 Key Insight:
Gold is already pricing in risk that crypto has not fully reacted to yet.
4 — Bitcoin (BTC): Stuck Between Two Identities
Bitcoin is currently in a conflicted state.
It is trying to evolve into “digital gold” — but in reality, it still behaves like a high-risk tech asset.
What’s Happening:
1. Strong Correlation With Tech Markets
BTC maintains high correlation with equity indices like the Nasdaq-100, especially during macro shocks.
👉 When oil rises → inflation fears rise → tech sells off → BTC follows.
2. Liquidity Sensitivity
Bitcoin is extremely sensitive to global liquidity:
Tight liquidity → BTC drops
Easy liquidity → BTC rallies
3. De-Risking Behavior
In crisis moments:
Investors sell liquid assets first
BTC becomes a source of quick liquidity
4. Institutional Transition Phase
Despite short-term weakness, long-term fundamentals are improving:
Charles Schwab planning crypto trading
Corporate accumulation continues
Infrastructure is expanding
Technical Position:
Bearish structure on higher timeframe
Early reversal signals forming (divergence, SAR flips)
Key levels:
Support: $66,700
Resistance: $67,500–$68,000
👉 Key Insight:
BTC is not failing — it is reacting exactly as a liquidity-driven asset should in a macro tightening environment.
5 — The Transmission Mechanism (The Real Market Engine)
Everything connects through a simple but powerful chain:
Geopolitical Conflict
↓
Oil Prices Rise (XTI)
↓
Inflation Increases
↓
Federal Reserve Stays Tight
↓
Liquidity Contracts
↓
Bitcoin Weakens (Short-Term)
Meanwhile:
Same Conflict
↓
Safe Haven Demand
↓
Gold (XAUT) Rises
6 — What Traders Must Watch (Critical Signals)
Focus on these real-time triggers:
Developments near the Strait of Hormuz
Federal Reserve policy tone
Oil breaking above key levels ($110, $120)
Gold momentum continuation or reversal
Correlation breakdown between BTC and equities
7 — Final Conclusion: The Real Insight for April 2026
This market is no longer about isolated charts — it is about macro reactions.
Oil controls inflation and liquidity
Gold reflects fear and capital preservation
Bitcoin reacts to liquidity cycles while building long-term strength
👉 The most important shift:
Crypto is now fully integrated into the global macro system.
Every headline involving Iran, every move by the Federal Reserve, and every spike in oil is directly influencing BTC price action.
Final Trading Insight
This is not a trend market — it is a reaction market.
Watch oil as your leading indicator
Use gold as your risk sentiment gauge
Treat BTC as a liquidity-sensitive instrument