In brief
- Bitcoin has fallen 52.44% from its October all-time high, dangerously approaching the 2018 bear market drawdown of 56.26%.
- The crypto market lost 1.33% in the last 24 hours, with a total market cap at $2.33 trillion
- On Myriad, prediction market traders say there’s a 60% chance BTC touches $55K before $84K.
The crypto market is bleeding. And the wounds keep deepening.
Bitcoin trades at $67,621 today, down 1.70% in the last 24 hours. But this isn’t just another bad day—it could potentially help mark one of the most prolonged bear runs in Bitcoin history.
If February closes red, Bitcoin will complete five consecutive months of losses, the longest streak since June 2018 when Bitcoin was down for six months. With February already down 13.98%, the signs aren’t promising.
The accumulated losses from October 2025’s all-time high now reach 52.4% over 123 days. For perspective, the previous longest losing streak—that 2018 nightmare—registered a 56.26% drop over 153 days. Bitcoin is just 3.82 percentage points away from matching that record in less time.
The total cryptocurrency market capitalization stands at $2.33 trillion, down 1.33% in the last 24 hours. The Fear & Greed Index rose marginally from 8 to 12 points, but still in “extreme fear.”
The macro backdrop looks equally fragile. The S&P 500 and Nasdaq have slipped amid tech-sector jitters after Microsoft shed roughly 10% despite strong earnings, spooking investors. Meanwhile, precious metals have turned volatile: on Jan. 30, silver futures plunged about 31%—their steepest one-day drop since 1980—while gold also pulled back from recent highs.
Forced liquidations—when derivatives traders’ positions are automatically closed at certain prices—continue battering the market. Since January 12, there has not been a single day in which bear liquidations beat bullish positions, according to Coinglass data.
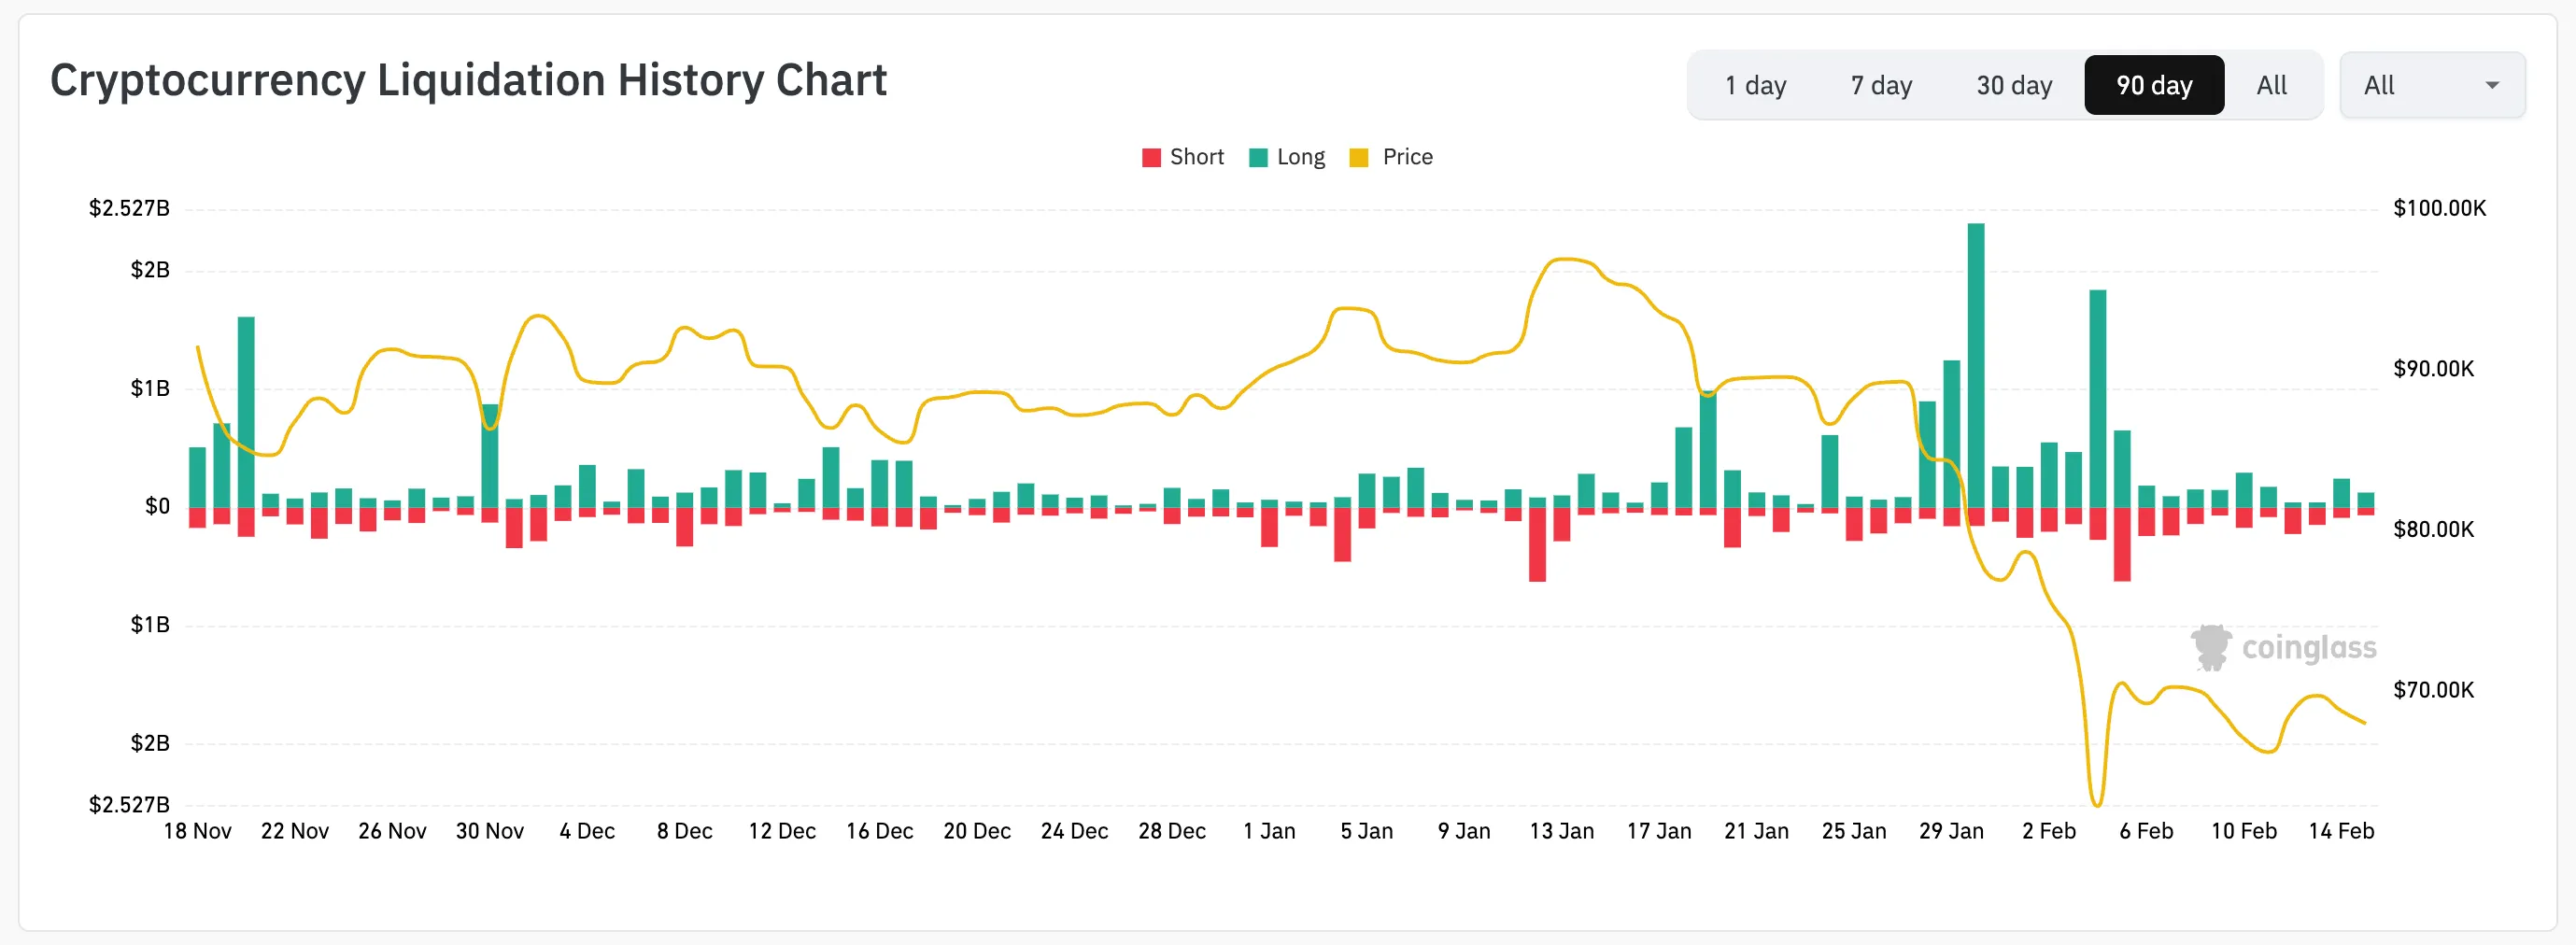
Source: Coinglass
Speaking of bearish sentiment. On Myriad, a prediction market developed by Decrypt’s parent company Dastan, odds shifted again from bullish to bearish on bets wagering on Bitcoin’s near-term future. Currently, prediction market traders are favoring a scenario where BTC touches $55K before $84K with 60% odds. That sentiment shift in prediction markets—where participants put money behind their opinions—is hard to ignore.
Bitcoin (BTC) price analysis: The signals don’t lie
Bitcoin’s charts paint an equally grim picture on the daily timeframe. Bitcoin is currently trading sideways after the big spike on February 6. However, the price has not been able to resume an upwards trend and remains below the average price of the last 200 days, which traders identify as the EMA200. This shows how weak bulls currently are.
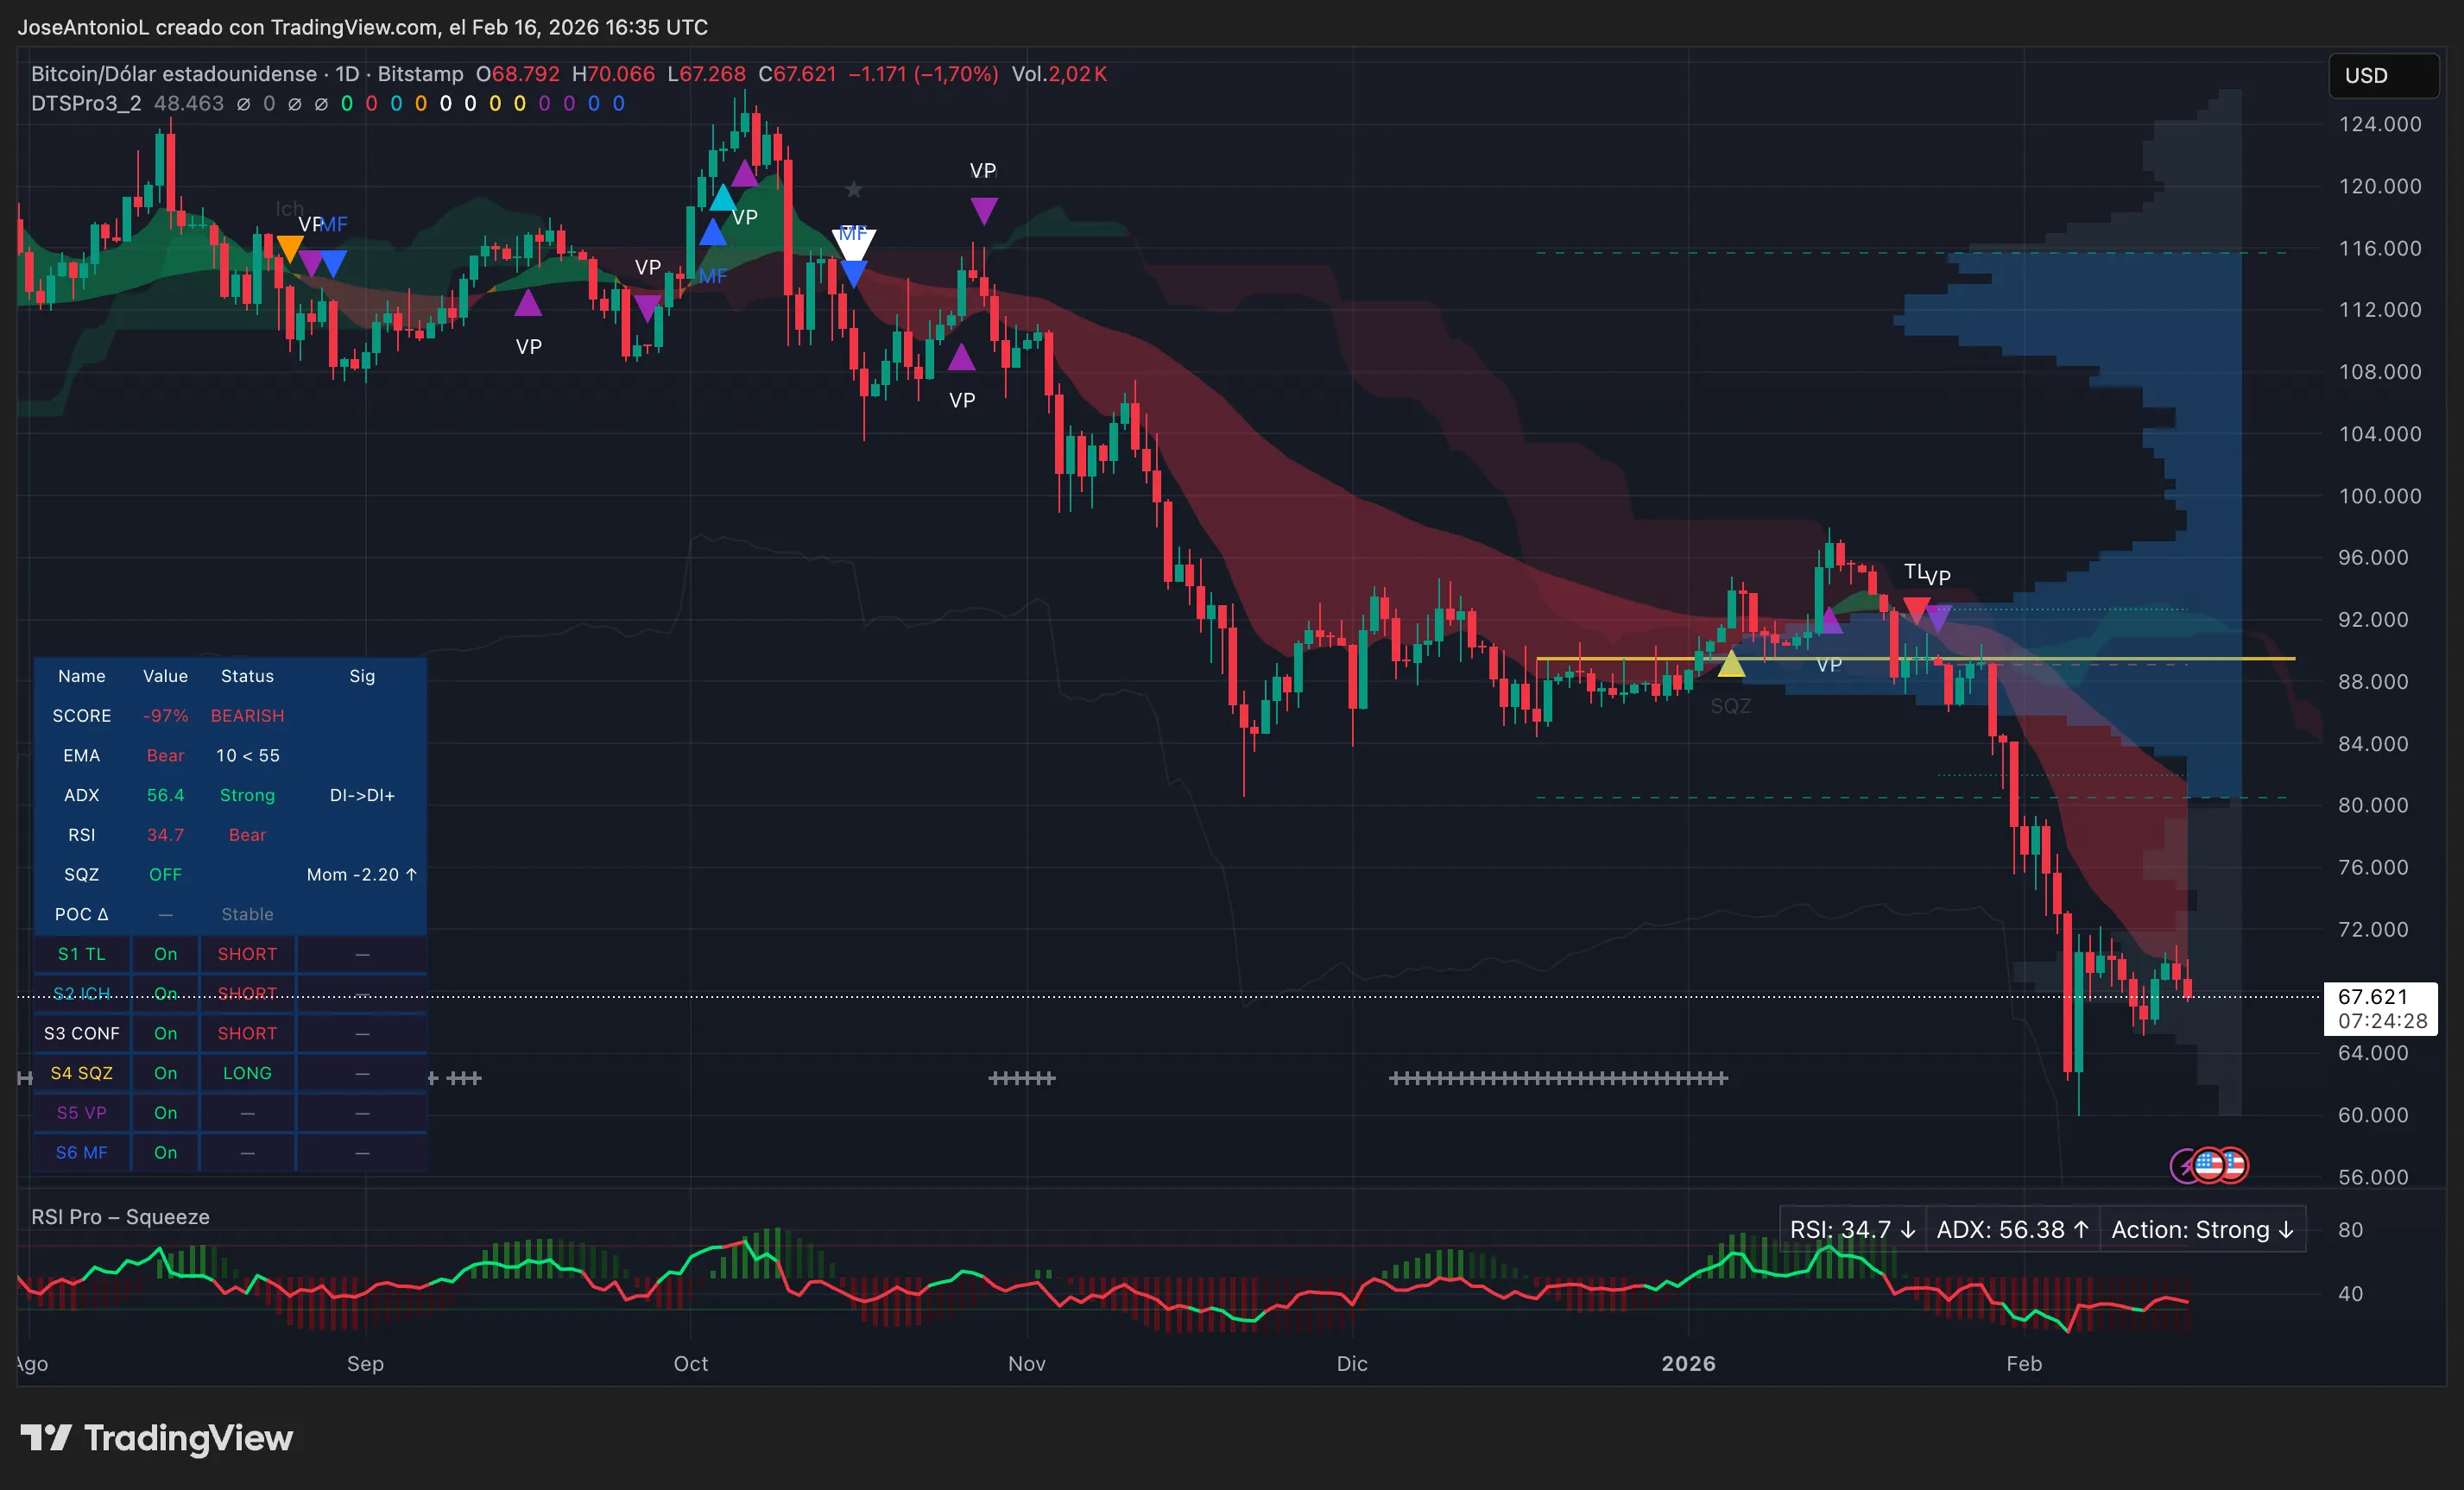
Bitcoin (BTC) price data. Image: Tradingview
This setup (current price trading below the EMA200 and this being lower than the average price of the last 50 days, or EMA50) typically signals solid bearish momentum. When both EMAs, otherwise known as exponential moving averages, sit above the current price, they act as dynamic resistance—levels where sellers tend to appear.
The Relative Strength Index, or RSI, sits at 34.7. RSI measures buying and selling momentum on a 0-100 scale. An RSI of 34.7 places Bitcoin in bearish territory, though it hasn’t reached extreme oversold levels. This means negative momentum dominates, but there’s still room for further declines before technical conditions suggest a bounce.
The Average Directional Index, or ADX, stands at 56.4—well above the 25 threshold that confirms trend strength. ADX measures trend strength with readings above 25 indicating a strong trend is in place. With ADX at 56.4 and price falling, this confirms the bearish trend has very strong momentum.
Can Bitcoin Recover?
A Bitcoin bounce after such a sharp drop is definitely possible, but even if it does, it would be premature to call it a trend reversal.
For traders to begin talking about a bullish movement, the price of Bitcoin would need to show at least one of two unlikely scenarios: Either a massive recovery past the $100K mark to resume the 2024-2025 trend, or a consistent series of candlesticks with higher lows respecting at least a support similar to the one shown in the dotted green line below (extension of the previous trend).
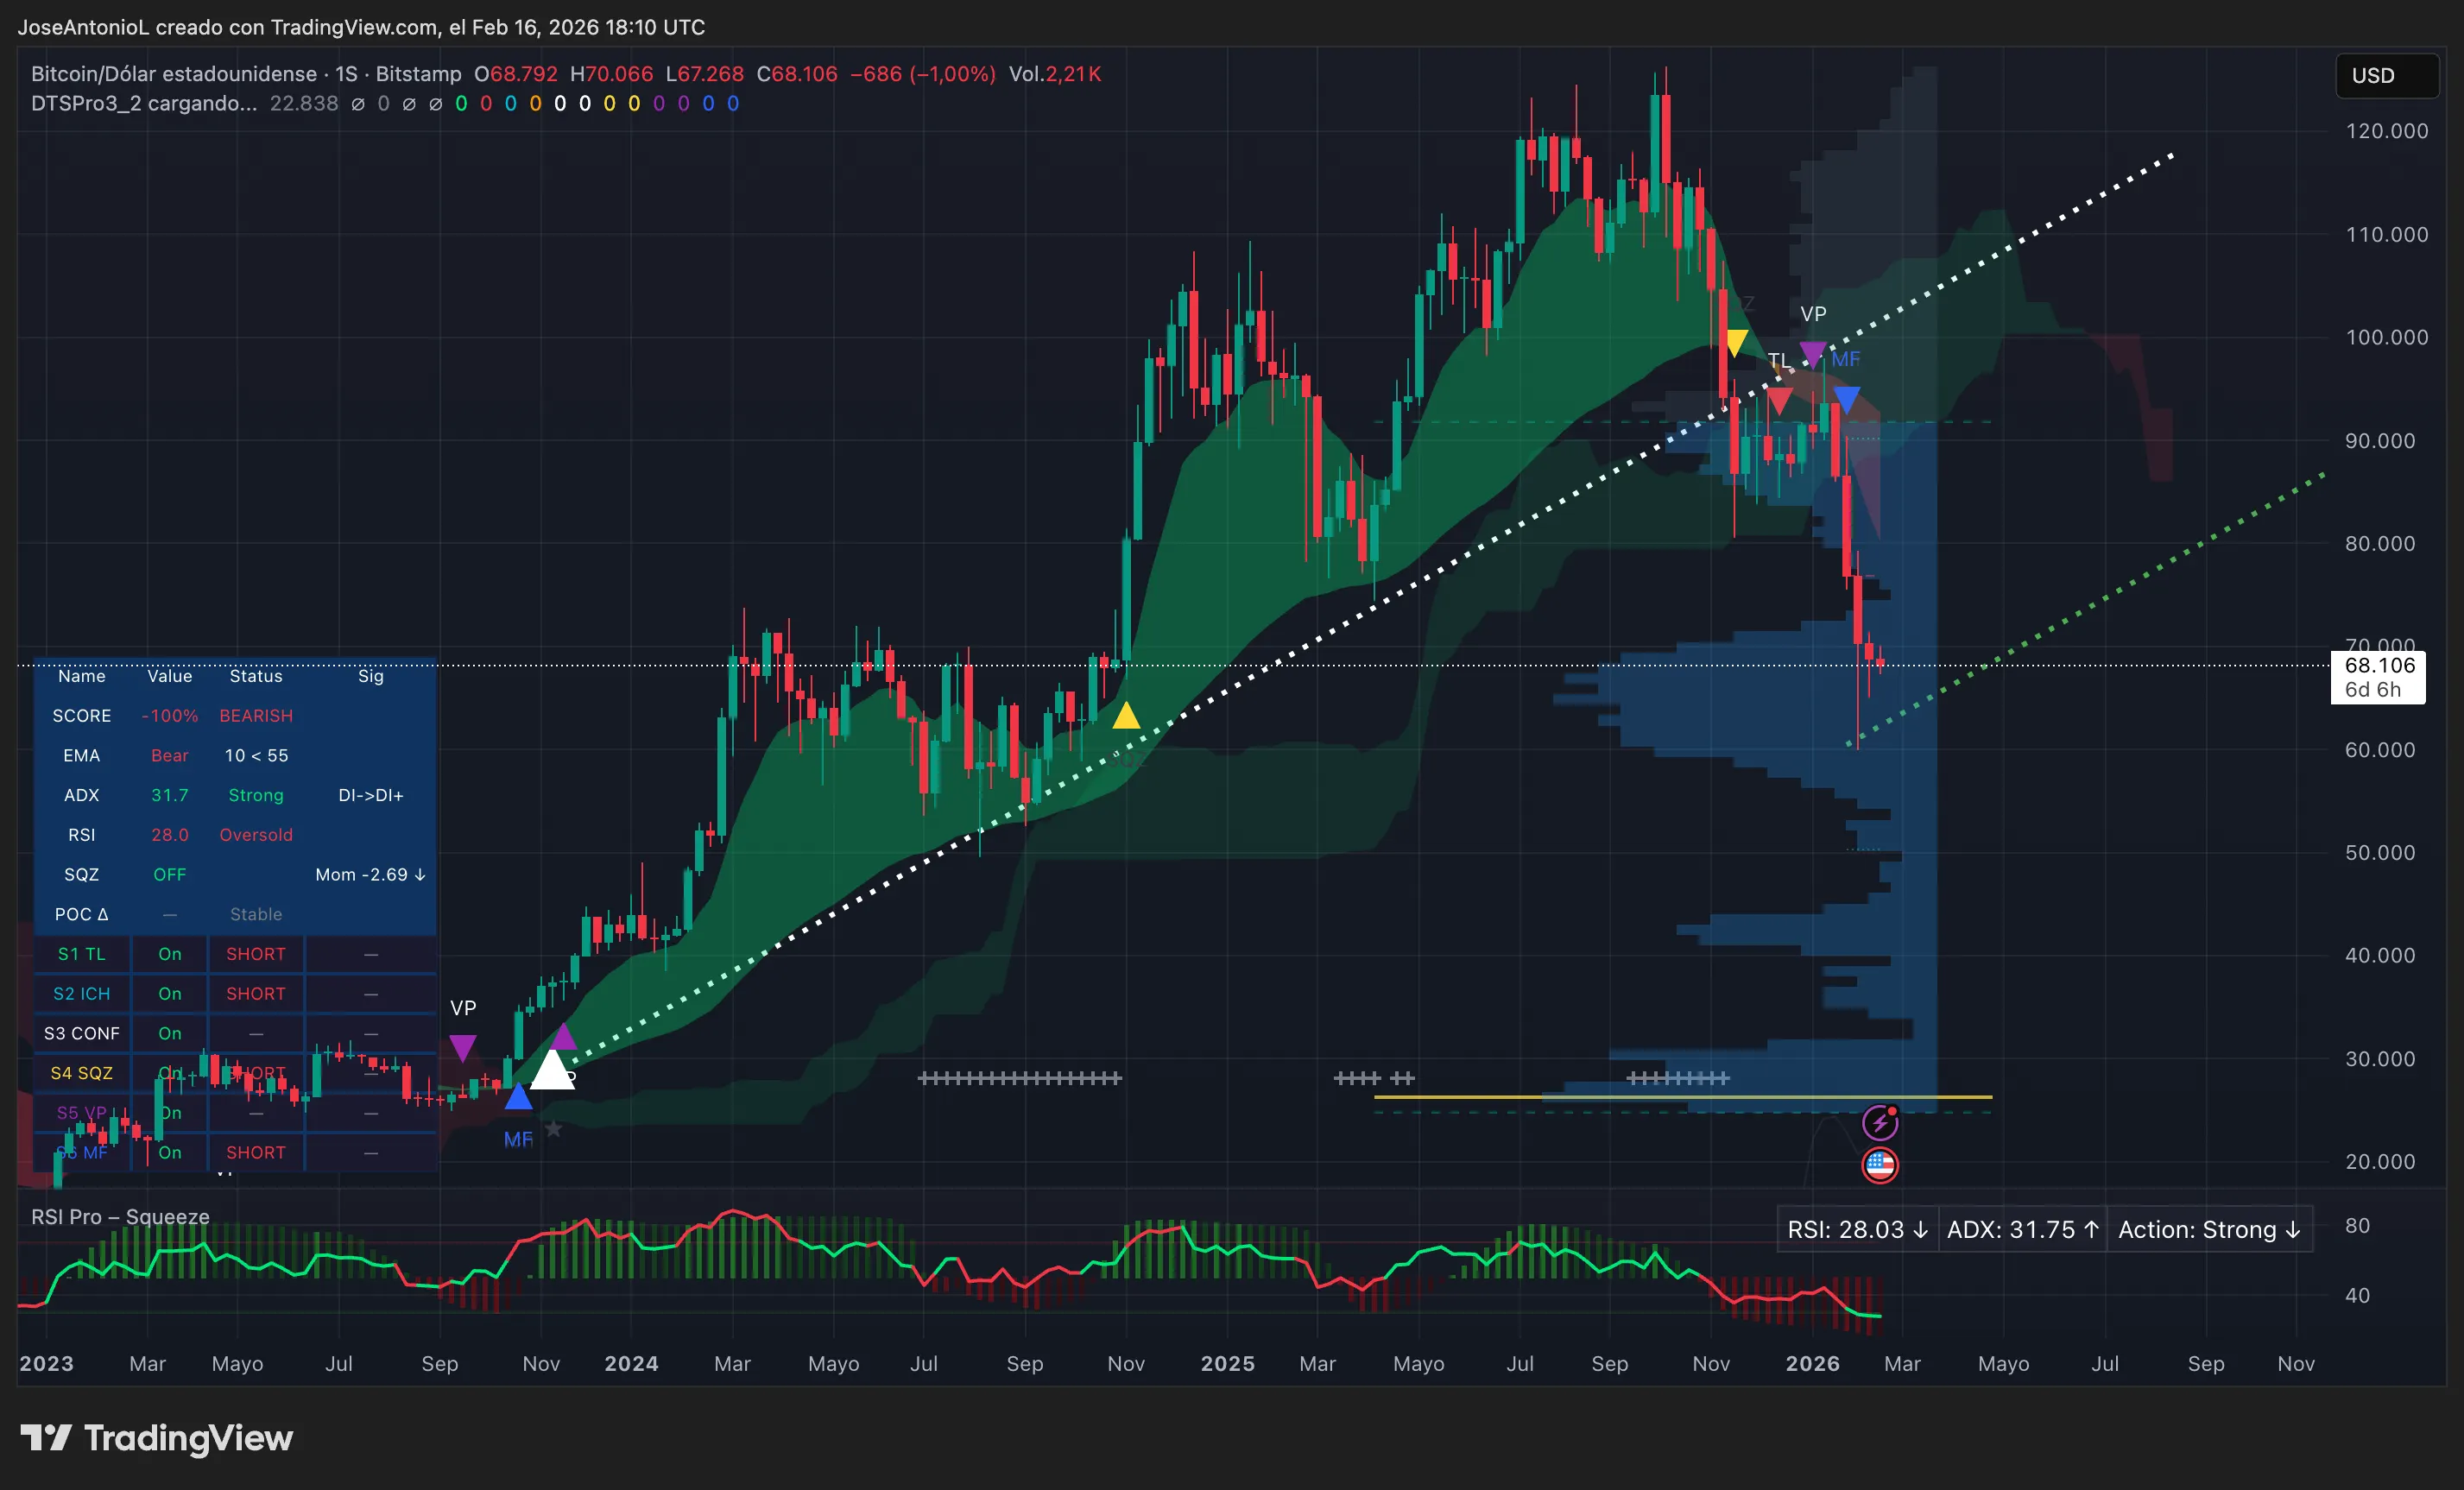
Bitcoin (BTC) price data. Image: Tradingview
For now, Bitcoin remains trapped in one of the most persistent downtrends in its history. And with just two weeks left in February, the clock is ticking to avoid that fifth consecutive red month.
Disclaimer
The views and opinions expressed by the author are for informational purposes only and do not constitute financial, investment, or other advice.
Disclaimer: The information on this page may come from third parties and does not represent the views or opinions of Gate. The content displayed on this page is for reference only and does not constitute any financial, investment, or legal advice. Gate does not guarantee the accuracy or completeness of the information and shall not be liable for any losses arising from the use of this information. Virtual asset investments carry high risks and are subject to significant price volatility. You may lose all of your invested principal. Please fully understand the relevant risks and make prudent decisions based on your own financial situation and risk tolerance. For details, please refer to
Disclaimer.
Related Articles
Bitcoin Liquidation Cascades: $619M in Short Liquidations if BTC Breaks $80K
Gate News message, April 26 — According to Coinglass data, if Bitcoin breaks $80,000, major centralized exchanges will face cumulative short liquidation intensity of $619 million. Conversely, if BTC falls below $76,000, cumulative long liquidation intensity across major CEXs will reach $645 million.
GateNews27m ago
Bitcoin Breaks Through $78,000, Up 0.75% in 24 Hours
Gate News message, April 26 — Bitcoin surged through $78,000, currently trading at $78,102.89 with a 24-hour gain of 0.75%.
GateNews2h ago
Analyst: $80K Emerges as Bitcoin's Key Resistance Level, Breakout Could Trigger Increased Volatility
Gate News message, April 26 — On-chain analyst Murphy identified $80,000 as Bitcoin's primary resistance level above the current price, citing a combination of options Gamma exposure, open interest (OI), and implied volatility (IV) data. The level represents a critical checkpoint for May's price
GateNews2h ago
Olenox Announces Merge With CS Digital to Develop Low Cost, Off-Grid Bitcoin Mining Opportunities
The two companies would agree to merge, with CS Digital receiving $55 million in an all-share transaction, to combine Olenox’s energy expertise with CS Digital’s expertise in bitcoin mining. The combined company would seek to develop off-grid mining and AI data center initiatives close to
Coinpedia3h ago
Bitcoin Spot ETFs Record $144.49M Net Inflows for 9 Consecutive Days, BlackRock IBIT Leads
Gate News message, April 26 — Bitcoin spot ETFs recorded total net inflows of $144.489 million on April 25, extending a streak of nine consecutive days of positive flows, according to SoSoValue data.
BlackRock's IBIT led all funds with single-day net inflows of $22.879 million, bringing its
GateNews3h ago
Bitcoin Community Questions U.S. Military's Understanding of Bitcoin, Admiral Criticized for "Reading Wikipedia"
Gate News message, April 26 — U.S. Navy Admiral Samuel Paparo told the Senate Armed Services Committee on Tuesday that the U.S. government operates a Bitcoin node, prompting members of the Bitcoin community to question the government's understanding of the network. Paparo described Bitcoin as "a com
GateNews5h ago