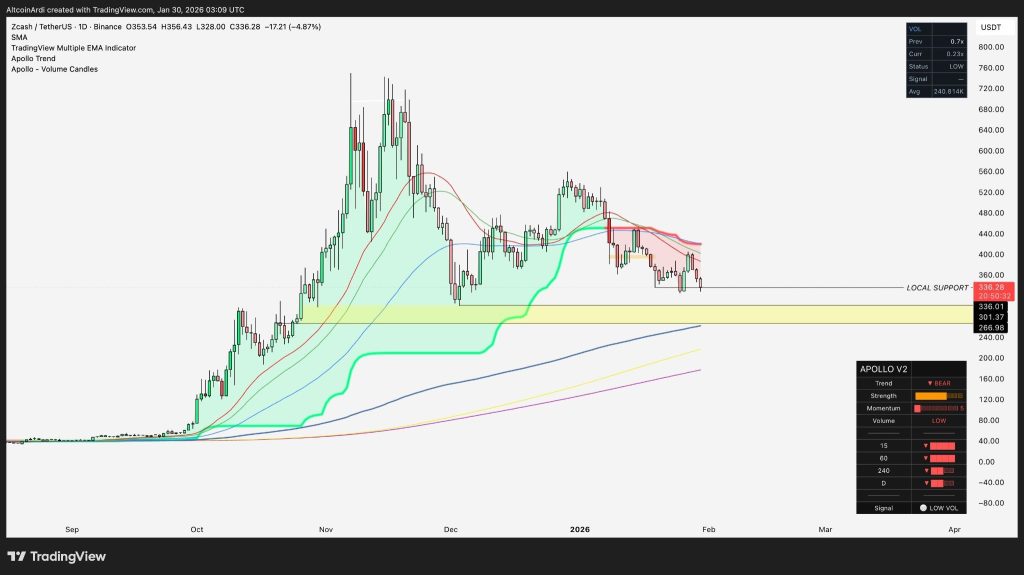
Zcash is starting to lean heavily on local support after another rough daily candle, with price hovering around $336. On the chart, that support line is basically the last thing stopping a deeper slide.
Price is also trading below the key moving averages, and the faster EMAs are stacked overhead, acting like a lid every time ZEC tries to move up.
The Apollo readout doesn’t help much either. Trend is marked as bear, and volume is still low. That usually means buyers aren’t stepping in with much confidence yet, which is why support levels like this tend to get tested again instead of producing an instant bounce.
ZEC Price Eyes the $300 Liquidity Zone
Ardi’s take is pretty direct. If this local support gives way, the ZEC price likely slides toward the $300 area. From a structure point of view, that makes sense. There’s not a lot of meaningful support between where price is now and that round-number zone.
It’s also not just about $300 exactly. The real area to watch is the broader $290–$300 range, which often acts like a liquidity pocket. If the ZEC price dips into that zone and snaps back quickly, it can turn into a classic flush-and-bounce move. If price drifts into it and struggles, the market usually starts looking lower pretty fast.
Source: X/@ArdiNSC
Another level that stands out is $310, which lines up with the 61.8% Fibonacci retracement of the move from $40 to the local highs. This is one of those levels where traders expect at least some kind of reaction.
If the ZEC price can’t bounce around $310 and the $290–$300 area doesn’t hold either, that’s when things start to feel heavier. At that point, the next logical downside area becomes the 200-day SMA near $270, which is the next clear technical reference on the chart.
Zcash (ZEC) Price Reaches a Key “Moment of Truth” – Is a Bullish Pennant Forming?_**
If Buyers Don’t Step In, $200 Comes Into View
This is where the risk really opens up. A weak response in the $290–$310 zone raises the odds of a much deeper pullback. In that scenario, the 78.6% Fibonacci level near $200 starts to come into play as a realistic downside target.
Right now, the ZEC price is sitting right at the decision point. Hold this local support and a bounce setup stays alive. Lose it cleanly, and attention shifts quickly to $310, then $300, with the big question being whether buyers finally step in with conviction or let price keep bleeding lower.
Disclaimer: The information on this page may come from third parties and does not represent the views or opinions of Gate. The content displayed on this page is for reference only and does not constitute any financial, investment, or legal advice. Gate does not guarantee the accuracy or completeness of the information and shall not be liable for any losses arising from the use of this information. Virtual asset investments carry high risks and are subject to significant price volatility. You may lose all of your invested principal. Please fully understand the relevant risks and make prudent decisions based on your own financial situation and risk tolerance. For details, please refer to
Disclaimer.
Related Articles
On-Chain Analyst ZachXBT Flags 6 Altcoins for Suspicious Price Manipulation
On-chain analyst ZachXBT flagged six altcoins (SIREN, MYX, COAI, M, PIPPIN, RIVER) for suspicious price movements akin to the RAVE token case, urging exchanges to act swiftly against market manipulation to protect retail investors.
GateNews3m ago
BTC falls 0.44% in 15 minutes: ETF fund outflows and derivatives shorts add to the slide
From 21:45 to 22:00 (UTC) on April 19, 2026, the BTC price dropped by 0.44% within 15 minutes. The candlestick range was 74,366.1 to 74,789.3 USDT, with an amplitude of 0.57%. Short-term volatility was concentrated. During this period, the trading volume for large orders rose significantly, market attention increased, and volatility intensified.
The main driving force behind this deviation was that U.S. spot Bitcoin ETFs saw a large net outflow of $291 million over two days from April 18 to April 19. This reflected institutional funds pulling away in the short term, which led to a marked increase in sell pressure in the spot market. At the same time, BTC perpetual contract
GateNews22m ago
Dogecoin Holds $0.094 as X Cashtags Drive Market Attention
Key Insights
Dogecoin holds above $0.094 despite market weakness as Bitcoin and Ethereum stabilize, reflecting resilience and sustained demand across major cryptocurrencies during the consolidation phase.
X launches smart cashtags enabling real-time crypto and stock tracking, improving marke
CryptoNewsLand2h ago
Dogecoin Holds $0.09 Support as $0.10 Breakout Looms
Dogecoin remains around $0.09, showing limited movement as traders await a clear breakout direction. Key support is at $0.08, with resistance at $0.10. Current technical indicators suggest a balanced market, but a decisive move is needed to shift momentum.
CryptoNewsLand3h ago
XRP Price Clears $1.40 While Broader Downtrend Persists
XRP's recent rise above $1.40 indicates a shift in market behavior after a consolidation phase. While momentum indicators show improvement, the broader bearish trend persists, limiting upside potential. Sustained support is crucial for extending its recovery.
CryptoNewsLand3h ago
Chainlink Price Compresses Below $10 as Breakout Pressure Builds
Key Insights
Chainlink maintains higher lows within a tightening range, reflecting steady accumulation as buyers absorb selling pressure and prepare for a potential breakout move
Repeated resistance tests near $10 weaken supply levels while rising support strengthens demand, increasing the p
CryptoNewsLand3h ago
