


#CryptoMarketSeesVolatility
FEAR & GREED INDEX: 9/100 - EXTREME FEAR
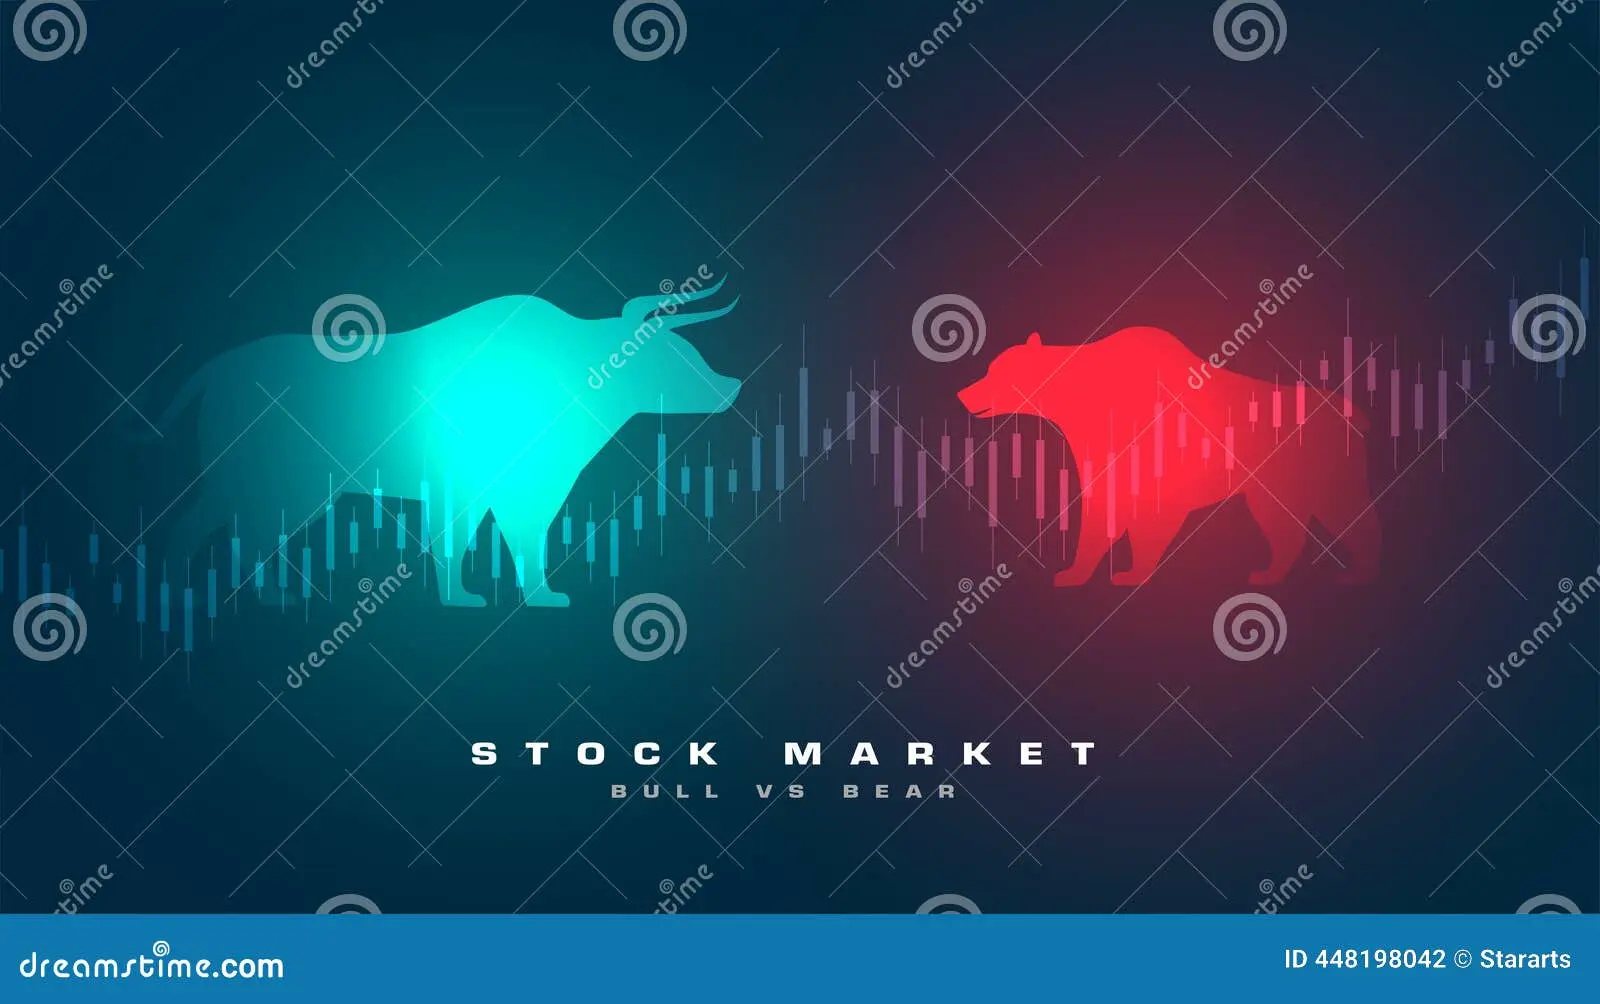
The market is not just nervous --- it is in full panic mode. A Fear & Greed Index reading of 9 out of 100 is historically rare, and it signals that the crowd is running for the exits. This level of fear does not appear in normal pullbacks; it typically shows up when confidence completely breaks down, when traders stop thinking long-term and start reacting emotionally to short-term price movements, often selling at losses just to escape uncertainty. At the same time, such extreme fear conditions are known for creating some of the most powerful turning points in the market cycle, because when everyone who wanted to sell has already sold, even a small shift in sentiment can trigger a strong reversal. This is why this zone is dangerous for weak hands but highly attractive for experienced investors who understand market psychology.
BITCOIN (BTC) - $66,539 | -1.09% (24h)
BTC is caught in a brutal tug-of-war right now.
24h range: $65,712 - $67,428
Volume: -$604M traded in the last 24 hours
The current Bitcoin structure reflects a market divided between fear-driven selling and strategic accumulation, where price is moving sideways not because nothing is happening, but because two powerful forces are colliding at the same time. On one side, institutional players continue to step in with confidence, treating these levels as an opportunity to build long-term positions, which signals that the broader belief in Bitcoin’s future remains intact despite short-term volatility. On the other side, retail traders are showing hesitation and weakness, pulling out liquidity from the market and reducing buying pressure, which is why every attempt to push higher lacks strong follow-through. The repeated testing of the $66,000 - $70,000 zone clearly shows that this is a critical decision area, but the absence of aggressive buyers indicates that conviction is still missing.
Bulls: MetaPlanet just became the 3rd largest corporate BTC holder, adding 5,075 BTC in Q1 alone. Strategy is also continuing its aggressive accumulation.
Bears: Retail is selling. Demand is contracting deeply. The $66,000 - $70,000 zone is being tested repeatedly but buyers are not showing up with conviction.
Wild Card: Shorts are extremely overcrowded. A short squeeze before Easter is a real scenario --- do not sleep on it.
Innovation front: Circle launched cirBTC, BlackRock dropped a covered call ETF (BITA), and post-quantum cryptography is now a serious discussion --- Coinbase's CEO already made moves on it.
What makes this situation even more explosive is the buildup of short positions, because when too many traders bet against the market at the same time, it creates a fragile setup where even a small upward move can force liquidations, accelerating price rapidly in a chain reaction. This is why, despite weak sentiment, the market still holds the potential for sudden upside volatility.
Takeaway: Institutions are loading. Retail is dumping. The battle is real.
ETHEREUM (ETH) - $2,048 | -2.35% (24h)
ETH is bleeding harder than BTC right now.
24h range: $2,017 - $2,102
Volume: -$364M in 24h
Ethereum is currently facing a more aggressive wave of selling pressure compared to Bitcoin, and this is reflected not just in its price decline but also in its broader market behavior, where weakness has persisted for an extended period. The fact that ETH has recorded six consecutive red months highlights the intensity of this downtrend, marking one of the most challenging phases since 2018, and showing how deeply sentiment around ETH has been affected.
The bad: ETH just logged six consecutive red months --- the worst streak since 2018. That's a historic pain level.
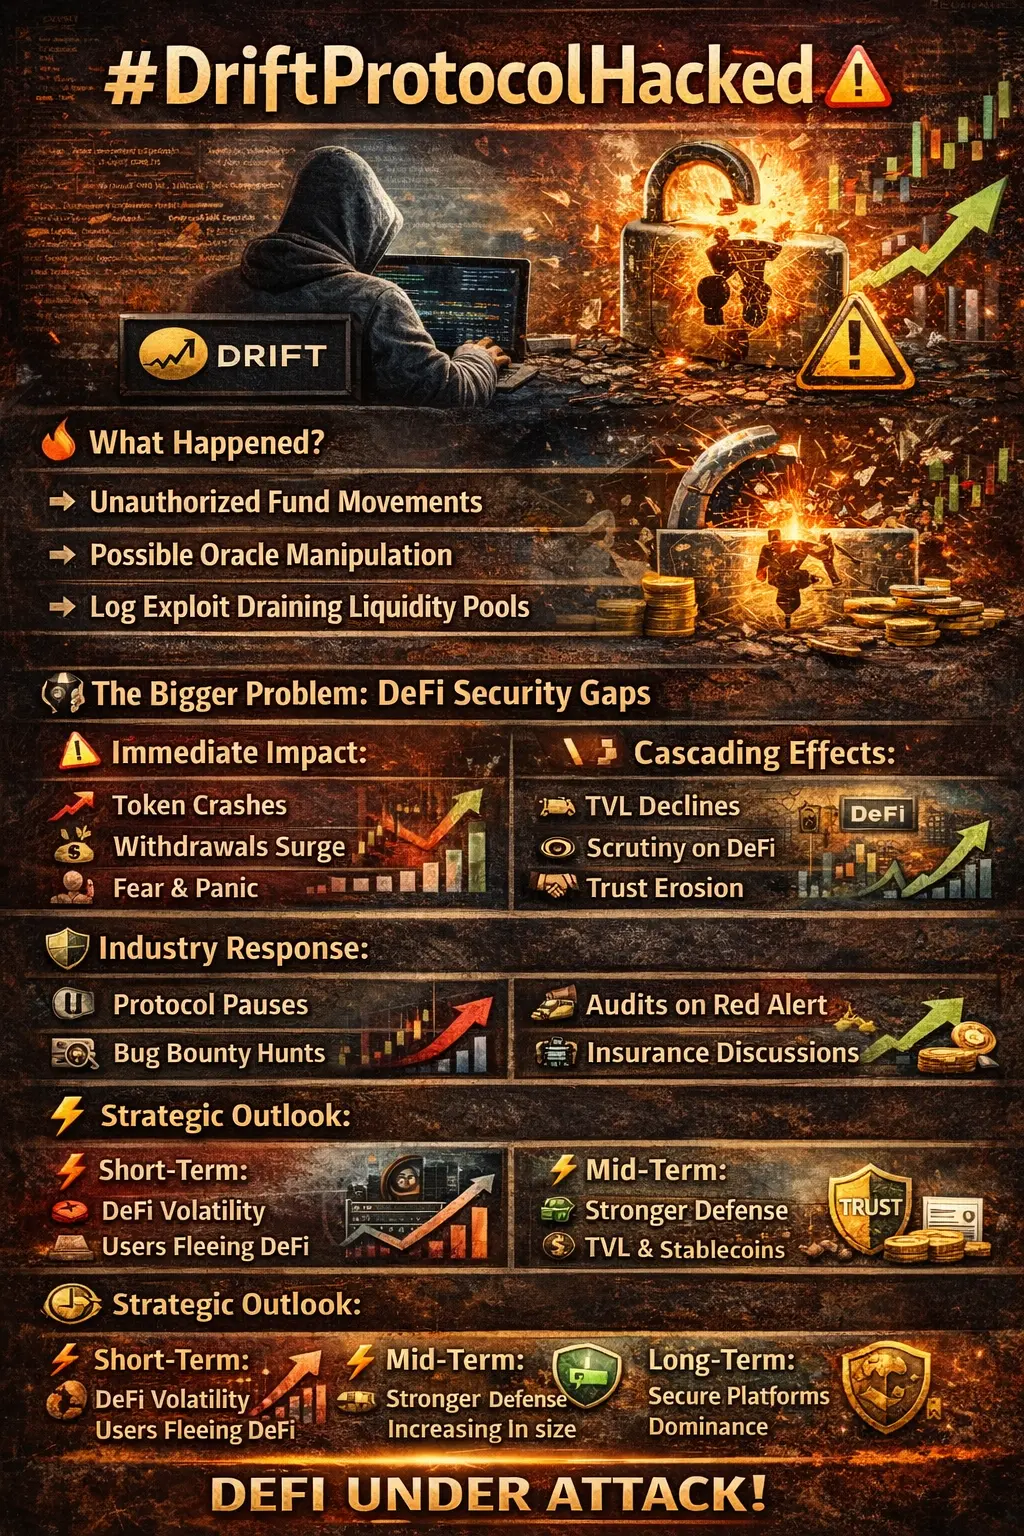
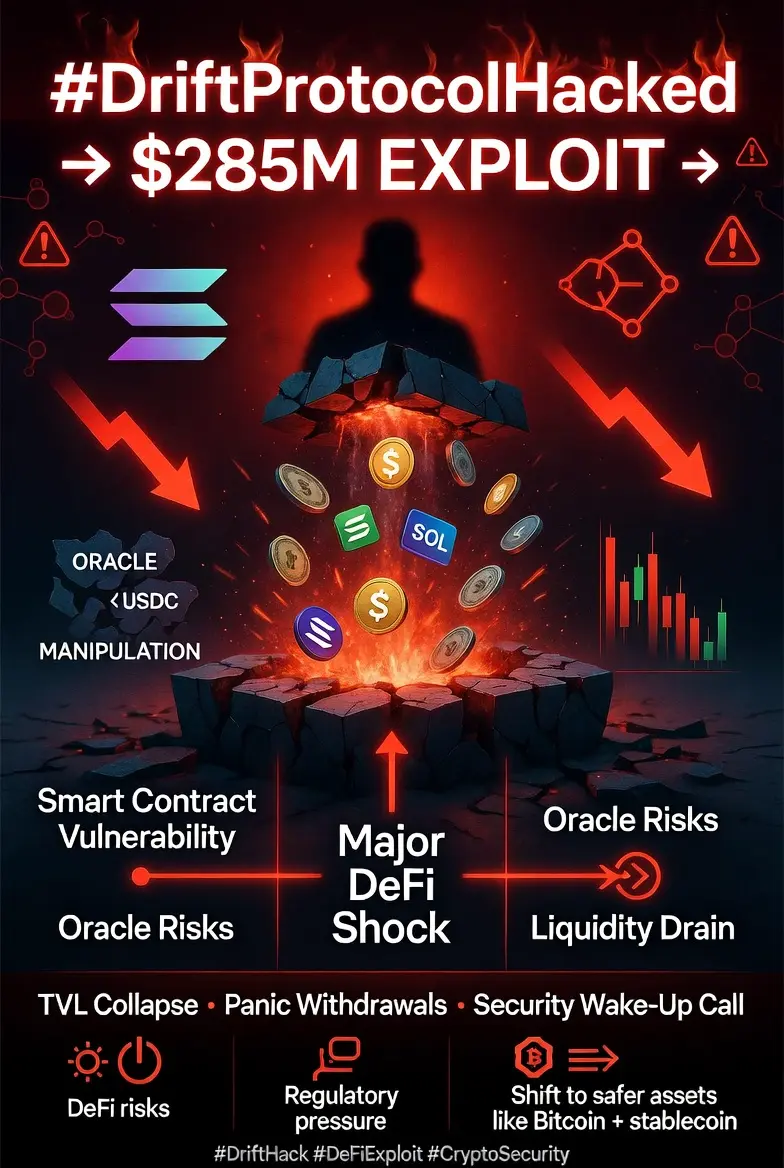
The ugly: The Drift Protocol hack resulted in $285M worth of assets converted into 129,000 ETH and bridged onto Ethereum --- that is pure sell pressure flooding the chain.
The good: BlackRock deposited 15,103 ETH to Coinbase. BitMine accumulated 71,179 ETH last week. On-chain, ETH still shows nearly 790,000 daily active addresses and 250,000+ new addresses per day. The network is alive.
Macro view: ETF flows, on-chain liquidations, and quantum computing security are the three big themes dominating ETH discussions right now.
What makes Ethereum particularly interesting in this phase is the clear disconnect between price action and fundamentals, because while the price continues to struggle under pressure, the network itself remains highly active and continues to grow. This type of divergence often signals that the weakness may be temporary and driven more by external factors and forced selling rather than a collapse in the underlying ecosystem.
Takeaway: ETH is getting battered in price but built in fundamentals. Classic divergence.
TOP GAINERS (24h)
Coin
Change
ZND
+165.59%
OKZOO (AIOT)
+137.32%
Cartesi (CTSI)
+69.37%
aiPump (AIPUMP)
+50.58%
Arena-Z (A2Z)
+38.9%
Even in a market dominated by fear, the presence of such massive gains in select low-cap assets shows that liquidity is not completely gone, but rather highly selective and concentrated in speculative opportunities. These sharp upward moves are typically driven by short-term catalysts, hype cycles, or low liquidity conditions that allow price to move aggressively with relatively small capital inflows. However, these gains should not be confused with a broader market recovery, because they exist in isolation and often reverse just as quickly as they rise.
Note: These are low-cap, high-risk moves. Huge green candles in an extreme fear market usually mean isolated catalysts, not a broad bull signal. Trade with caution.
TOP LOSERS (24h)
Coin
Change
StakeStone (STO)
-55.88%
Tranchess (CHESS)
-37.59%
AsMatch (ASMATCH)
-30.43%
Solar (SXP)
-25.31%
The downside in the market is far more aggressive and consistent, with several assets experiencing sharp and high-volume declines, which typically indicate deeper structural problems rather than normal corrections. When a coin drops this significantly within a short time while maintaining high trading volume, it often reflects panic selling combined with negative developments or major liquidity events.
STO is the biggest story here --- down nearly 56% with $47M in volume. That is not a slow bleed, that is a collapse. When a coin drops this hard on high volume, it usually means a major unlock, a rug pull, or a very bad piece of news hit.
HOTTEST COINS RIGHT NOW
GT (GateToken), STO, PIPPIN, SIREN, BNB are all generating the most trading activity. PIPPIN is the one outlier here --- up +15.12% while everything else is red. Worth watching.
The surge in activity around these coins shows where attention and liquidity are currently flowing, and in volatile markets, attention itself becomes a powerful driver of price movement. Coins that attract trading interest often experience exaggerated moves in both directions, making them key areas to monitor for short-term opportunities as well as risk.
THE BIG PICTURE
The overall market structure remains fragile, with Bitcoin acting as the anchor but showing instability around key levels, while Ethereum continues to underperform, signaling weakness in the broader altcoin sector. At the same time, macroeconomic pressures such as geopolitical uncertainty, inflation concerns, and shifting global financial conditions are reducing risk appetite, which directly impacts crypto as a high-risk asset class.
The whole market is red. BTC is the anchor and it is wobbling around $66.5K.
ETH is underperforming BTC significantly --- the flippening talk is dead for now.
Macro pressure (geopolitics, inflation fears, tariff uncertainty) is suppressing risk appetite across the board.
Institutions are buying the dip quietly while retail panic-sells.
The setup: If shorts get squeezed and macro fear eases even slightly, a fast recovery move is possible. But until then, the path of least resistance is still down.
This creates a classic environment where smart money operates quietly in the background, accumulating during fear, while emotional participants exit the market under pressure, often at the worst possible time.
FEAR & GREED INDEX: 9/100 - EXTREME FEAR
The market is not just nervous --- it is in full panic mode. A Fear & Greed Index reading of 9 out of 100 is historically rare, and it signals that the crowd is running for the exits. This level of fear does not appear in normal pullbacks; it typically shows up when confidence completely breaks down, when traders stop thinking long-term and start reacting emotionally to short-term price movements, often selling at losses just to escape uncertainty. At the same time, such extreme fear conditions are known for creating some of the most powerful turning points in the market cycle, because when everyone who wanted to sell has already sold, even a small shift in sentiment can trigger a strong reversal. This is why this zone is dangerous for weak hands but highly attractive for experienced investors who understand market psychology.
BITCOIN (BTC) - $66,539 | -1.09% (24h)
BTC is caught in a brutal tug-of-war right now.
24h range: $65,712 - $67,428
Volume: -$604M traded in the last 24 hours
The current Bitcoin structure reflects a market divided between fear-driven selling and strategic accumulation, where price is moving sideways not because nothing is happening, but because two powerful forces are colliding at the same time. On one side, institutional players continue to step in with confidence, treating these levels as an opportunity to build long-term positions, which signals that the broader belief in Bitcoin’s future remains intact despite short-term volatility. On the other side, retail traders are showing hesitation and weakness, pulling out liquidity from the market and reducing buying pressure, which is why every attempt to push higher lacks strong follow-through. The repeated testing of the $66,000 - $70,000 zone clearly shows that this is a critical decision area, but the absence of aggressive buyers indicates that conviction is still missing.
Bulls: MetaPlanet just became the 3rd largest corporate BTC holder, adding 5,075 BTC in Q1 alone. Strategy is also continuing its aggressive accumulation.
Bears: Retail is selling. Demand is contracting deeply. The $66,000 - $70,000 zone is being tested repeatedly but buyers are not showing up with conviction.
Wild Card: Shorts are extremely overcrowded. A short squeeze before Easter is a real scenario --- do not sleep on it.
Innovation front: Circle launched cirBTC, BlackRock dropped a covered call ETF (BITA), and post-quantum cryptography is now a serious discussion --- Coinbase's CEO already made moves on it.
What makes this situation even more explosive is the buildup of short positions, because when too many traders bet against the market at the same time, it creates a fragile setup where even a small upward move can force liquidations, accelerating price rapidly in a chain reaction. This is why, despite weak sentiment, the market still holds the potential for sudden upside volatility.
Takeaway: Institutions are loading. Retail is dumping. The battle is real.
ETHEREUM (ETH) - $2,048 | -2.35% (24h)
ETH is bleeding harder than BTC right now.
24h range: $2,017 - $2,102
Volume: -$364M in 24h
Ethereum is currently facing a more aggressive wave of selling pressure compared to Bitcoin, and this is reflected not just in its price decline but also in its broader market behavior, where weakness has persisted for an extended period. The fact that ETH has recorded six consecutive red months highlights the intensity of this downtrend, marking one of the most challenging phases since 2018, and showing how deeply sentiment around ETH has been affected.
The bad: ETH just logged six consecutive red months --- the worst streak since 2018. That's a historic pain level.
The ugly: The Drift Protocol hack resulted in $285M worth of assets converted into 129,000 ETH and bridged onto Ethereum --- that is pure sell pressure flooding the chain.
The good: BlackRock deposited 15,103 ETH to Coinbase. BitMine accumulated 71,179 ETH last week. On-chain, ETH still shows nearly 790,000 daily active addresses and 250,000+ new addresses per day. The network is alive.
Macro view: ETF flows, on-chain liquidations, and quantum computing security are the three big themes dominating ETH discussions right now.
What makes Ethereum particularly interesting in this phase is the clear disconnect between price action and fundamentals, because while the price continues to struggle under pressure, the network itself remains highly active and continues to grow. This type of divergence often signals that the weakness may be temporary and driven more by external factors and forced selling rather than a collapse in the underlying ecosystem.
Takeaway: ETH is getting battered in price but built in fundamentals. Classic divergence.
TOP GAINERS (24h)
Coin
Change
ZND
+165.59%
OKZOO (AIOT)
+137.32%
Cartesi (CTSI)
+69.37%
aiPump (AIPUMP)
+50.58%
Arena-Z (A2Z)
+38.9%
Even in a market dominated by fear, the presence of such massive gains in select low-cap assets shows that liquidity is not completely gone, but rather highly selective and concentrated in speculative opportunities. These sharp upward moves are typically driven by short-term catalysts, hype cycles, or low liquidity conditions that allow price to move aggressively with relatively small capital inflows. However, these gains should not be confused with a broader market recovery, because they exist in isolation and often reverse just as quickly as they rise.
Note: These are low-cap, high-risk moves. Huge green candles in an extreme fear market usually mean isolated catalysts, not a broad bull signal. Trade with caution.
TOP LOSERS (24h)
Coin
Change
StakeStone (STO)
-55.88%
Tranchess (CHESS)
-37.59%
AsMatch (ASMATCH)
-30.43%
Solar (SXP)
-25.31%
The downside in the market is far more aggressive and consistent, with several assets experiencing sharp and high-volume declines, which typically indicate deeper structural problems rather than normal corrections. When a coin drops this significantly within a short time while maintaining high trading volume, it often reflects panic selling combined with negative developments or major liquidity events.
STO is the biggest story here --- down nearly 56% with $47M in volume. That is not a slow bleed, that is a collapse. When a coin drops this hard on high volume, it usually means a major unlock, a rug pull, or a very bad piece of news hit.
HOTTEST COINS RIGHT NOW
GT (GateToken), STO, PIPPIN, SIREN, BNB are all generating the most trading activity. PIPPIN is the one outlier here --- up +15.12% while everything else is red. Worth watching.
The surge in activity around these coins shows where attention and liquidity are currently flowing, and in volatile markets, attention itself becomes a powerful driver of price movement. Coins that attract trading interest often experience exaggerated moves in both directions, making them key areas to monitor for short-term opportunities as well as risk.
THE BIG PICTURE
The overall market structure remains fragile, with Bitcoin acting as the anchor but showing instability around key levels, while Ethereum continues to underperform, signaling weakness in the broader altcoin sector. At the same time, macroeconomic pressures such as geopolitical uncertainty, inflation concerns, and shifting global financial conditions are reducing risk appetite, which directly impacts crypto as a high-risk asset class.
The whole market is red. BTC is the anchor and it is wobbling around $66.5K.
ETH is underperforming BTC significantly --- the flippening talk is dead for now.
Macro pressure (geopolitics, inflation fears, tariff uncertainty) is suppressing risk appetite across the board.
Institutions are buying the dip quietly while retail panic-sells.
The setup: If shorts get squeezed and macro fear eases even slightly, a fast recovery move is possible. But until then, the path of least resistance is still down.
This creates a classic environment where smart money operates quietly in the background, accumulating during fear, while emotional participants exit the market under pressure, often at the worst possible time.