Key Takeaways
-
OriginTrail (TRAC) has surged around 12% in a single day, drawing renewed attention to the token.
-
TRAC has broken out from an ascending triangle near $0.46 on the daily chart, signaling growing bullish momentum.
-
Similar breakout structures in July and October 2025 previously led to strong rallies of 63% and 113%.
-
Holding the $0.44–$0.46 zone as support will be crucial to keep the bullish fractal setup intact.
-
If the pattern plays out, TRAC could attempt a move toward its long-term ascending resistance above $1.00.
OriginTrail, the decentralized knowledge graph protocol, is stepping back into the spotlight as its native token TRAC records a strong 12% daily surge. Beyond the price jump, the real signal is coming from the charts, where a familiar fractal breakout structure is starting to emerge on the daily timeframe, hinting that a larger upside move could be forming.
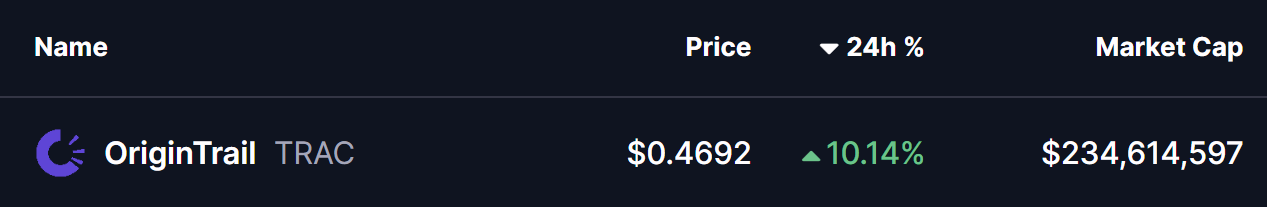
Source: Coinmarketcap
Fractal Breakout Hints at Potential Upside Move
On the daily chart, TRAC has confirmed a breakout from an ascending triangle pattern near the $0.46 level. This breakout is particularly important as price is now trading just above the 200-day moving average, a level that has historically acted as a major trend-defining zone for TRAC.
What makes this setup more compelling is its similarity to previous breakout phases. In late July 2025, a comparable structure resulted in a 63% upside move after price held above its breakout base. Later, in early October 2025, TRAC broke out from a right-angled descending broadening wedge pattern. That move was followed by a reclaim of the 200-day moving average and ultimately led to a powerful 113% rally.

OriginTrail (TRAC) Daily Chart/Coinsprobe (Source: Tradingview)
The current setup shares key characteristics with those earlier moves. Price compression, a clean breakout, and interaction with the 200-day MA suggest that TRAC may once again be transitioning from consolidation into expansion.
What’s Next for TRAC?
If this fractal breakout plays out as expected, holding the $0.44–$0.46 zone as support will be crucial. A sustained hold above this range, along with continued strength above the 200-day moving average, could act as a launchpad for further upside.
In that scenario, TRAC may attempt a move toward its long-term ascending resistance trendline, which currently sits above the $1.00 level. A push toward that zone would align closely with the magnitude of prior fractal-driven rallies seen on the chart.
That said, fractal patterns are never guarantees. Broader market conditions, liquidity, and overall sentiment will continue to influence price action. A failure to hold the $0.44–$0.46 support zone or a rejection back below the 200-day moving average could invalidate the breakout and weaken the bullish fractal thesis.
Bottom Line
TRAC is showing early signs of another technically significant breakout, supported by historical fractal behavior and a reclaim of a key long-term moving average. If buyers can defend the current support zone, the chart suggests that OriginTrail may be positioning itself for a larger upside move in the weeks ahead.
Disclaimer: The views and analysis presented in this article are for informational purposes only and reflect the author’s perspective, not financial advice. Technical patterns and indicators discussed are subject to market volatility and may or may not yield the anticipated results. Investors are advised to exercise caution, conduct independent research, and make decisions aligned with their individual risk tolerance.
About Author: Nilesh Hembade is the Founder and Lead Author of Coinsprobe, with over 5 years of experience in the cryptocurrency and blockchain industry. Since launching Coinsprobe in 2023, he has been providing daily, research-driven insights through in-depth market analysis, on-chain data, and technical research.
Disclaimer: The information on this page may come from third parties and does not represent the views or opinions of Gate. The content displayed on this page is for reference only and does not constitute any financial, investment, or legal advice. Gate does not guarantee the accuracy or completeness of the information and shall not be liable for any losses arising from the use of this information. Virtual asset investments carry high risks and are subject to significant price volatility. You may lose all of your invested principal. Please fully understand the relevant risks and make prudent decisions based on your own financial situation and risk tolerance. For details, please refer to
Disclaimer.
Related Articles
Why Gold Price Is Falling Even With Global Tension Escalating?
The essay discusses the unexpected decline in gold prices due to a strong dollar driven by rising oil prices and inflation. As the Federal Reserve refrains from rate cuts, gold becomes less attractive compared to interest-bearing investments. This situation prompts investors to consider Bitcoin as a potential new digital gold, indicating a shift in traditional asset preferences amidst evolving market conditions.
CaptainAltcoin1h ago
Why Aksel Kibar Believes Bitcoin Price Is Trap and This 'Rising Wedge' Signals Deeper Drop - U.Today
Analyst Aksel Kibar warns Bitcoin investors that the current price recovery is a technical trap within a downtrend. He identifies a "rising wedge" pattern and predicts potential declines to $60,000 or lower, advising caution against misinterpreting short-term fluctuations.
UToday3h ago
US Bitcoin Spot ETF Attracts Inflows for Seven Consecutive Days, Institutional Funds Return
U.S. cryptocurrency spot ETFs have recently seen a warming in capital inflows, particularly ahead of the Federal Reserve's interest rate decision, as investor interest in digital assets has rebounded. Bitcoin and Ethereum spot ETFs have recorded net inflows for multiple consecutive days, with Bitcoin attracting $199.4 million in a single day, marking a record of seven consecutive days of inflows. This phenomenon reflects increased institutional capital allocation, with market structure showing that investors are increasingly inclined to invest through regulated products, strengthening market support.
区块客4h ago
Bitcoin and Stocks Need to Confirm First: The Real Altcoin Recovery Timeline
The current crypto market continues to struggle without a clear altseason, as Bitcoin remains in a sideways trend. Analysts suggest that until Bitcoin shows a confirmed bullish structure and macroeconomic conditions improve, altcoins will likely remain stagnant. Speculation points to potential recovery in Q3 to Q4 rather than the earlier hoped-for timeline.
CaptainAltcoin4h ago
Bitcoin Decouples From S&P 500 as Retail Demand Weakens
Bitcoin retail activity has decreased by 10%, the lowest since January 2025, indicating weaker market participation. The advent of ETFs has shifted retail access off-chain, while Bitcoin has diverged from the S&P 500, marking its longest decoupling since 2020 amid a correction phase.
CryptoFrontNews4h ago
