Data terbuka di blockchain tidak memiliki nilai jika tidak dapat diakses dan dipahami oleh masyarakat. Pengguna baru di dunia kripto biasanya hanya melihat harga token, karena itu sangat mudah. Namun, ketika pengalaman mereka bertambah, mereka menyadari bahwa untuk memahami pasar secara menyeluruh, dibutuhkan data tingkat pool untuk DeFi, data retensi untuk GameFi, dan lain-lain—misalnya TVL, informasi dompet, serta data deposit dan penarikan.
Bagaimana jika Anda ingin menelusuri pergerakan whale antar berbagai proyek? Atau ingin mengetahui dampak krisis PR terhadap suatu protokol secara menyeluruh? Bagaimana cara mendapatkan data semacam itu, dan bagaimana menciptakan solusi khusus untuk menjawab pertanyaan yang sangat spesifik?
Mendapatkan data mentah yang belum difilter dari satu chain sebenarnya tidak terlalu rumit secara teknis. Inilah sebabnya mengapa ada banyak layanan di bidang analitik blockchain. Prosesnya pada dasarnya melibatkan penataan data—standarisasi jutaan baris data yang masuk ke basis data, terutama dengan implementasi teknis blockchain yang sangat beragam. Dengan pemrograman UX yang canggih, data tersebut diubah menjadi bentuk yang mudah dipahami secara visual.
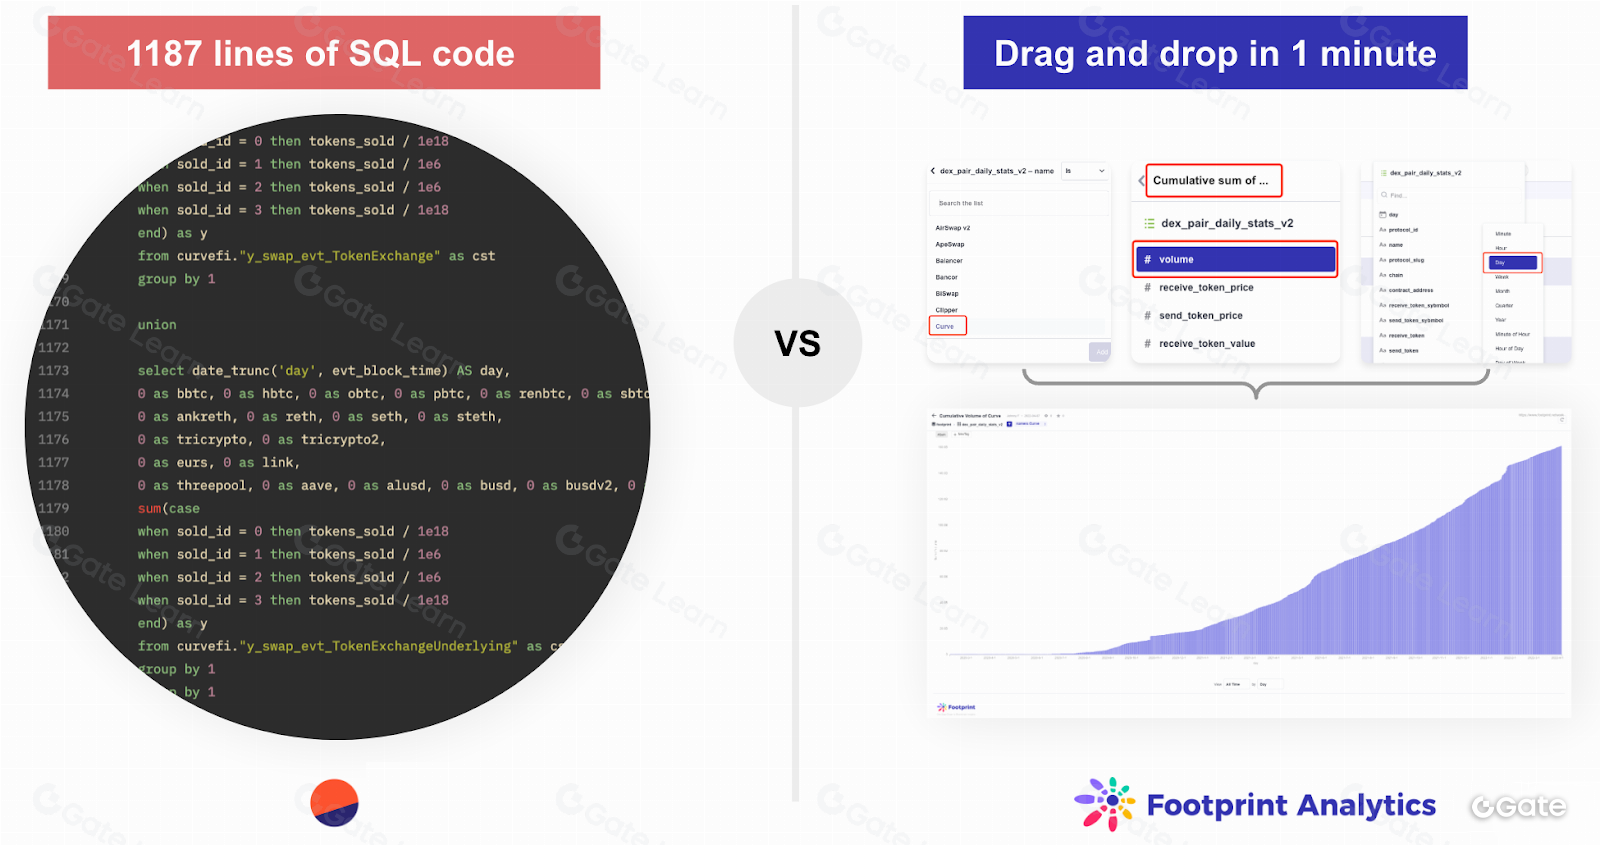
Membiarkan pengguna menambahkan berbagai metrik dari berbagai proyek ke dalam grafik untuk dibandingkan bukanlah hal yang sulit. Dune Analytics membutuhkan SQL untuk melakukan ini. Sementara platform lain, seperti Nansen, menawarkan grafik yang dapat disesuaikan tetapi dalam skala yang jauh lebih terbatas. Namun, bagaimana jika Anda ingin membandingkan data dari berbagai chain? Di sinilah tantangannya. Di Footprint, kami mengembangkan model yang menggabungkan data mentah ini dan mengindeksnya agar bermakna.
Informasi tentang jutaan transaksi ini dipecah berdasarkan domain—mesin data kami menentukan apakah data tersebut dapat diklasifikasikan sebagai GameFi, NFT, DEX, atau lainnya. Kami mendekode data ini agar analis dapat mencari informasi yang mereka butuhkan, seperti waktu blok, TVL, harga token, dan lain-lain, serta langsung menampilkan data tersebut dalam grafik.
Alih-alih deretan angka dan huruf yang sulit dipahami oleh kebanyakan orang, Anda mendapatkan alamat dompet, chain, koleksi NFT, dan kategori lain yang bermakna.
Di sisi lain, analis berpengalaman yang menginginkan fleksibilitas lebih juga dapat bekerja langsung dengan data mentah menggunakan SQL atau Python.
Membangun mesin data yang paling komprehensif di industri (kami saat ini mencakup 22 chain) sekaligus mempertahankan performa terbaik adalah tantangan teknik yang besar.
Artikel berikut akan menguraikan desain data kami secara mendalam.
Permasalahan Analitik Cross-Chain
Anda tidak bisa membandingkan apel dengan jeruk.
Berapa ketebalan kulit apel Golden Delicious, atau jumlah biji di inti jeruk Cara Cara? Tentu saja itu tidak masuk akal, tetapi segalanya mulai logis saat Anda membandingkan tingkat kemanisan, ukuran, kekerasan, konsumsi global—hal-hal yang bisa diukur secara logis untuk kedua buah tersebut.
Kategorisasi logis ini mirip dengan data semantik terstruktur. Tidak peduli seperti apa kode minting NFT di Solana, dan tidak peduli seperti apa di Ethereum, Anda harus menemukan cara untuk memasukkan semua data ini ke dalam satu kategori yang disebut “Minting.”
Kebanyakan solusi analitik blockchain utama memungkinkan Anda membandingkan apel dengan jeruk. Namun, di Footprint Analytics, kami dapat membandingkan apel dengan jeruk, kiwi, nanas, dan lainnya.
Per Desember, kami memproses data dari 22 chain berbeda, lebih banyak dari platform lain mana pun. Footprint Analytics secara otomatis mengambil blok, log, trace, dan transaksi di blockchain. Kami melengkapi ini dengan data kontribusi komunitas dan data dari API pihak ketiga (misalnya data harga token dari Coingecko.) Semua data ini awalnya mentah dan tidak terstruktur. Kami menatanya ke dalam kategori, seperti borrowing, lending, yield farming, dan lain-lain. Dengan cara ini, data apa pun dari blockchain dapat diakses dengan mudah oleh siapa saja.
Bagaimana Footprint Analytics Menyeimbangkan Fleksibilitas dan Kesederhanaan
Aplikasi web Footprint dibangun di atas teknologi open source Metabase. Baca lebih lanjut tentang Metabase. Kami menggunakan Metabase karena sifatnya yang terbuka—teknologi ini memungkinkan pengguna berkontribusi pada basis kode, mengembangkan dan meningkatkannya dari waktu ke waktu.
Contohnya, pada pembaruan terbaru Metabase diperkenalkan fitur model. Fitur ini memungkinkan pengguna mengkurasi data dari tabel lain atau beberapa tabel dalam satu basis data untuk mengantisipasi jenis pertanyaan yang akan diajukan terhadap data tersebut.
Analis dapat membuat grafik di platform Footprint Analytics dengan builder query drag-and-drop yang praktis. Kemampuan ini secara signifikan menurunkan hambatan penggunaan, sehingga siapa pun tanpa pengetahuan teknis dapat menggunakan produk dan memperoleh nilai bisnis.
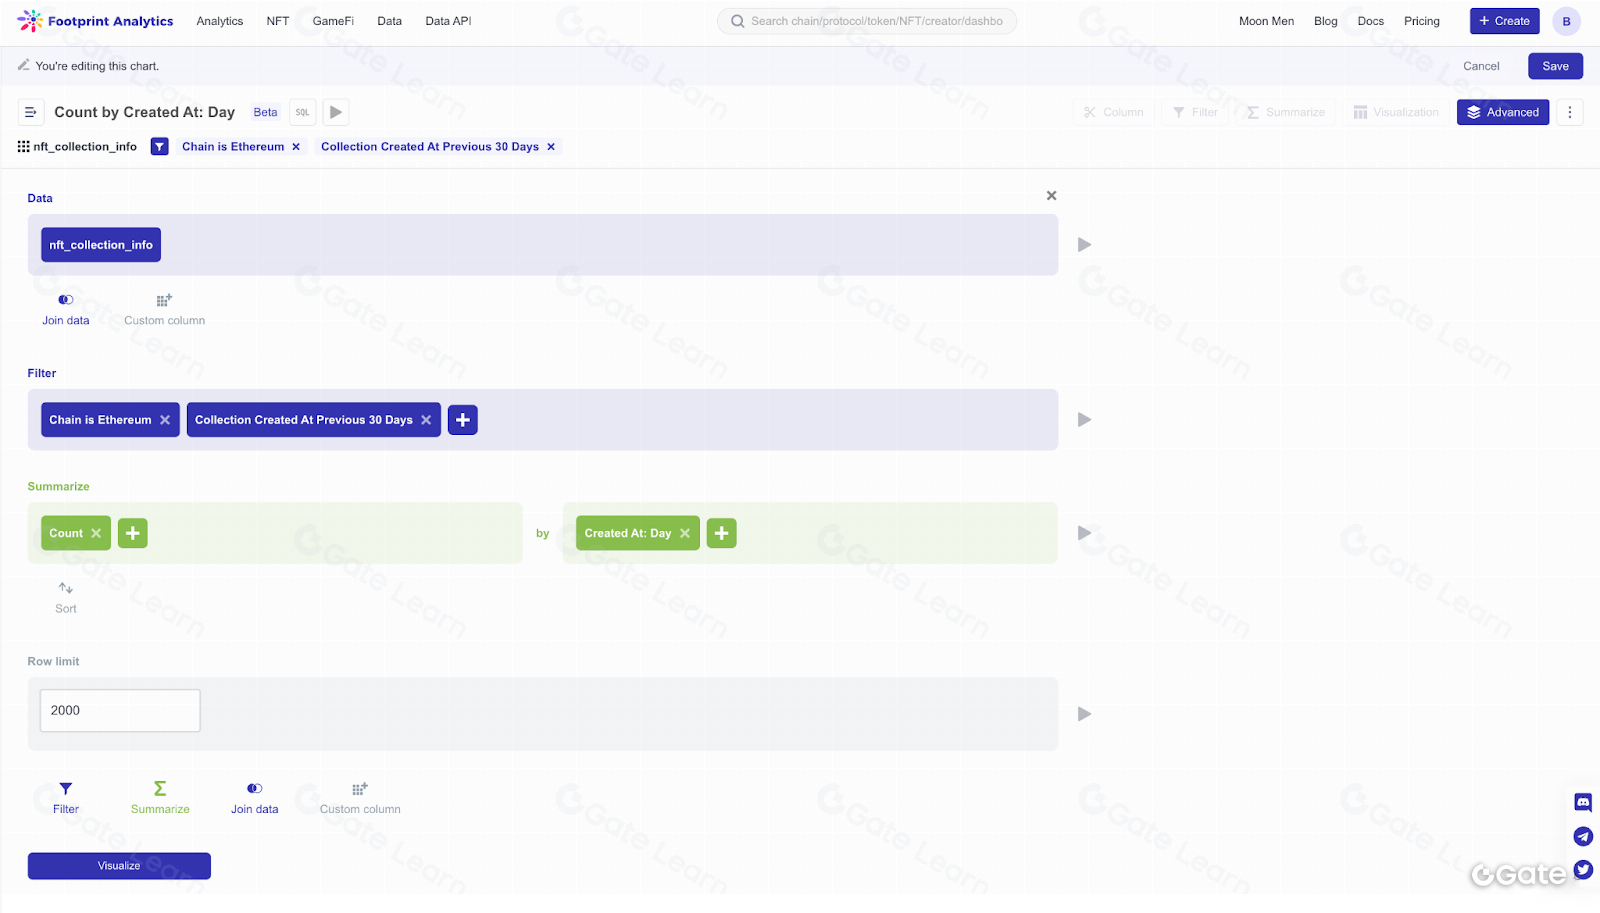
Penting untuk dicatat bahwa secara arsitektural, Metabase adalah abstraksi di atas kode SQL; artinya, setiap permintaan yang dibuat dengan drag-and-drop dapat direpresentasikan sebagai SQL. Dengan demikian, pengguna yang ingin membangun query lebih kompleks atau lebih suka bekerja dengan data menggunakan kode dapat langsung menggunakan SQL.
Banyak solusi analitik alternatif memungkinkan pengguna menganalisis berbagai jaringan sesuai dengan tingkat kebutuhan yang berbeda. Namun, umumnya, solusi alternatif cenderung ekstrem, baik menerapkan produk yang sangat fleksibel tetapi membutuhkan pengetahuan bahasa query atau bahkan bahasa pemrograman, atau antarmuka yang sangat sederhana dengan skrip siap pakai dan fleksibilitas rendah.
Cakupan
Kami memiliki salah satu cakupan terluas di pasar. Kami akan menguraikan cakupan saat ini secara detail, merujuk pada organisasi data (level, domain), di bagian berikut.
Bagaimana Footprint Analytics Memproses Begitu Banyak Data?
Keunggulan utama kami adalah Platform Footprint Analytics, yang didukung oleh Footprint Machine Learning Platform.
“Platform Footprint Analytics” dapat merujuk pada situs web yang pengguna lihat saat mengunjungi footprint.network. Namun, saat kami membahas Platform Footprint Analytics, kami juga merujuk pada mesin yang bekerja di balik layar.
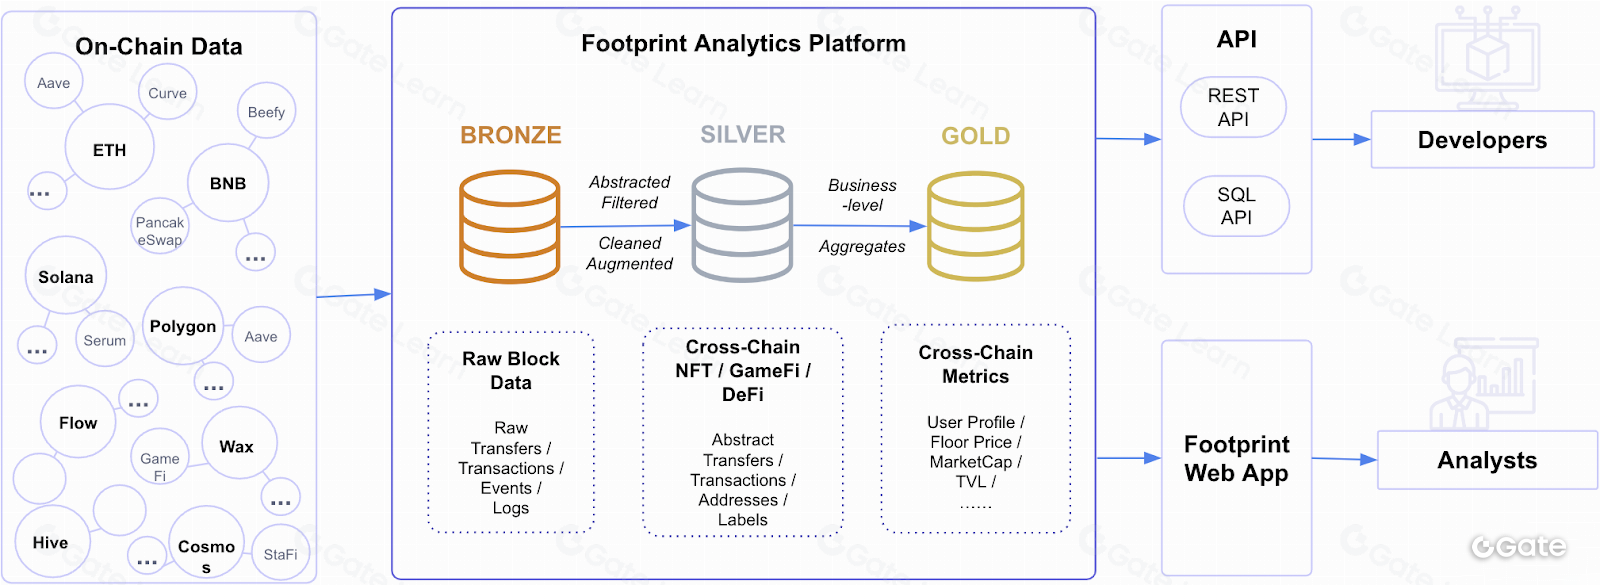
Level
Mesin ini mengubah Data Bronze menjadi Silver, kemudian Gold menggunakan beberapa teknik ETL data, seperti Python dan SQL. Ke depannya, kami berencana membuka kode ETL, termasuk kode parsing dari Bronze ke Silver, sebagai open source.
Kami juga memungkinkan organisasi mana pun untuk mengakses kumpulan data terstruktur ini melalui API data blockchain kami.
Dapatkan Data Blockchain Terkaya di Dunia dengan Footprint Data API Kami
UI bukan satu-satunya antarmuka yang dapat digunakan untuk mengakses data. Semua antarmuka yang didukung saat ini dapat dilihat di sini: Interfaces
Sebelum Footprint Analytics, analisis blockchain terbatas pada data yang tidak lengkap dan tidak terstruktur. Selain itu, organisasi yang menggunakan solusi terdepan pun menghadapi keterlambatan akses, keterbatasan performa, dan agregasi API yang mahal.
Berkat platform kami yang memproses data on-chain dari 23 chain ke dalam tier Silver dan Gold seperti disebutkan di atas, setiap organisasi dapat mengakses sebagian besar data GameFi, NFT, dan DeFi dunia, semuanya dengan satu API terpadu. Footprint Analytics mendukung REST API dan SQL API.
Aplikasi seperti apa yang dapat Anda bangun dengan data ini? Berikut beberapa contohnya:
- Melacak tingkat retensi gamer terbaik dan terburuk di seluruh judul GameFi
- Memicu peringatan ketika dompet whale memindahkan dana masuk atau keluar dari chain atau protokol yang diminati
- Membandingkan fluktuasi TVL antar chain dengan harga komoditas
- Membuat tampilan khusus untuk koleksi NFT dari berbagai jaringan
- Menemukan koleksi terpopuler terbaru dan mengakses analitik mendalam untuk lebih dari 15.000 proyek
- Memantau dan melacak aliran dana whale untuk mengidentifikasi peluang investasi dan potensi risiko
Dengan Footprint, siapa pun dapat semakin dekat dengan analitik blockchain, baik Anda investor, analis, trader ritel, developer, maupun sekadar menjelajahi proyek kripto favorit Anda.