Is Avalanche (AVAX) About to Repeat Its 2020 Magic Against Bitcoin? This Emerging Fractal Suggest So!

Key Takeaways
-
AVAX/BTC is flashing a rare fractal similar to its 2020 pre-bull run
-
AVAX remains capped beneath long-term descending resistance
-
A breakout could signal trend reversal and renewed relative strength
-
Analysts are watching the September 2025 highs (~$36) as a potential upside target
The broader altcoins crypto market has faced strong selling pressure over the past 30 days, with Ethereum (ETH) sliding more than 33%, keeping pressure firmly on major altcoins.
Among them, Avalanche (AVAX) has also been weak — dropping over 34% during the same period. But beneath the surface, this pullback has pushed AVAX/BTC into a structure that’s starting to look eerily familiar.
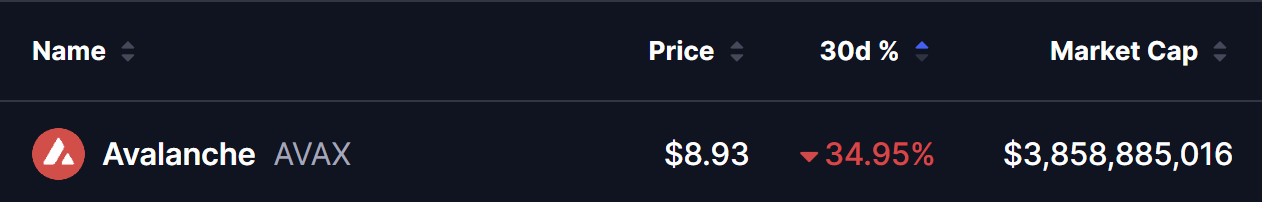
Source: Coinmarketcap
According to market watchers, AVAX is now mirroring its **2020 pre-bullish rally **fractal — a setup that previously marked the beginning of a powerful relative-strength move against Bitcoin.
AVAX Mirrors Its 2020 Pre-Bullish Rally Setup
Crypto analyst Kaleo recently pointed out that the current AVAX/BTC price action looks “incredibly similar” to what unfolded in late 2020, shortly after Avalanche’s mainnet launch.
Back then, AVAX experienced an early hype-driven spike followed by a sharp correction. Price then spent months grinding lower before finally forming higher-timeframe lows. Once structure flipped bullish, AVAX entered a new range — a move that later fueled massive gains during the 2020–2021 altseason.
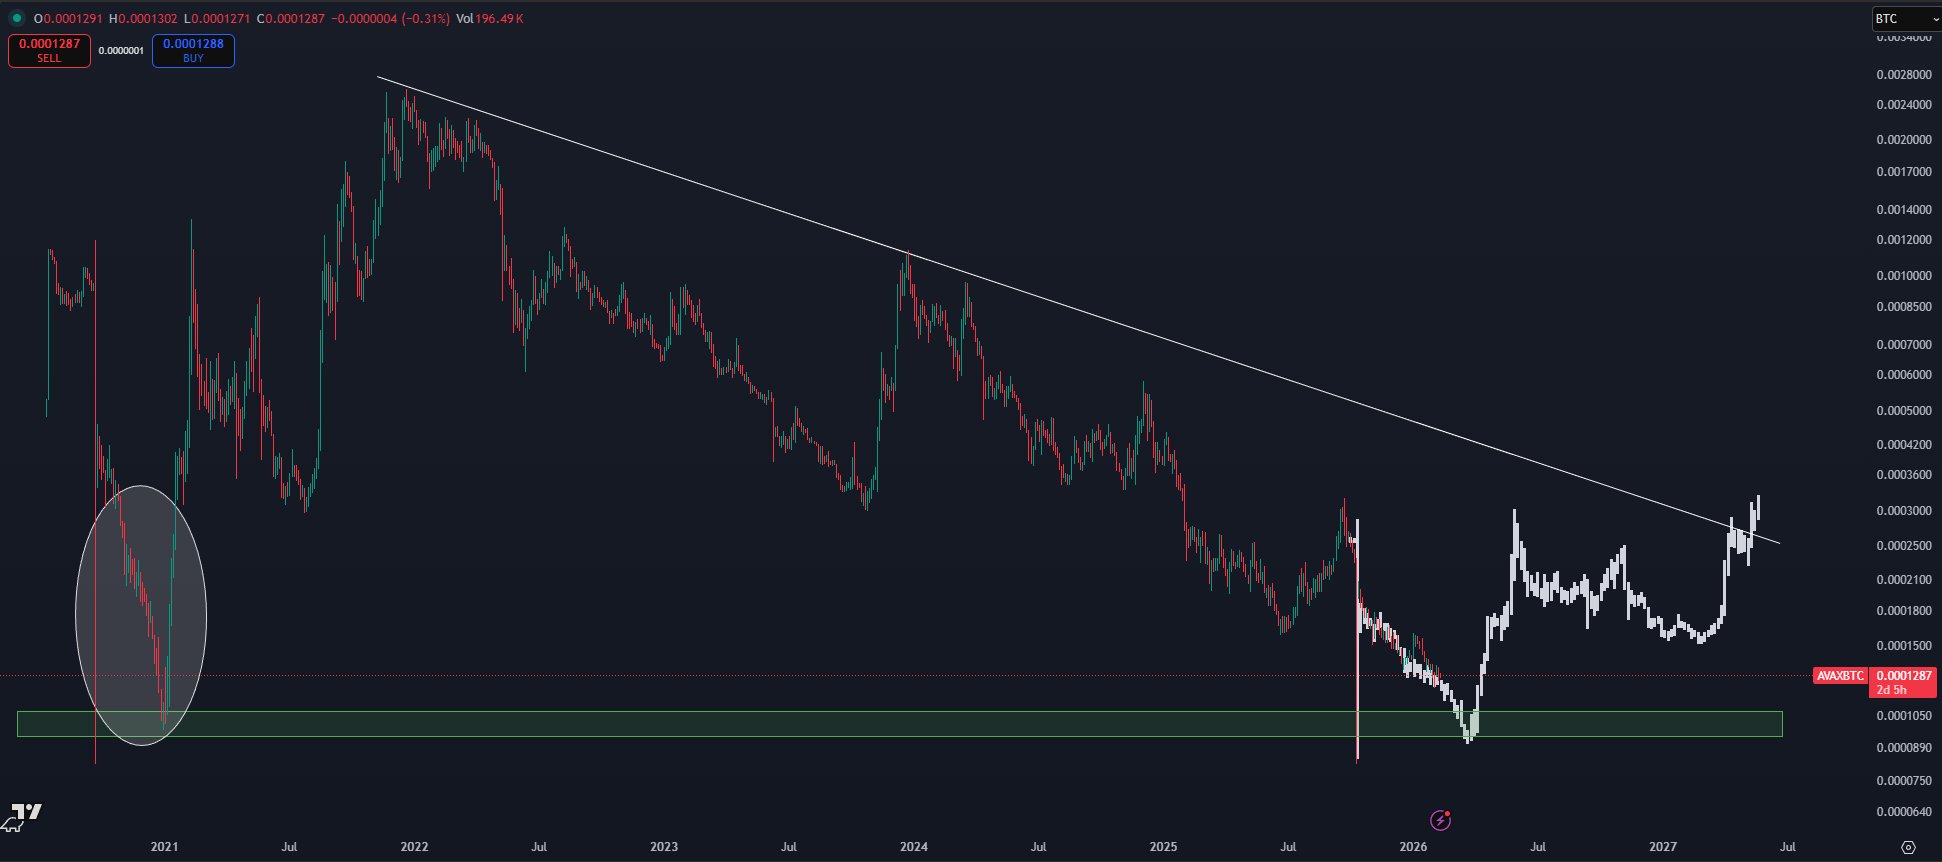
Avalanche (AVAX) Fractal Setup/Credits: @CryptoKaleo (X)
On today’s chart, we’re seeing a nearly identical structure developing.
AVAX/BTC has been trending beneath a long-term descending resistance line while slowly compressing into higher-timeframe demand. After weeks of downside pressure, price recently rebounded from a major green support zone — the same type of base that previously preceded AVAX’s breakout.
The visual similarity stands out: a prolonged downtrend, a capitulation move into macro support, followed by early signs of recovery — all while price remains capped beneath long-term resistance.
Kaleo’s thesis is that AVAX may still experience some chop or minor downside, but if this fractal continues to play out, the pair could establish a higher-timeframe low and begin forming a fresh accumulation range.
What’s Next for AVAX?
If this historical pattern repeats, the current rebound could mark the early stages of a new accumulation phase.
From here, bulls will want to see AVAX continue holding its higher-timeframe demand zone while printing higher lows. A breakout above the descending trendline would be the strongest confirmation that a trend reversal is underway.
Should that happen, AVAX could start outperforming Bitcoin again — similar to what played out during the previous cycle. Analysts are already eyeing a potential move back toward the September 2025 highs near $36, especially if Bitcoin stabilizes and broader altcoin sentiment improves.
Key Risk to Watch
Fractals don’t guarantee outcomes.
If AVAX/BTC fails to hold its current support and slips back below the demand zone, this bullish setup would be invalidated — likely leading to more sideways or downside action before any meaningful recovery attempt.
For now, however, price is reacting exactly where long-term buyers stepped in last time.
Disclaimer: The views and analysis presented in this article are for informational purposes only and reflect the author’s perspective, not financial advice. Technical patterns and indicators discussed are subject to market volatility and may or may not yield the anticipated results. Investors are advised to exercise caution, conduct independent research, and make decisions aligned with their individual risk tolerance.
About Author: Nilesh Hembade is the Founder and Lead Author of Coinsprobe, with over 5 years of experience in the cryptocurrency and blockchain industry. Since launching Coinsprobe in 2023, he has been providing daily, research-driven insights through in-depth market analysis, on-chain data, and technical research.
Related Articles
Bitcoin is increasingly linked to the macroeconomic cycle after adjusting for US employment data.
Data: If BTC breaks through $70,941, the total liquidation strength of mainstream CEX short positions will reach $918 million.
When the "Old Map" No Longer Applies: A Review of 8 "Failing Classic Cryptocurrency Indicators"