Ethereum Whales Underwater—Is This the ETH Price Capitulation or a Calm Before a Strong Rebound? - BTC Hunts
 The post Ethereum Whales Underwater—Is This the ETH Price Capitulation or a Calm Before a Strong Rebound? appeared first on Coinpedia Fintech News
After breaking above the local consolidation range near $1,950, the Ethereum price has pushed higher toward the psychological $2,000 level. ETH is trading around $1,988, up roughly 1.1% in the past 24 hours, slightly outperforming Bitcoin’s sub-1% move. The uptick appears to reflect a mild risk-on rotation into altcoins rather than any clear fundamental catalyst.
However, beneath the surface, on-chain data paints a more cautious picture. Despite the bounce, major ETH whale cohorts remain underwater on unrealized profits. If even large holders are still under pressure, the key question becomes whether this rally has real strength, or if Ethereum has yet to print its true cycle bottom.
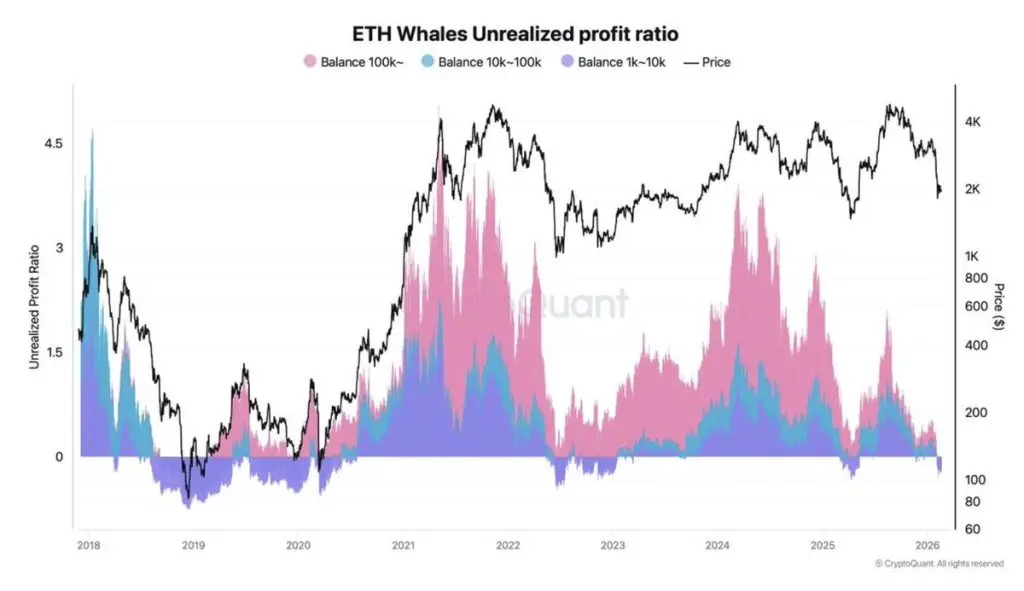
All Ethereum Whale Cohorts Turn Underwater: A Cycle Reset Moment?
The chart tracking Ethereum whales’ unrealized profit ratio reveals a critical shift in market structure. For the first time this cycle, every major ETH holder group, from 1K–10K wallets to 100K+ ETH addresses, has entered unrealized losses. Historically, large cohorts tend to stay profitable during corrections, providing long-term support to the Ethereum price. But the current drawdown has pushed even the strongest hands below breakeven.
 Source: X
This development signals broad market stress rather than a simple retail shakeout. When whale wallets turn underwater, it often reflects deep capitulation conditions and late-stage cycle pressure. In previous cycles, similar resets have preceded major trend reversals, but only after volatility peaks and selling exhausts.
Source: X
This development signals broad market stress rather than a simple retail shakeout. When whale wallets turn underwater, it often reflects deep capitulation conditions and late-stage cycle pressure. In previous cycles, similar resets have preceded major trend reversals, but only after volatility peaks and selling exhausts.
If Ethereum stabilises near current levels and whales resume accumulating, this zone could evolve into a long-term bottom. However, sustained weakness may prolong consolidation before a meaningful recovery unfolds.
Ethereum Price Analysis: Key Levels to Watch as Volatility Compresses
On the daily chart, Ethereum remains under pressure after breaking decisively below the $2,750–$2,800 demand zone, confirming a major structure breakdown. Price is now consolidating around $1,990, just below the 20-day SMA near $2,038, while the upper Bollinger Band sits around $2,260 — highlighting strong overhead resistance.
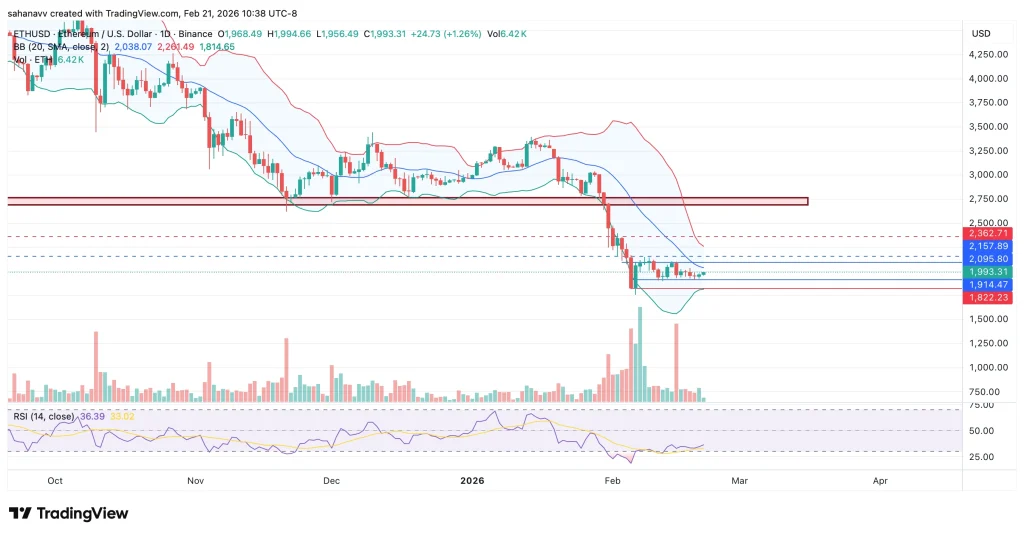
RSI is hovering near 36, recovering from oversold territory but still below the 50 midline — signaling weak bullish momentum. For bulls to regain control, ETH must reclaim $2,095 first, followed by a stronger breakout above $2,157. A sustained move above $2,260 would invalidate the immediate bearish bias and shift targets toward $2,360.
Until $2,157–$2,260 is reclaimed decisively, rallies are likely corrective rather than trend-reversing.
Related Articles
Mysterious Offshore Entity Takes $436M Position in Blackrock’s Bitcoin ETF
The value of Strategy assets is approximately six times the liabilities, with cash reserves sufficient to pay dividends for over 30 months.