Trade
Basic
Futures
Futures
Hundreds of contracts settled in USDT or BTC
TradFi
Gold
Trade global traditional assets with USDT in one place
Options
Hot
Trade European-style vanilla options
Unified Account
Maximize your capital efficiency
Demo Trading
Futures Kickoff
Get prepared for your futures trading
Futures Events
Participate in events to win generous rewards
Demo Trading
Use virtual funds to experience risk-free trading
Earn
Launch
CandyDrop
Collect candies to earn airdrops
Launchpool
Quick staking, earn potential new tokens
HODLer Airdrop
Hold GT and get massive airdrops for free
Launchpad
Be early to the next big token project
Alpha Points
Trade on-chain assets and enjoy airdrop rewards!
Futures Points
Earn futures points and claim airdrop rewards
Investment
Simple Earn
Earn interests with idle tokens
Auto-Invest
Auto-invest on a regular basis
Dual Investment
Buy low and sell high to take profits from price fluctuations
Soft Staking
Earn rewards with flexible staking
Crypto Loan
0 Fees
Pledge one crypto to borrow another
Lending Center
One-stop lending hub
VIP Wealth Hub
Customized wealth management empowers your assets growth
Private Wealth Management
Customized asset management to grow your digital assets
Quant Fund
Top asset management team helps you profit without hassle
Staking
Stake cryptos to earn in PoS products
Smart Leverage
New
No forced liquidation before maturity, worry-free leveraged gains
GUSD Minting
Use USDT/USDC to mint GUSD for treasury-level yields
More
thecurrencyanalytics
qONE Launches Pre-Sale with NIST-Approved Quantum Protection - #mit #nist #pdg
View Original
- Reward
- like
- Comment
- Repost
- Share
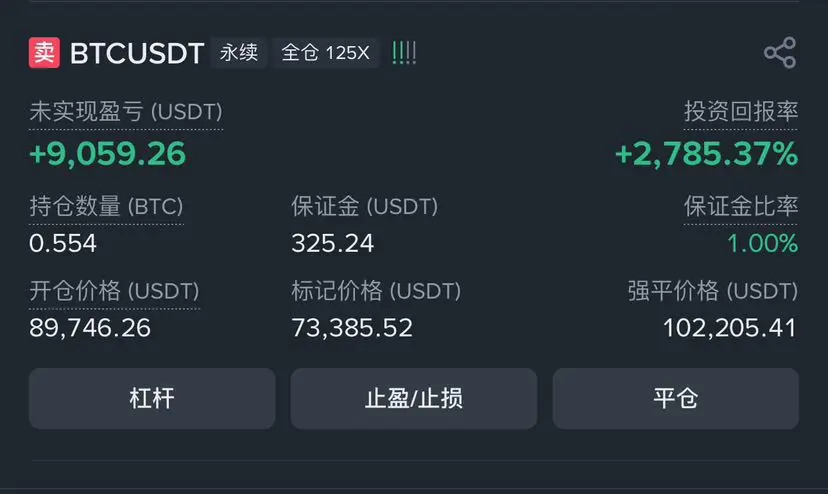
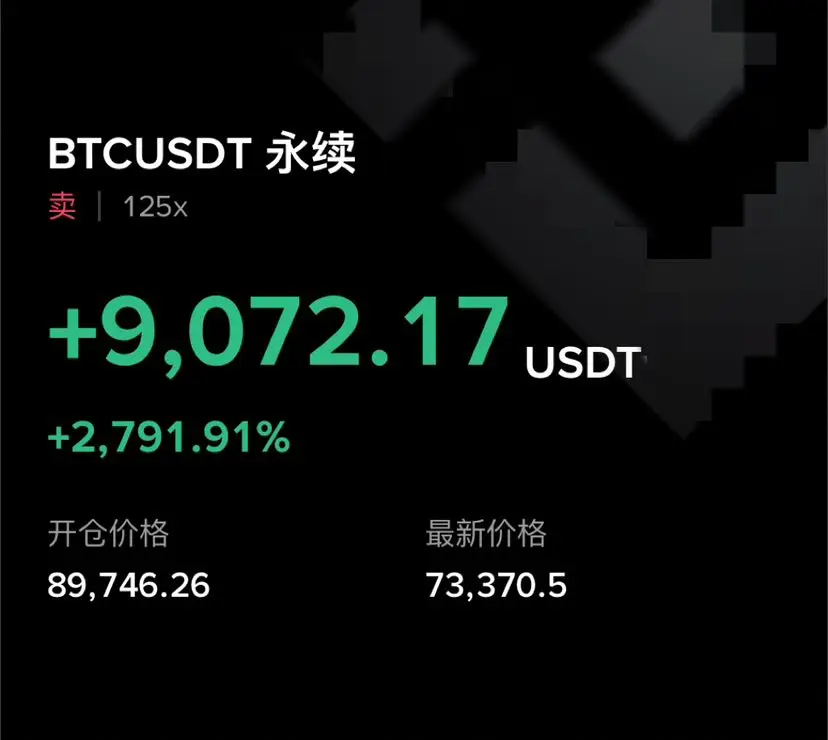
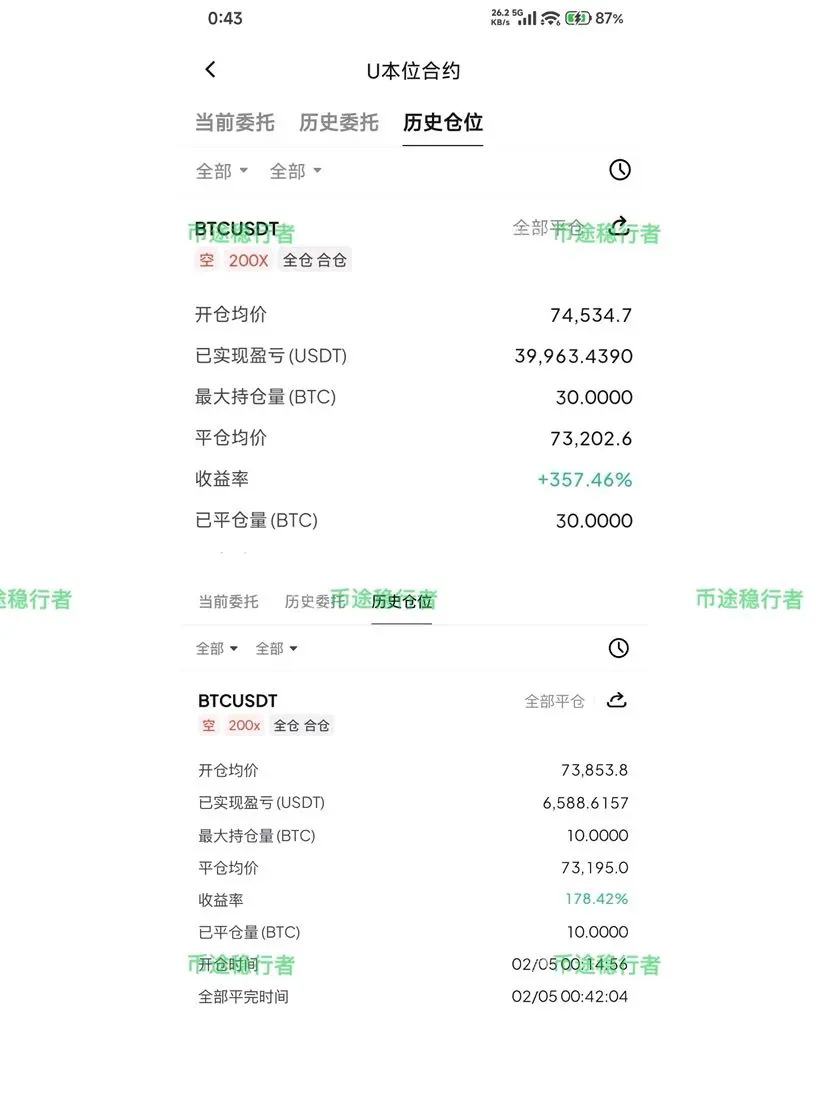
This round of long-term short positions has gained over 10,000 points and is almost closed for profit. Our team, following my trades, has prepared two accounts:
1. Long-term contract account (70% position)
2. Short-term contract account (30% position)
Stay tuned for real-time signals and execute immediately!!
View Original1. Long-term contract account (70% position)
2. Short-term contract account (30% position)
Stay tuned for real-time signals and execute immediately!!
- Reward
- 4
- Comment
- Repost
- Share
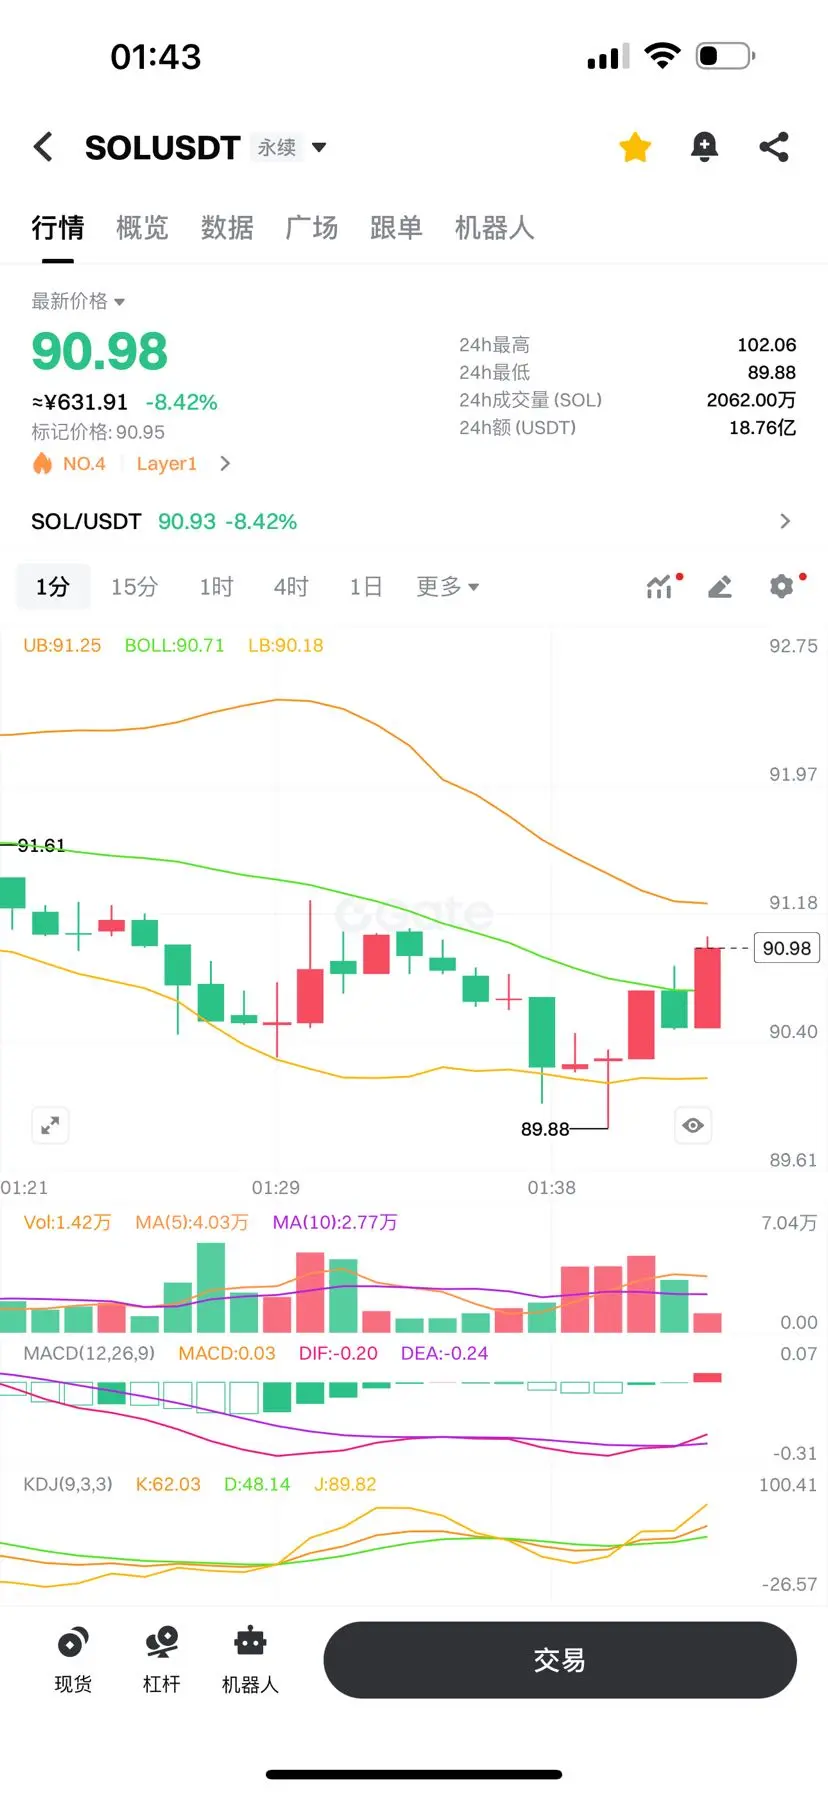
Subscribe to updates: Around sol89.4, those who entered are already making some profit. Currently reducing positions and playing a game.
View Original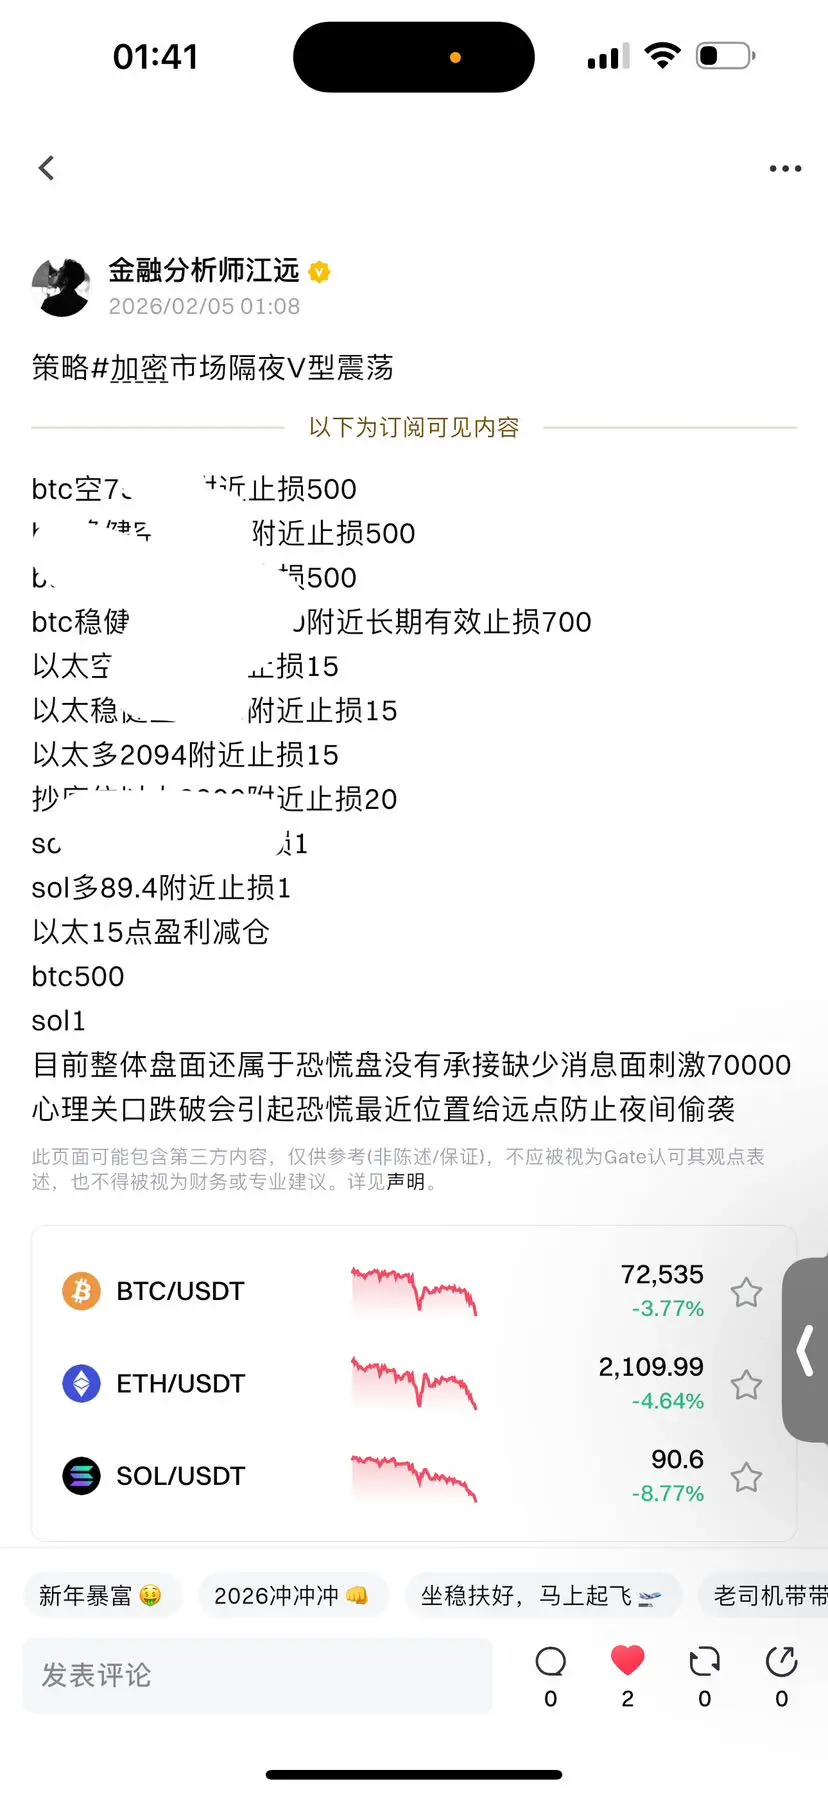
- Reward
- 3
- 1
- Repost
- Share
金融分析师江远 :
:
1点XAGUSD
XAGUSD
Created By@High-FrequencyHedging
Listing Progress
0.00%
MC:
$2.66K
Create My Token
Everything is playing out just great! Juicy generational buys coming either end of this quarter or next imoStaying patient and milking this downsideHave my posts helped you prepare?
- Reward
- like
- Comment
- Repost
- Share
Technical Analysis Basics: Trend, Support & Resistance
120
- Reward
- like
- Comment
- Repost
- Share

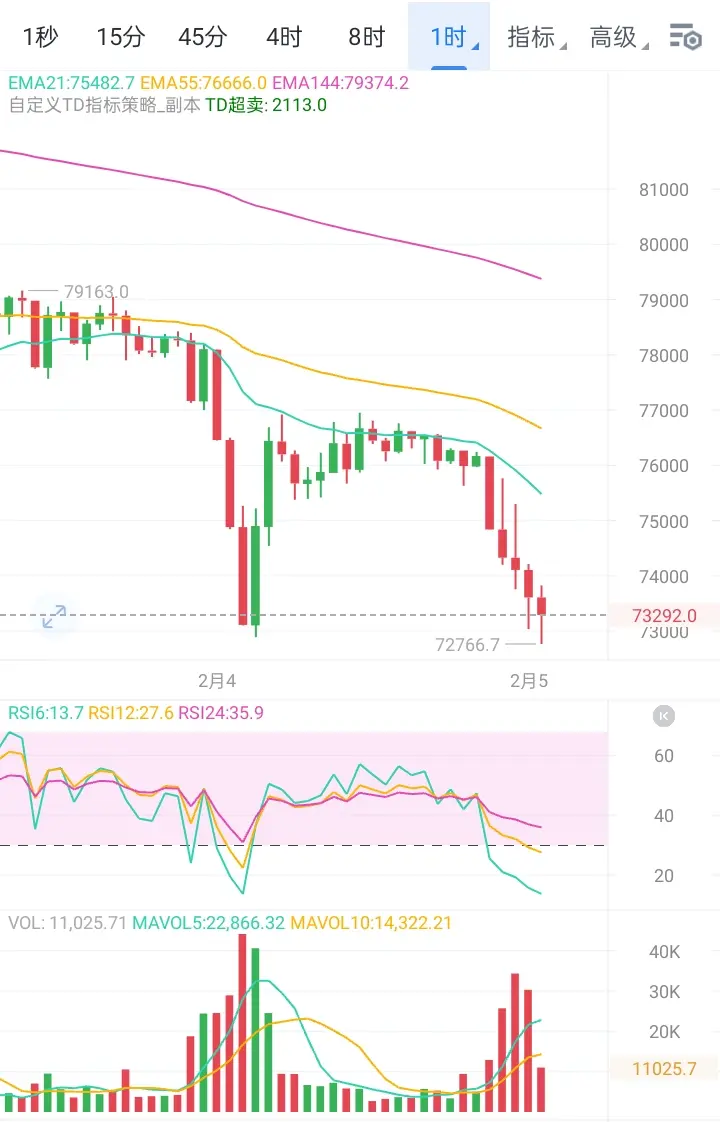
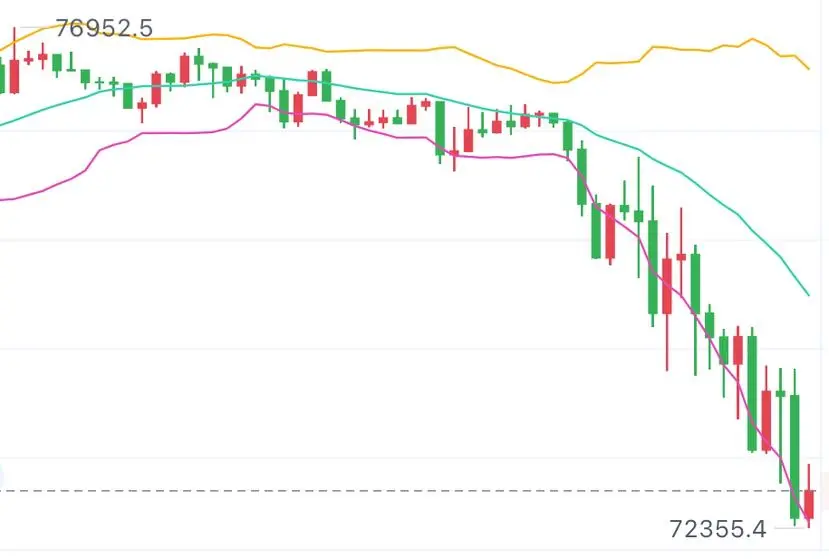
Bitcoin continued to decline after breaking below the key support level of 76,000 yesterday, currently oscillating weakly around 73,300. From a structural perspective, an effective breakdown has been formed on the daily chart, with the price falling below the MA30 moving average, indicating a disruption of the medium-term upward trend. The 4-hour chart shows a stepwise decline with higher highs gradually shifting downward, coupled with MACD increasing below the zero line, indicating that bearish momentum still dominates.
Key resistance is focused on the 74,000-74,500 area, which was previously
Key resistance is focused on the 74,000-74,500 area, which was previously
BTC0,53%
- Reward
- like
- Comment
- Repost
- Share
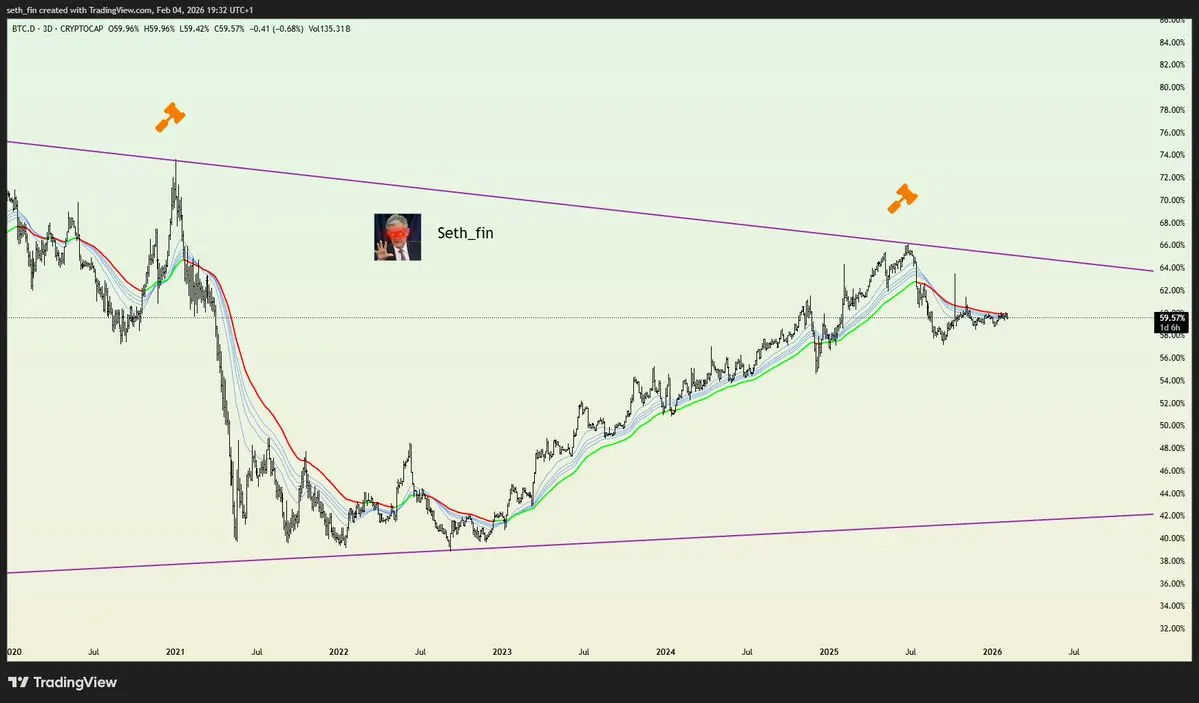
$BTC.D can\'t reclaim the MAs. What do you think this means for #Altcoins if BTC dominance fall here?
BTC0,53%
- Reward
- like
- Comment
- Repost
- Share
Thursday, February 5, 2026
【Strategy Review】
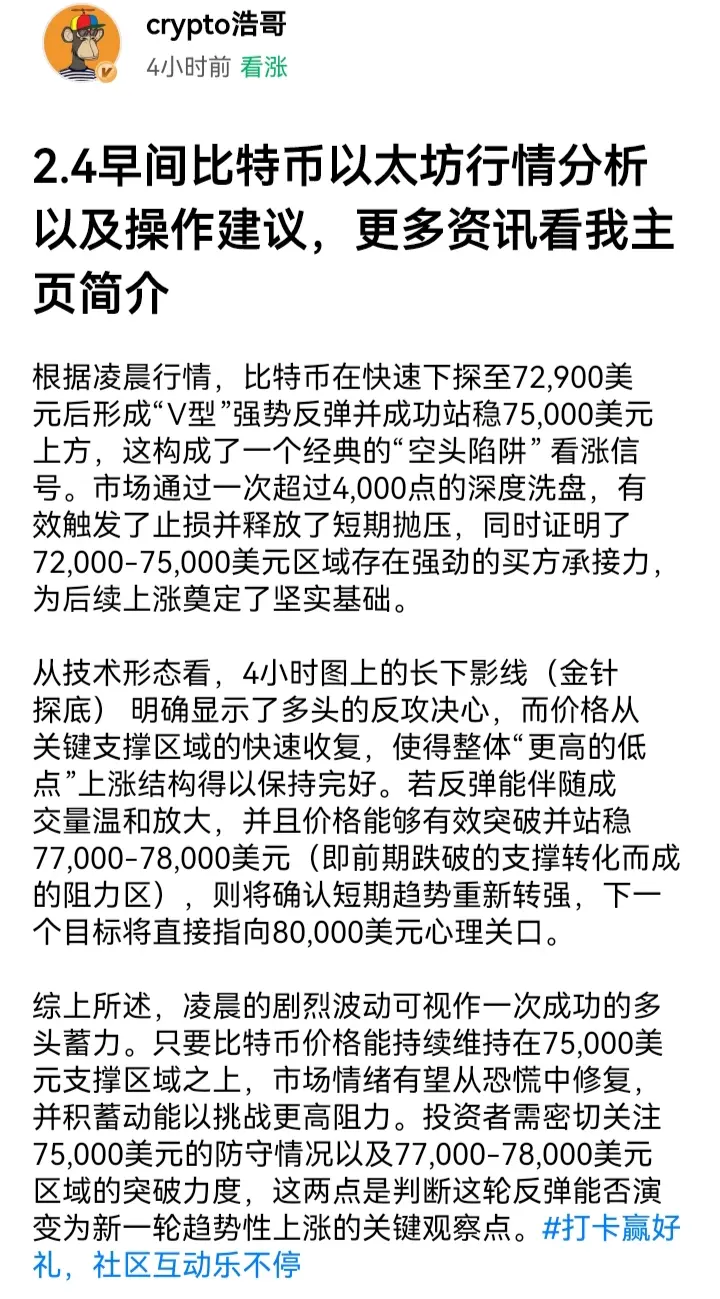
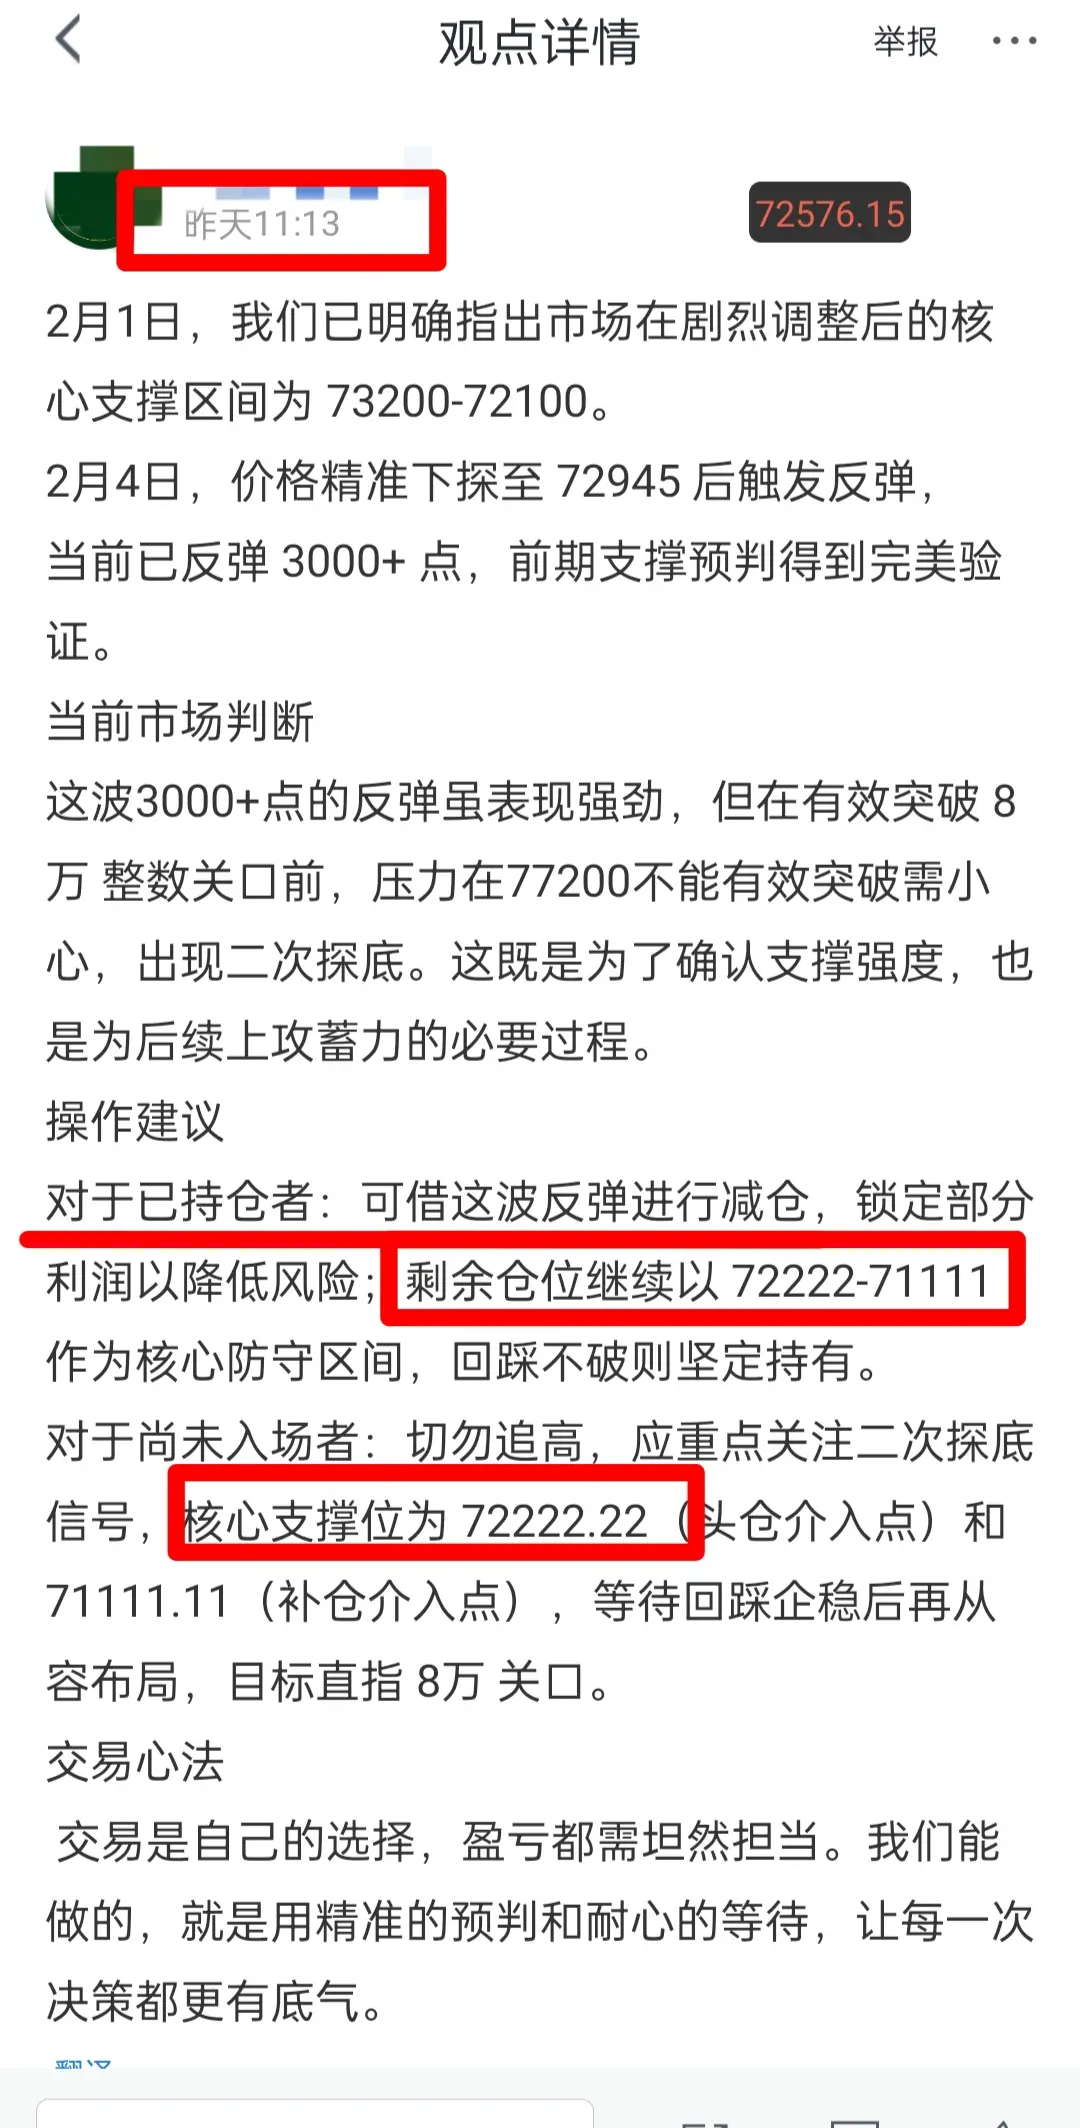
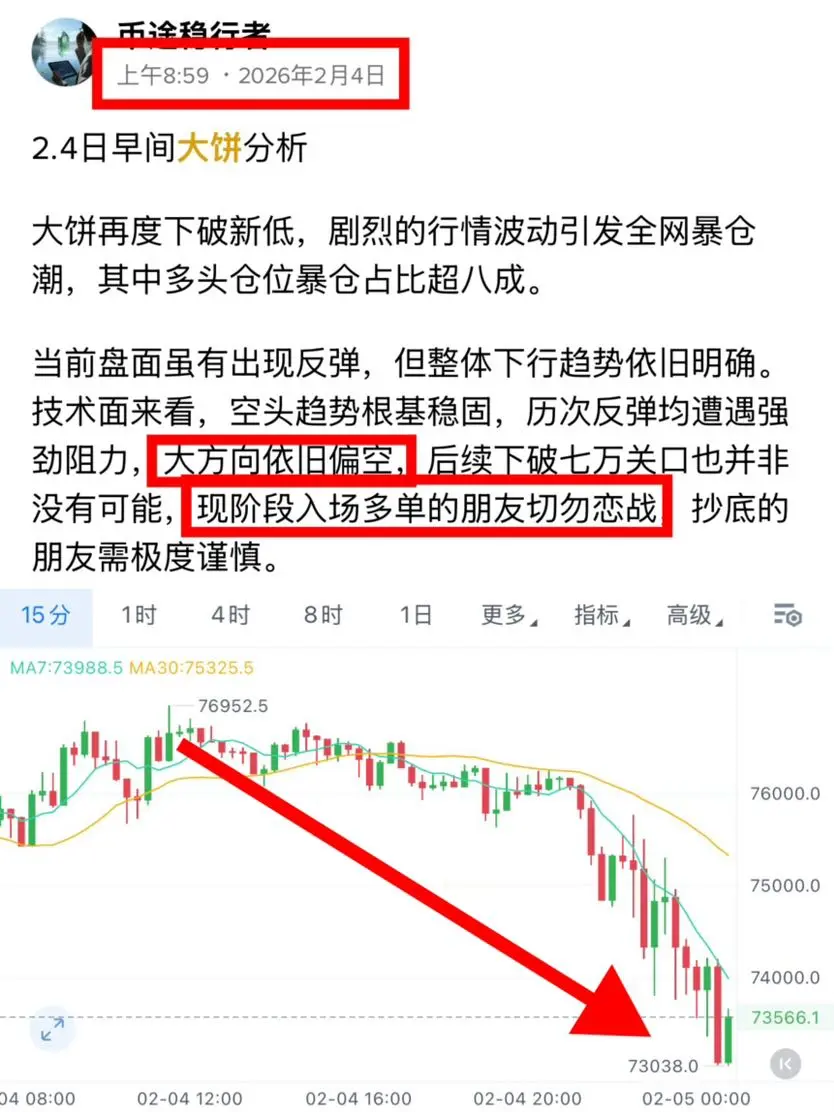
In the strategy released on the morning of February 4 (Figure 1), we clearly identified the core support range as 72222-71111, with 72222.22 set as the key defensive position and initial entry point for the main position. The current market has precisely retested this support level (Figure 2), confirming our previous market structure judgment.
【Market Interpretation】
This second bottom test not only effectively confirms the strength of the previous support but also serves as a necessary step to build momentum for subsequent upward movement. The pric
View Original【Strategy Review】
In the strategy released on the morning of February 4 (Figure 1), we clearly identified the core support range as 72222-71111, with 72222.22 set as the key defensive position and initial entry point for the main position. The current market has precisely retested this support level (Figure 2), confirming our previous market structure judgment.
【Market Interpretation】
This second bottom test not only effectively confirms the strength of the previous support but also serves as a necessary step to build momentum for subsequent upward movement. The pric
- Reward
- 1
- Comment
- Repost
- Share
qu
去他妈的
Created By@JustEatABit.
Listing Progress
0.00%
MC:
$0.1
Create My Token
Short-term shorting feels good, continuously shorting feels good, Bitcoin has retraced back to 4600 points, and there’s nearly 200 points of room for the auntie as well. Every day presents a one-to-one script, is there anyone still long? $BTC $ETH #加密市场隔夜V型震荡
View Original
- Reward
- like
- Comment
- Repost
- Share
- Reward
- 1
- Comment
- Repost
- Share
Gate Indices section futures has now launched US2000, TW88, AUS200, VIX and HSCHKD. Trade to earn instant rewards, meet trading targets to share additional prizes, and enjoy exclusive welcome bonuses for new users. Both new and existing users are invited to participate and share a 200,000 USDT reward pool. https://www.gate.com/campaigns/4015?ref=UgMXU15Z&ref_type=132
- Reward
- 5
- 6
- Repost
- Share
VelvetSky:
Happy New Year! 🤑View More

The older generation's books really teach you something! The content is very nice!!
View Original
- Reward
- like
- Comment
- Repost
- Share
In this short position operation of the current layout,
the 1300-point and 600-point levels form a significant gap.
Under the same signal, the divergence in results is just like in life's racecourse, where starting at the same point yields different outcomes.
$BTC $GT $ETH
#加密市场观察 #加密市场隔夜V型震荡 #BTC何时反弹?
View Originalthe 1300-point and 600-point levels form a significant gap.
Under the same signal, the divergence in results is just like in life's racecourse, where starting at the same point yields different outcomes.
$BTC $GT $ETH
#加密市场观察 #加密市场隔夜V型震荡 #BTC何时反弹?
- Reward
- 1
- Comment
- Repost
- Share
Bitcoin Analysis: Why the Bottom Might Already Be Here?
0
- Reward
- like
- Comment
- Repost
- Share


- Reward
- like
- Comment
- Repost
- Share
Load More
Join 40M users in our growing community
⚡️ Join 40M users in the crypto craze discussion
💬 Engage with your favorite top creators
👍 See what interests you
Trending Topics
View More18.53K Popularity
11.43K Popularity
10.98K Popularity
3.59K Popularity
6.65K Popularity
Hot Gate Fun
View More- MC:$2.6KHolders:00.00%
- MC:$2.62KHolders:10.00%
- MC:$0.1Holders:10.00%
- MC:$0.1Holders:10.00%
- MC:$0.1Holders:00.00%
News
View MoreBTC Breaks Through 74,000 USDT
23 m
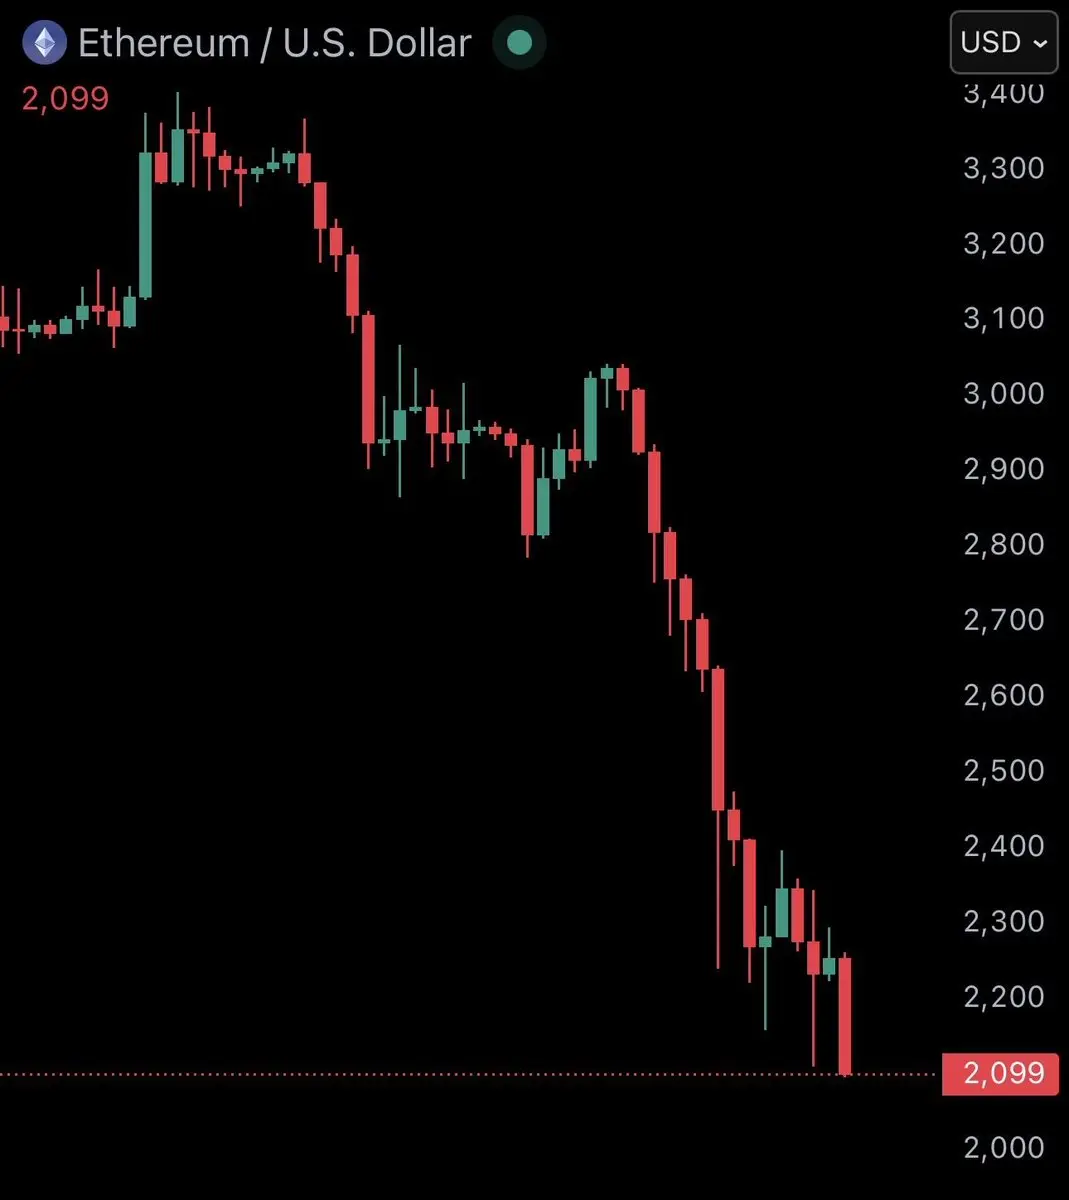
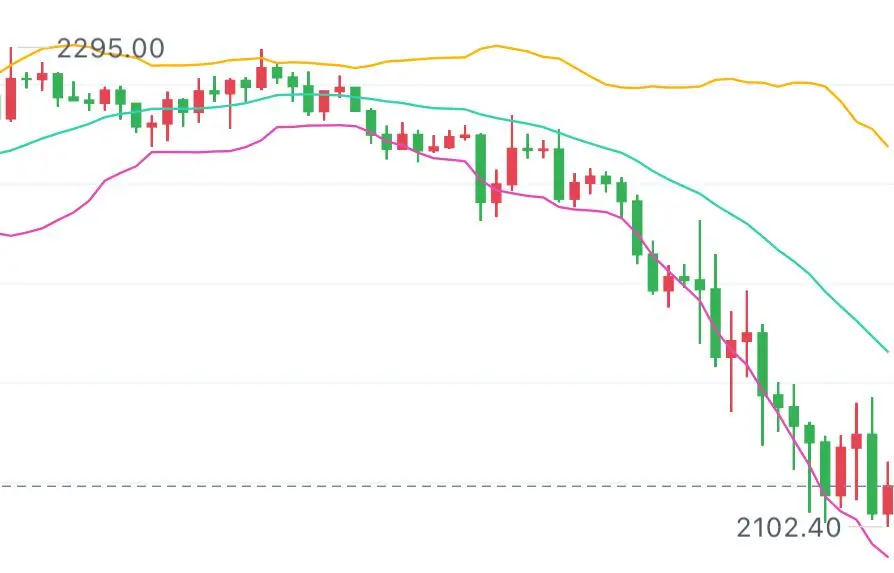
ETH Breaks Through 2150 USDT
29 m
CME Group CEO reveals plans to launch "CME Coin" to expand digital currency offerings and enhance trading options in the cryptocurrency market.
30 m
Data: If ETH breaks through $2,235, the total liquidation strength of long positions on mainstream CEXs will reach $876 million.
31 m
Data: If BTC breaks through $76,943, the total liquidation strength of mainstream CEX short positions will reach $1.55 billion.
32 m
Pin