Trade
Basic
Futures
Futures
Hundreds of contracts settled in USDT or BTC
Options
HOT
Trade European-style vanilla options
Unified Account
Maximize your capital efficiency
Demo Trading
Futures Kickoff
Get prepared for your futures trading
Futures Events
Futures Mall
Participate in events to win generous rewards
Demo Trading
Use virtual funds to experience risk-free trading
Earn
Launch
CandyDrop
Collect candies to earn airdrops
Launchpool
Quick staking, earn potential new tokens
HODLer Airdrop
Hold GT and get massive airdrops for free
Launchpad
Be early to the next big token project
Alpha Points
NEW
Trade on-chain assets and enjoy airdrop rewards!
Futures Points
NEW
Earn futures points and claim airdrop rewards
Investment
Simple Earn
Earn interests with idle tokens
Auto-Invest
Auto-invest on a regular basis
Dual Investment
Buy low and sell high to take profits from price fluctuations
Soft Staking
Earn rewards with flexible staking
Crypto Loan
0 Fees
Pledge one crypto to borrow another
Lending Center
One-stop lending hub
VIP Wealth Hub
Customized wealth management empowers your assets growth
Private Wealth Management
Customized asset management to grow your digital assets
Quant Fund
Top asset management team helps you profit without hassle
Staking
Stake cryptos to earn in PoS products
Smart Leverage
NEW
No forced liquidation before maturity, worry-free leveraged gains
GUSD Minting
Use USDT/USDC to mint GUSD for treasury-level yields
More
CEO
BULLISH: 🇺🇸 President Trump confirms more Bitcoin will be added to the United States strategic reserve “soon”
BTC0,18%


- Reward
- 1
- 1
- Repost
- Share
Crypto_Crown:
2026 GOGOGO 👊🎓 Streamer Training · Starts Today!
Learn step-by-step how to improve your streaming skills and grow faster as a GateLive streamer!
💡 Topic: Boost Follower Retention & Optimize Live Room Ranking Easily
⏰ Time: Jan 23, 2026, 12:00 (UTC)
What you’ll learn:
✅ Key factors that influence follower retention
✅ Details on live room refresh and ranking logic
✅ How to pinpoint user pain points and increase viewer stay time
Join the Space: https://gate.com/post?post_id=18346112&tim=IAAAACUGRlZRWwYhGxAdA19cWxgEDhkO0O0O&ref=BFVCUVEN&ref_type=105 (Please open in the Gate APP)
If you can’t access it, try

- Reward
- 8
- 11
- Repost
- Share
kblyfb1907 :
:
2026 GOGOGO 👊View More
Not drinking on Friday means walking life's path in vain
View Original

- Reward
- like
- Comment
- Repost
- Share
孔子
孔子
Created By@PiggyFromTheOcean
Listing Progress
100.00%
MC:
$27.23K
Create My Token
#GateWeb3UpgradestoGateDEX
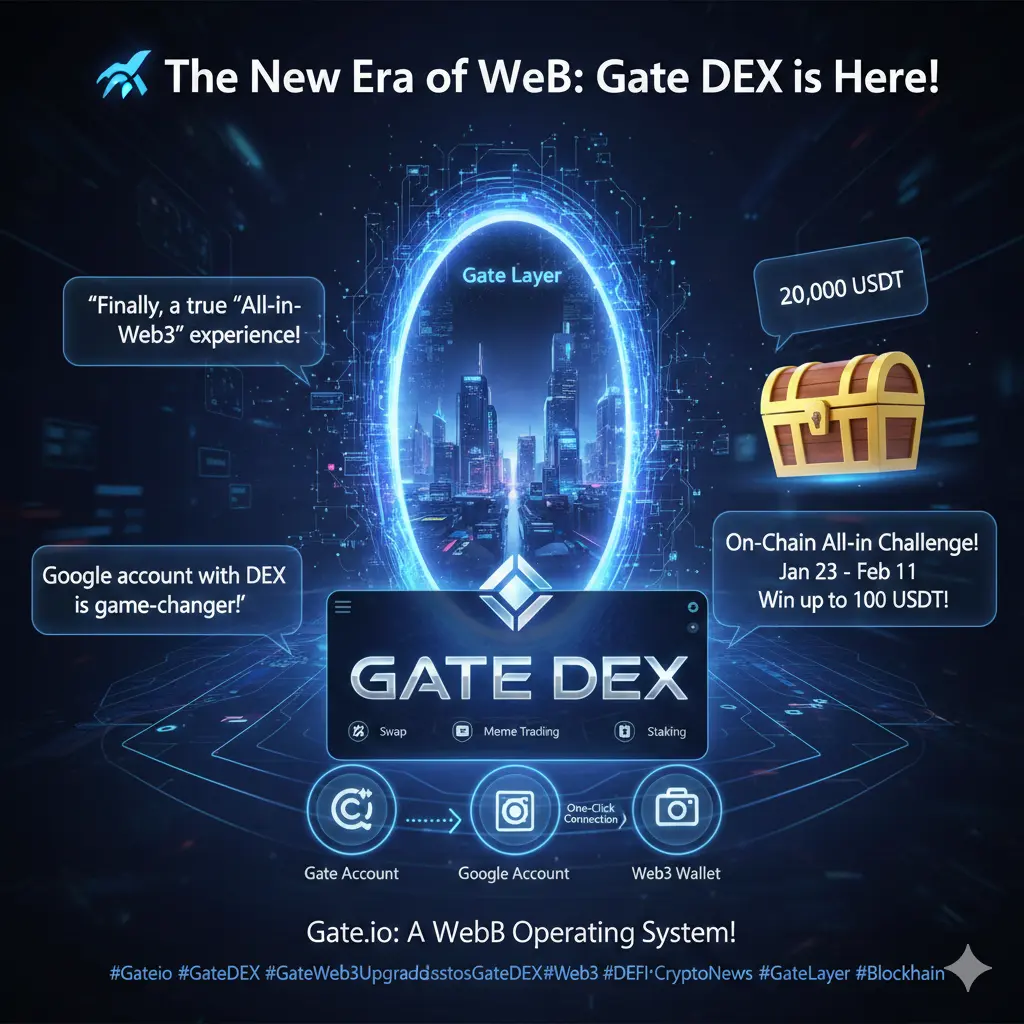
The New Era of Web3: Gate DEX is Here!
Gate.io is redrawing the boundaries of decentralized trading! Gate Web3 has officially evolved into Gate DEX—now more powerful, faster, and more comprehensive than ever. This is far more than just a rebrand; it’s a giant leap toward the future of Decentralized Finance (DeFi)!
Why Gate DEX? (Key Highlights)
One-Click Connection: Say goodbye to complex wallet setups! Log in instantly using your Gate account, Google account, or your existing Web3 wallet.
CEX Speed on a DEX Experience: Enjoy the security of decentralizatio
- Reward
- 10
- 14
- Repost
- Share
Peacefulheart:
HODL Tight 💪View More
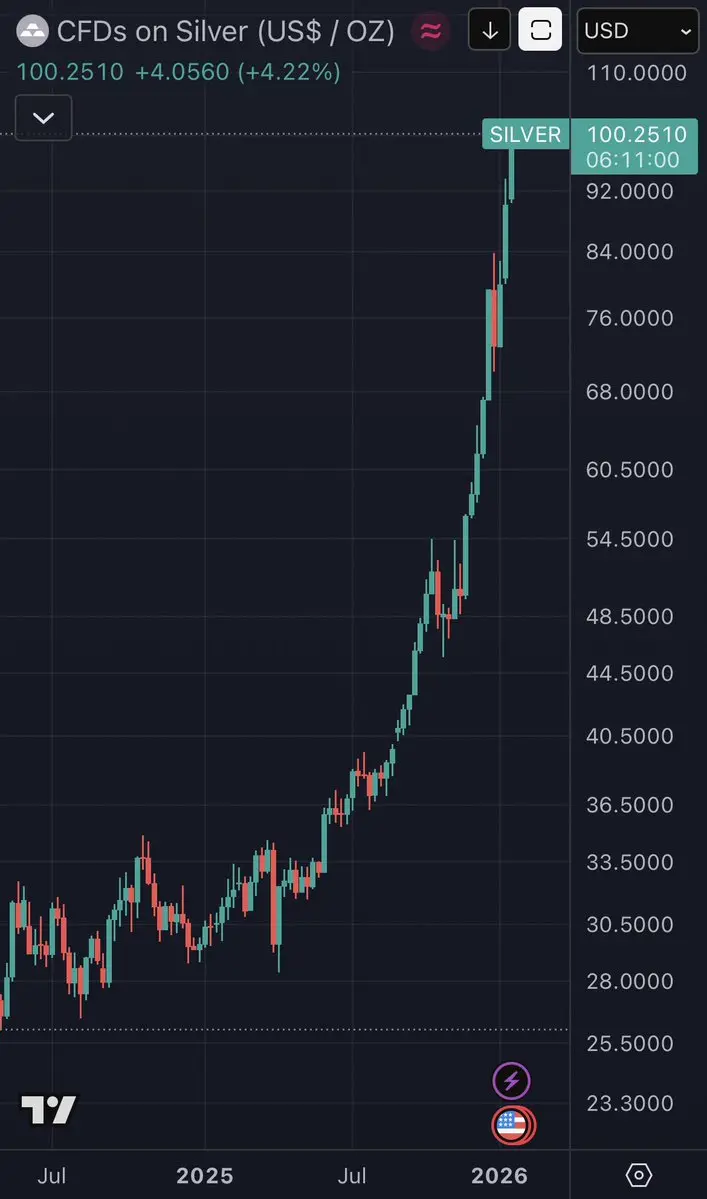
🚨 SPOT SILVER BREAKS $100/OZ FOR THE FIRST TIME IN HISTORY PRECIOUS METALS BULL MARKET 🔥

- Reward
- like
- Comment
- Repost
- Share
[Market Predicition]🔹 A mysterious whale keeps accumulating, pushing Ethereum holdings past 80,000 ETH — confidence still intact?
1.277
- Reward
- 3
- Comment
- Repost
- Share
- Reward
- like
- 1
- Repost
- Share
GateUser-918a81a4 :
:
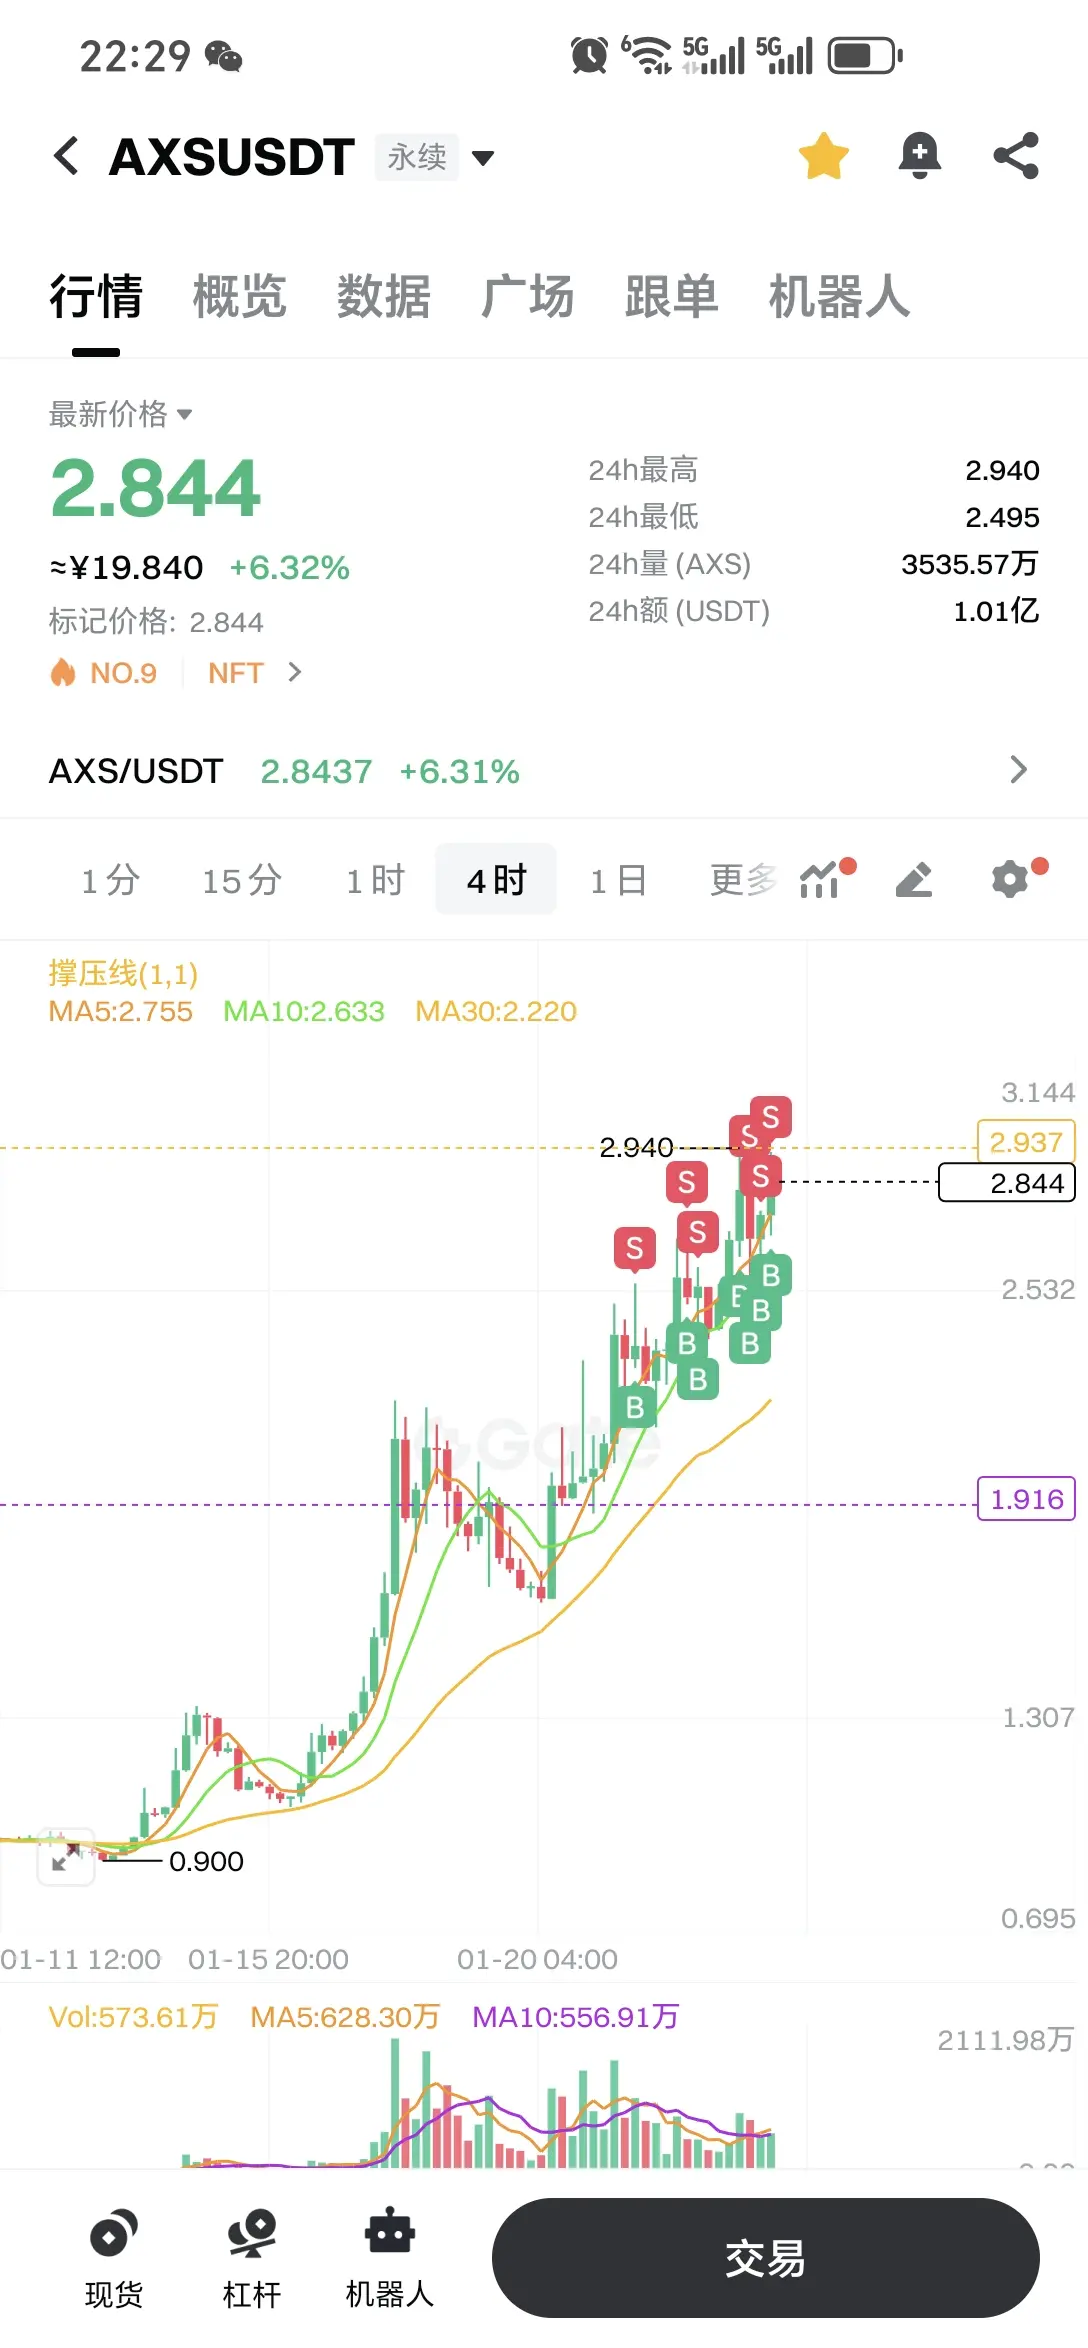
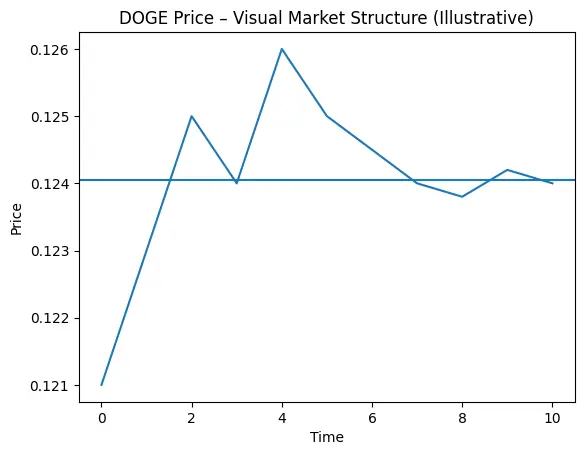
It's been a long time since I've seen such neat and orderly chart patterns, and the pullbacks are textbook perfect. Every new contract beginner should be learning on such high-quality assets now!- Today’s Chart: Bitcoin Trading Under Pressure:
Bitcoin’s price continues to decline toward the $89,000 level, with indicators still showing bearish signals. The Relative Strength Index (RSI) at 42 on the daily chart indicates a downward trend, suggesting that Bitcoin’s technical structure may continue to weaken.
The Moving Average Convergence Divergence (MACD) remains below the signal line on the same chart, prompting investors to reduce their market exposure. The bearish momentum may intensify, with the MACD histogram expanding below the zero line.
However, the support level at $89,000 rema
BTC0,18%
- Reward
- 1
- 1
- Repost
- Share
Before00zero:
Bitcoin price is still below $90,000, affected by weak technical structure as both the MACD and RSI indicators have declined.#蓝V互关 # About Must-Return #MutualFollow Blue V Mutual Follow is trending again. Recently, many friends have been focusing on this benefit to see if they can boost their Blue V follower count further. According to platform rules: 1⃣ If more than 2,500 subscribed Premium Blue V accounts follow you → You can enjoy all Premium benefits for free 2⃣ If more than 5,000 Blue V accounts follow you → Enjoy Premium+ for free Follow me, I will definitely follow back. Just leave a comment in the comment section.
View Original
- Reward
- like
- Comment
- Repost
- Share
Check out Gate and join me in the hottest event! https://www.gate.com/campaigns/3881?ref=VLIWBLOKUW&ref_type=132&utm_cmp=TpIkMKPZ
- Reward
- 3
- 5
- Repost
- Share
Thynk:
Watching Closely 🔍️View More

- Reward
- 1
- Comment
- Repost
- Share
Fuck it $PENGUIN mode

- Reward
- like
- Comment
- Repost
- Share
$DOGE Price is moving around 0.124, and the chart shows DOGE taking a small pause after recent selling pressure. This looks more like consolidation than panic.
What the chart is saying 👇
Short timeframe (1H):
Price is near the lower Bollinger Band. RSI is below 30 → short-term oversold. A small bounce is possible if buyers step in.
Mid timeframe (4H):
Trend is still weak, but momentum loss is slowing. If DOGE holds above the recent low zone, sideways movement or a slow recovery can happen.
Indicators check:
RSI: Cooling down, not overheated
MACD: Flat and close to zero → no strong trend yet
DOGE-0,28%
- Reward
- like
- Comment
- Repost
- Share
抬起你的蛋蛋,把屁股掰开
抬起你的蛋蛋,把屁股掰开
Created By@XiaoliangIsGoingToSu
Listing Progress
0.00%
MC:
$3.38K
Create My Token
Gate 2025 Year-End Summary is here! See how I performed this year.
Click the link to view the exclusive summary #2025GateYearEndSummary and claim the 20 USDT Position Voucher. https://www.gate.com/id/competition/your-year-in-review-2025?ref=VQVAUF1DAW&ref_type=126&shareUid=U1ZAU1BZAAAO0O0O
View OriginalClick the link to view the exclusive summary #2025GateYearEndSummary and claim the 20 USDT Position Voucher. https://www.gate.com/id/competition/your-year-in-review-2025?ref=VQVAUF1DAW&ref_type=126&shareUid=U1ZAU1BZAAAO0O0O

- Reward
- 1
- 1
- Repost
- Share
GateUser-874dfbe6:
gggggggggggggggggggg#晒出我的合约收益 Quantify now, experience the charm of the quantitative robot with me, no risk of liquidation, assets steadily increasing
View Original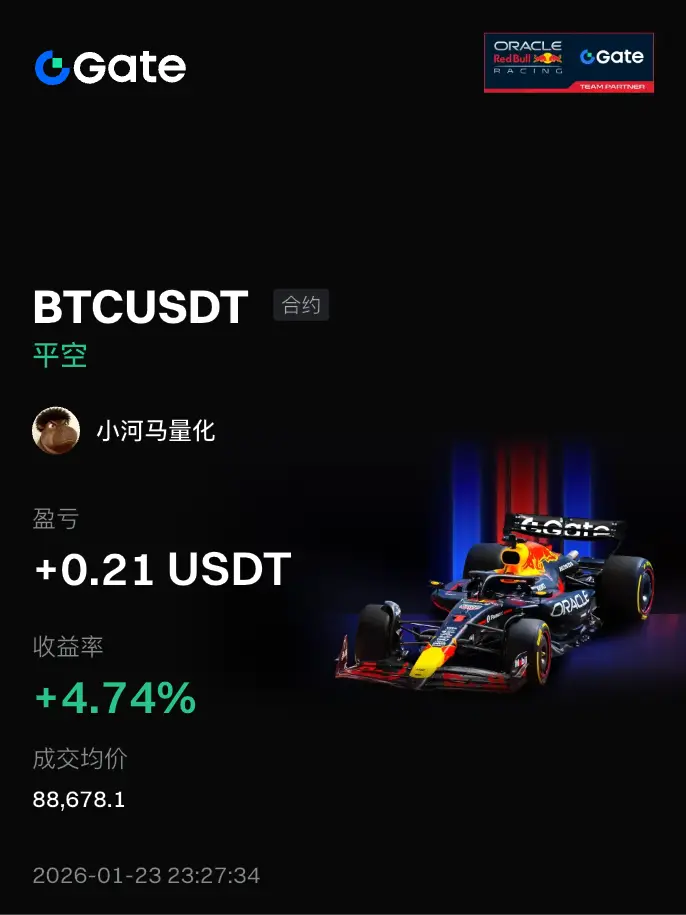
[The user has shared his/her trading data. Go to the App to view more.]
- Reward
- 1
- 2
- Repost
- Share
YangDou888 :
:
How to do itView More
#RIVERUp50xinOneMonth
#RIVERUp50xinOneMonth
☘️🌈Explosive Momentum, Speculative Surge, and the Market Forces Behind RIVER’s Rapid Rise
A One-Month Rally That Captured Market Attention
RIVER’s reported 50x surge within a single month has quickly positioned it among the most talked-about assets in the crypto market. Such rapid price appreciation is rare and immediately draws attention from traders, investors, and analysts alike. Moves of this magnitude often signal a combination of strong narrative momentum, speculative capital inflows, and shifting market psychology, making RIVER a focal poin

- Reward
- 2
- 1
- Repost
- Share
Discovery :
:
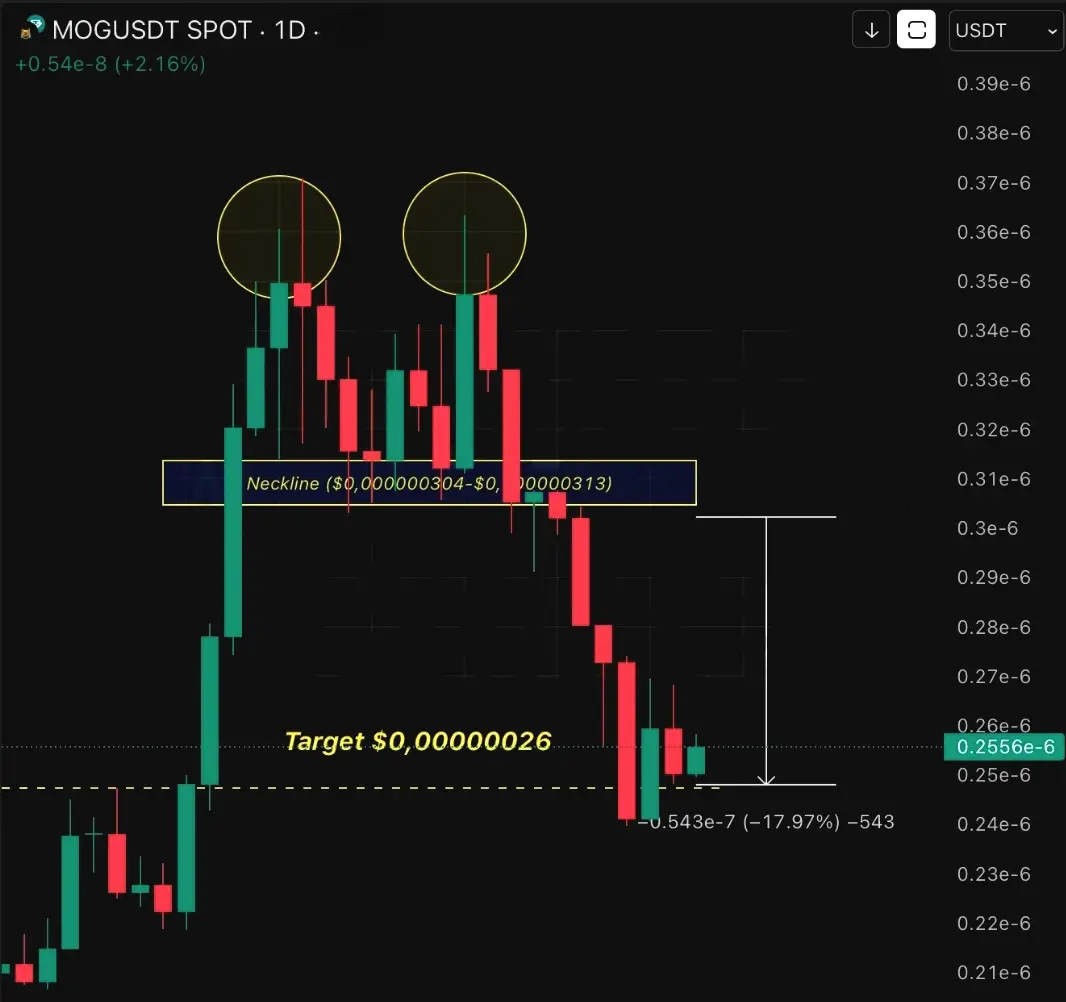
2026 GOGOGO 👊$Mog – Profit +18% ✅📉
6 days ago, we shared a bearish forecast for #MOGUSDT , confirming a double top and a downside target at $0.00000026.
The prediction was spot on, hitting the target and earning a +18% profit 🎯
#TrumpWithdrawsEUTariffThreats
#MOG
$MOG
6 days ago, we shared a bearish forecast for #MOGUSDT , confirming a double top and a downside target at $0.00000026.
The prediction was spot on, hitting the target and earning a +18% profit 🎯
#TrumpWithdrawsEUTariffThreats
#MOG
$MOG
MOG1,23%
- Reward
- 2
- 1
- Repost
- Share
BasheerAlgundubi:
The prediction was completely successful, the goal was achieved, and a profit of +18% 🎯Say Hi, that’s how connections start. It’s that simple ⚡️

- Reward
- like
- Comment
- Repost
- Share
Load More
Join 40M users in our growing community
⚡️ Join 40M users in the crypto craze discussion
💬 Engage with your favorite top creators
👍 See what interests you
Trending Topics
View More27.38K Popularity
11.16K Popularity
7.14K Popularity
2.43K Popularity
4.42K Popularity
Hot Gate Fun
View More- MC:$3.4KHolders:10.00%
- MC:$3.4KHolders:10.00%
- MC:$3.4KHolders:10.00%
- MC:$0.1Holders:10.00%
- MC:$3.42KHolders:20.10%
News
View MoreETH Breaks Through 2950 USDT
14 m
Trump's second son: The USD1 scale has surpassed PayPal's stablecoin PYUSD
20 m
Silver Reaches Historic $100 All-Time High
20 m
Analysis: Trump's renewed attack on the Federal Reserve prompted the market to seek safe-haven assets, pushing silver prices above $100 per ounce.
30 m
In the past 24 hours, the total contract liquidation across the entire network reached $151 million, with both longs and shorts being liquidated.
31 m
Pin