Trade
Basic
Futures
Futures
Hundreds of contracts settled in USDT or BTC
TradFi
Gold
Trade global traditional assets with USDT in one place
Options
Hot
Trade European-style vanilla options
Unified Account
Maximize your capital efficiency
Demo Trading
Futures Kickoff
Get prepared for your futures trading
Futures Events
Participate in events to win generous rewards
Demo Trading
Use virtual funds to experience risk-free trading
Earn
Launch
CandyDrop
Collect candies to earn airdrops
Launchpool
Quick staking, earn potential new tokens
HODLer Airdrop
Hold GT and get massive airdrops for free
Launchpad
Be early to the next big token project
Alpha Points
Trade on-chain assets and enjoy airdrop rewards!
Futures Points
Earn futures points and claim airdrop rewards
Investment
Simple Earn
Earn interests with idle tokens
Auto-Invest
Auto-invest on a regular basis
Dual Investment
Buy low and sell high to take profits from price fluctuations
Soft Staking
Earn rewards with flexible staking
Crypto Loan
0 Fees
Pledge one crypto to borrow another
Lending Center
One-stop lending hub
VIP Wealth Hub
Customized wealth management empowers your assets growth
Private Wealth Management
Customized asset management to grow your digital assets
Quant Fund
Top asset management team helps you profit without hassle
Staking
Stake cryptos to earn in PoS products
Smart Leverage
New
No forced liquidation before maturity, worry-free leveraged gains
GUSD Minting
Use USDT/USDC to mint GUSD for treasury-level yields
More
Chillzzz
Live Trading and Learning with Chillzzz
1
- Reward
- like
- Comment
- Repost
- Share
Participate in horse racing betting, complete tasks to earn horse racing tickets, and enjoy a million red envelope rain daily, sharing a prize pool of 100,000 USDT at the Gate 2026 Spring Festival Celebration. https://www.gate.com/competition/year-of-horse-2026?ref_type=165&utm_cmp=7EQB9Jba&ref=VGRGAQ1BUG
View Original
- Reward
- like
- Comment
- Repost
- Share
Join the horse racing predictions, complete tasks to earn horse racing tickets, enjoy daily million Gift Coins giveaways, and share a 100,000 USDT prize pool—all at the Gate 2026 Spring Festival Celebration. https://www.gate.com/competition/year-of-horse-2026?ref_type=165&utm_cmp=7EQB9Jba&ref=VLAQAVBYCQ
- Reward
- like
- Comment
- Repost
- Share
馬币火
Malaysian Ringgit
Created By@SteadyProgressTowardABright
Listing Progress
100.00%
MC:
$6.46K
More Tokens
#WhiteHouseTalksStablecoinYields
#WhiteHouseTalksStablecoinYields
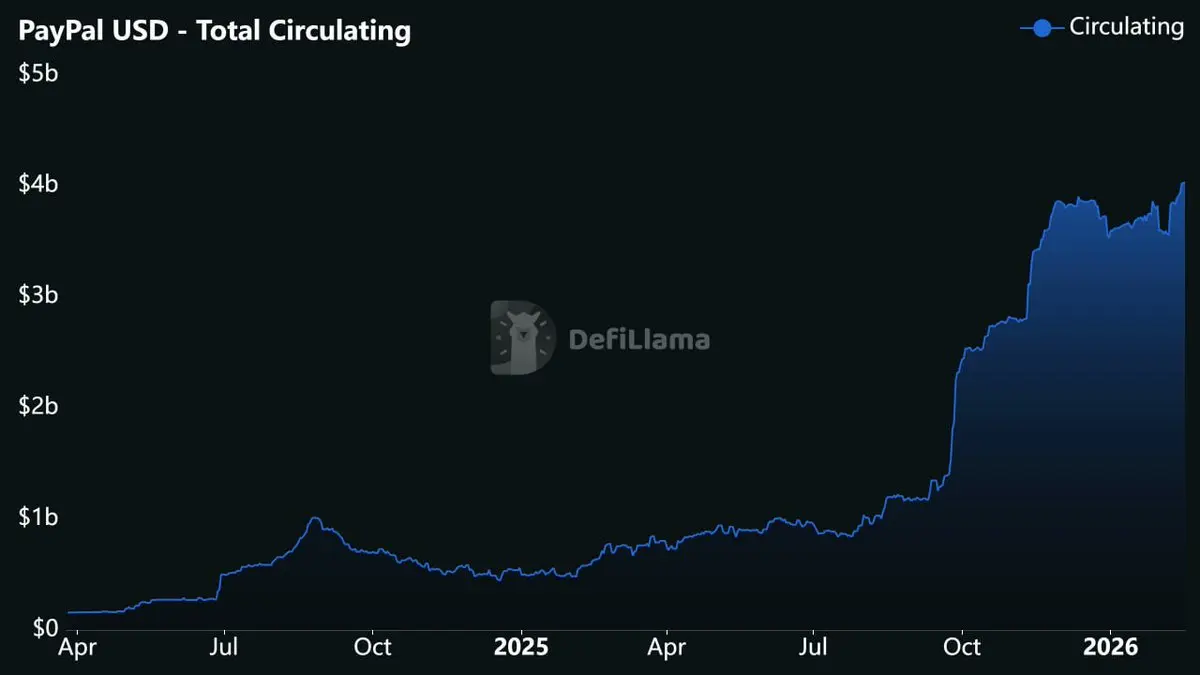
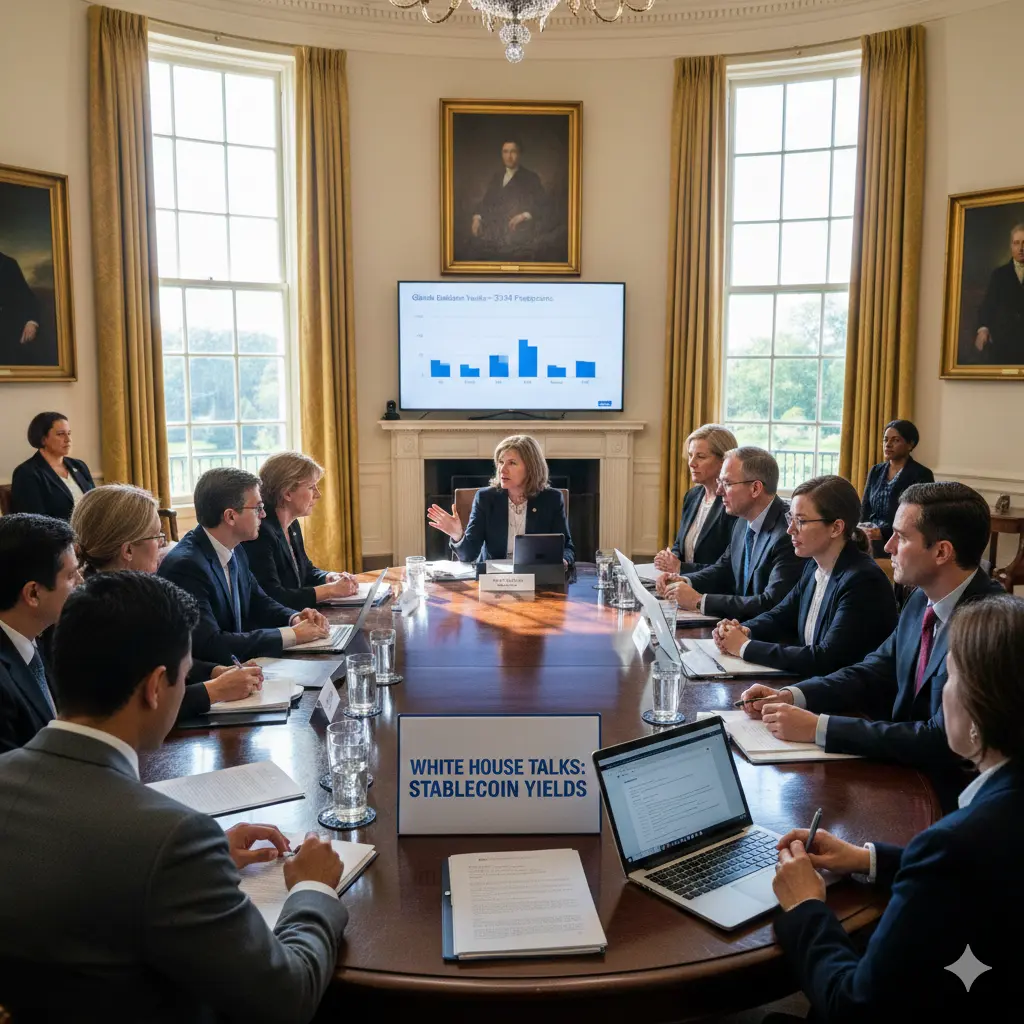
The White House is actively discussing stablecoin yields as part of broader efforts to regulate the rapidly growing digital asset market. Stablecoins—cryptocurrencies pegged to traditional fiat currencies like the USD—have become a major part of the financial ecosystem, offering liquidity, payment efficiency, and yield opportunities. However, their rapid growth raises questions about safety, investor protection, and systemic risk.
What Are Stablecoin Yields?
Stablecoin yields are the returns generated by holding stablecoins in
#WhiteHouseTalksStablecoinYields
The White House is actively discussing stablecoin yields as part of broader efforts to regulate the rapidly growing digital asset market. Stablecoins—cryptocurrencies pegged to traditional fiat currencies like the USD—have become a major part of the financial ecosystem, offering liquidity, payment efficiency, and yield opportunities. However, their rapid growth raises questions about safety, investor protection, and systemic risk.
What Are Stablecoin Yields?
Stablecoin yields are the returns generated by holding stablecoins in
- Reward
- 1
- 3
- Repost
- Share
Vortex_King :
:
2026 GOGOGO 👊View More
Participate in horse racing betting, complete tasks to earn horse racing tickets, and enjoy a million red envelope rain daily, sharing a prize pool of 100,000 USDT at the Gate 2026 Spring Festival Celebration. https://www.gate.com/competition/year-of-horse-2026?ref_type=165&utm_cmp=7EQB9Jba&ref=VVDNUQSNCQ
View Original
- Reward
- like
- Comment
- Repost
- Share
Start the Year of the Horse with a win! Gate Plaza's $50,000 Red Envelope Rain is waiting for you to post and throw https://www.gate.com/campaigns/4044?ref=VQNFULLWUG&ref_type=132
View Original
- Reward
- like
- Comment
- Repost
- Share
Participate in horse racing betting, complete tasks to earn horse racing tickets, and enjoy a million red envelope rain daily, sharing a prize pool of 100,000 USDT at the Gate 2026 Spring Festival Celebration. https://www.gate.com/competition/year-of-horse-2026?ref_type=165&utm_cmp=7EQB9Jba&ref=BFJDUApa
View Original
- Reward
- like
- Comment
- Repost
- Share
🎉 $50,000 Red Packet Giveaway is LIVE on Gate Square! 🧧
The Year of the Horse starts with luck and excitement! Gate Square is spreading fortune with a massive $50K Red Packet Giveaway — and you could be one of the lucky winners.
💡 How to Participate:
1️⃣ Post Your Wishes – Share your crypto wishes or New Year greetings on Gate Square.
2️⃣ Open Red Packets – Claim your chance to grab a share of the $50,000 prize pool.
3️⃣ Win Instantly – Each participant has a chance to win multiple red packets!
✨ Why Join?
Celebrate the new year with crypto rewards.
Connect with the Gate.io community.
Enjoy

- Reward
- 1
- Comment
- Repost
- Share
Happy Fire Horse Year! Wishing everyone a Happy New Year!
View Original
- Reward
- like
- Comment
- Repost
- Share
Participate in horse racing betting, complete tasks to earn horse racing tickets, and enjoy a million red envelope rain daily, sharing a prize pool of 100,000 USDT at the Gate 2026 Spring Festival Celebration. https://www.gate.com/competition/year-of-horse-2026?ref_type=165&utm_cmp=7EQB9Jba&ref=BFkRA10L
View Original
- Reward
- like
- Comment
- Repost
- Share
Participate in horse racing betting, complete tasks to earn horse racing tickets, and enjoy a million red envelope rain daily, sharing a prize pool of 100,000 USDT at the Gate 2026 Spring Festival Celebration. https://www.gate.com/competition/year-of-horse-2026?ref_type=165&utm_cmp=7EQB9Jba&ref=AwVFVVhe
View Original
- Reward
- like
- Comment
- Repost
- Share
马勒戈币
马勒戈币
Created By@LittlePonyGogo
Listing Progress
100.00%
MC:
$63.31K
More Tokens
#GateHKEventsKickOff February 17, 2026 marks the beginning of a major new chapter in the global expansion strategy of Gate.io. The launch of #GateHKEventsKickOff is not just another promotional campaign — it represents a deeper and more strategic commitment to the Hong Kong market, one of the world’s most influential financial centers.
As a leading global hub, Hong Kong has been positioning itself as a regulated and innovation-friendly destination for digital assets. With evolving crypto frameworks, growing institutional participation, and strong government support for financial technology, th
As a leading global hub, Hong Kong has been positioning itself as a regulated and innovation-friendly destination for digital assets. With evolving crypto frameworks, growing institutional participation, and strong government support for financial technology, th

- Reward
- 1
- 2
- Repost
- Share
MasterChuTheOldDemonMasterChu :
:
2026 Go Go Go 👊View More
🚀 Tech & AI Daily Summary: February 17, 2026
1. Breakthrough in Model Efficiency (Green AI)
Major industry leaders have announced a significant update to Large Language Models (LLMs) featuring "Dynamic Pruning" technology.
* Energy Efficiency: This update reduces power consumption by 30% by activating only the necessary parameters for specific tasks.
* Performance: It improves response accuracy in complex programming tasks (specifically in Rust and Python) while reducing latency by 25%, making high-tier AI more viable for mobile integration without draining battery life.
2. Evolution of Wea


[The user has shared his/her trading data. Go to the App to view more.]
- Reward
- 2
- 1
- Repost
- Share
Aziz2030:
best futures is coming ♥️♥️♥️♥️♥️♥️♥️♥️♥️♥️♥️♥️♥️♥️♥️♥️♥️♥️♥️♥️♥️♥️♥️♥️♥️♥️♥️♥️#BuyTheDipOrWaitNow?
Buy the Dip or Wait Now? Strategic Insights Amid Market Volatility
The recent market turbulence has sparked an important question for all investors: should we buy the dip now, or wait for further clarity? Over the past several sessions, geopolitical tensions particularly escalating conflicts between the U.S. and Iranhave sent shockwaves across global markets. Gold has surged past the $5,000 per ounce mark, reflecting a classic safe-haven flight, while Bitcoin has retreated sharply, highlighting the heightened volatility in digital assets. From my perspective, the answer i
BTC0,64%


- Reward
- 1
- 2
- Repost
- Share
MasterChuTheOldDemonMasterChu:
2026 Go Go Go 👊View More
Participate in horse racing betting, complete tasks to earn horse racing tickets, and enjoy a million red envelope rain daily, sharing a prize pool of 100,000 USDT at the Gate 2026 Spring Festival Celebration. https://www.gate.com/competition/year-of-horse-2026?ref_type=165&utm_cmp=7EQB9Jba&ref=VQISVlpY
View Original
- Reward
- like
- Comment
- Repost
- Share
According to ChainCatcher, and The Block, the latest disclosure from Harvard Management Company, a fund manager affiliated with Harvard University, shows they reduced their Bitcoin ETF holdings by approximately 21% in Q4/2025, while establishing their first Ethereum ETF position, with a total exposure of about $352.6 million across the two main cryptocurrencies. As of December 31, 2025, Harvard held approximately 5.35 million shares of BlackRock's IBIT, valued at $265.8 million, down about 1.48 million shares from 6.81 million shares in the previous quarter. At the same time, a new position in
View Original

- Reward
- like
- Comment
- Repost
- Share
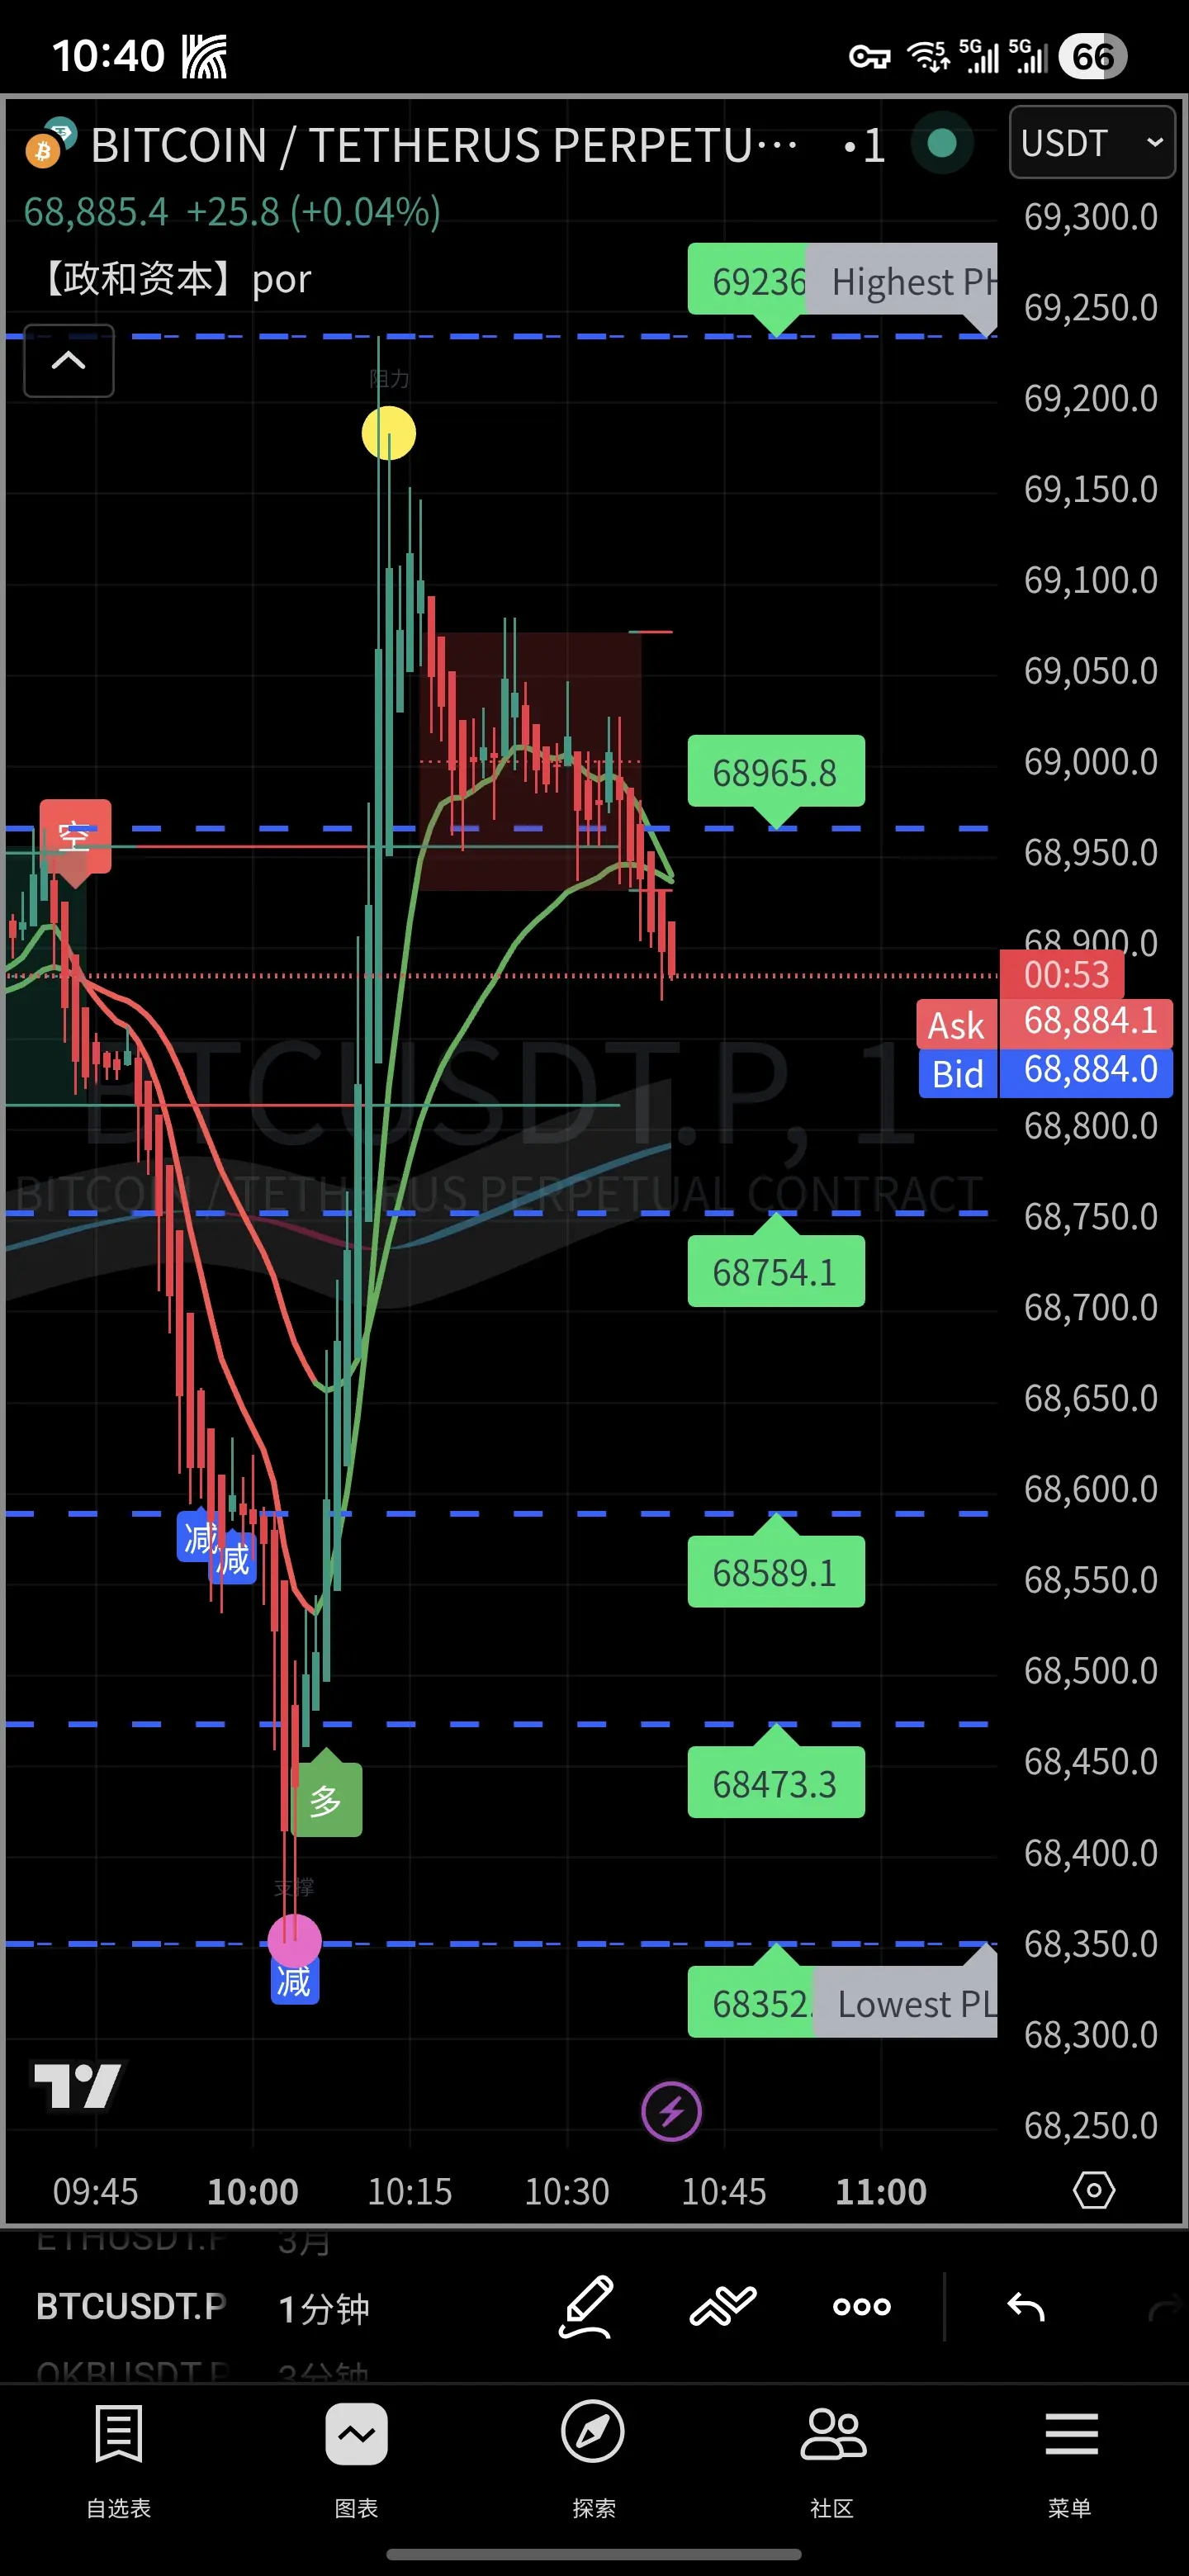
📌 2026-02-17 BTC Technical Analysis + Intraday Strategy (As of 11:00)
Current Price: $68,500 (Oversold rebound, oscillating with a slight bullish bias)
Core Conclusion: Daily chart dominated by bears, 4-hour oversold rebound; intraday mainly range-bound, high shorting and low longing, strict stop-loss control
1. Trend and Structure (Quick Overview)
- Daily: Moving averages in a bearish alignment (50-day ≈ $87,000, 200-day ≈ $102,000); RSI ≈ 17 (historically deeply oversold); MACD below zero line, green bars shrinking, weakening downward momentum
- 4-Hour: Rebound channel, $68,000–$69,000 b
BTC0,64%
- Reward
- 2
- Comment
- Repost
- Share
BTC,ETH Market Analysis
553
- Reward
- 4
- 1
- Repost
- Share
MasterChuTheOldDemonMasterChu:
Happy New Year 🧨Participate in horse racing betting, complete tasks to earn horse racing tickets, and enjoy a million red envelope rain daily, sharing a prize pool of 100,000 USDT at the Gate 2026 Spring Festival Celebration. https://www.gate.com/competition/year-of-horse-2026?ref_type=165&utm_cmp=7EQB9Jba&ref=VVGQXVHYUQ
View Original
- Reward
- like
- Comment
- Repost
- Share
Load More
Join 40M users in our growing community
⚡️ Join 40M users in the crypto craze discussion
💬 Engage with your favorite top creators
👍 See what interests you
Trending Topics
View More161.3K Popularity
32.05K Popularity
28.45K Popularity
73.93K Popularity
13.87K Popularity
Hot Gate Fun
View More- MC:$2.53KHolders:20.07%
- MC:$0.1Holders:10.00%
- MC:$2.53KHolders:20.00%
- MC:$2.5KHolders:10.00%
- MC:$0.1Holders:00.00%
News
View MoreRootData: SOSO will unlock tokens worth approximately $5.99 million in one week
1 m
Crypto lending platform Nexo re-enters the US market
21 m
On Polygon, the weekly USDC trading volume reached 28 million transactions, surpassing Solana to become the most active USDC chain.
26 m
Data: In the past 24 hours, the entire network has liquidated $223 million, with long positions liquidated at $137 million and short positions at $85.76 million.
30 m
Market Report: Top 5 cryptocurrencies by decline on February 17, 2026, with Humanity Protocol experiencing the largest drop
31 m
Pin