Trade
Basic
Futures
Futures
Hundreds of contracts settled in USDT or BTC
TradFi
Gold
Trade global traditional assets with USDT in one place
Options
Hot
Trade European-style vanilla options
Unified Account
Maximize your capital efficiency
Demo Trading
Futures Kickoff
Get prepared for your futures trading
Futures Events
Participate in events to win generous rewards
Demo Trading
Use virtual funds to experience risk-free trading
Earn
Launch
CandyDrop
Collect candies to earn airdrops
Launchpool
Quick staking, earn potential new tokens
HODLer Airdrop
Hold GT and get massive airdrops for free
Launchpad
Be early to the next big token project
Alpha Points
Trade on-chain assets and enjoy airdrop rewards!
Futures Points
Earn futures points and claim airdrop rewards
Investment
Simple Earn
Earn interests with idle tokens
Auto-Invest
Auto-invest on a regular basis
Dual Investment
Buy low and sell high to take profits from price fluctuations
Soft Staking
Earn rewards with flexible staking
Crypto Loan
0 Fees
Pledge one crypto to borrow another
Lending Center
One-stop lending hub
VIP Wealth Hub
Customized wealth management empowers your assets growth
Private Wealth Management
Customized asset management to grow your digital assets
Quant Fund
Top asset management team helps you profit without hassle
Staking
Stake cryptos to earn in PoS products
Smart Leverage
New
No forced liquidation before maturity, worry-free leveraged gains
GUSD Minting
Use USDT/USDC to mint GUSD for treasury-level yields
More
BigMingBrotherInThe
The golden horse gallops into the new spring, and a thousand miles of journey begins with song!
2026 Bing Wu Year, Da Ming wishes everyone:
May you have the spirit of a dragon and horse, good health, and success in your career!
May success come instantly and everything go smoothly, ride forward into the future!
Happy New Year's Eve, and happiness to your family!
To all our beloved subscribers, quietly open Autohome!
And I, quietly open Massage at Home!
View Original2026 Bing Wu Year, Da Ming wishes everyone:
May you have the spirit of a dragon and horse, good health, and success in your career!
May success come instantly and everything go smoothly, ride forward into the future!
Happy New Year's Eve, and happiness to your family!
To all our beloved subscribers, quietly open Autohome!
And I, quietly open Massage at Home!


- Reward
- like
- 1
- Repost
- Share
BigMingBrotherInThe:
If you can achieve success while young, why wait until later? Flowers may bloom again, but youth never returns. Subscribe to join the exclusive circle!$PI #GateSquare$50KRedPacketGiveaway
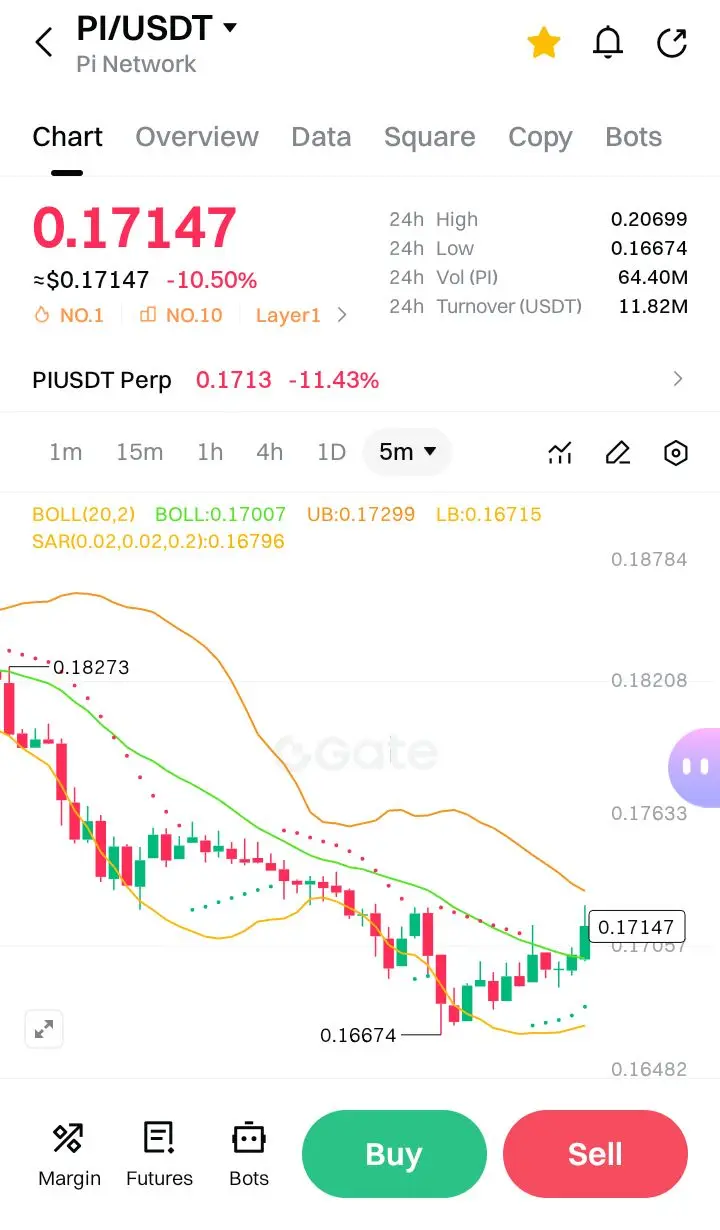
In-Depth K-Line Analysis for PI/USDT (5-Minute Chart)
Current Price: 0.17147 USDT
24h Change: -10.50%
24h High/Low: 0.20699 / 0.16674
24h Volume: 64.40M PI | 11.82M USDT
The chart shows a significant intraday drop, with price currently trading near the lower end of the daily range. The selected timeframe is 5 minutes, so we are analyzing short-term price action and technical indicators on that scale.
1. Bollinger Bands (20, 2)
· Middle Band (SMA): 0.17007
· Upper Band: 0.17299
· Lower Band: 0.16715
Current price (0.17147) is above the middle band but below
PI-13,49%

- Reward
- 1
- 1
- Repost
- Share
TheGreatBeautyOfTheInfinite:
$PI $PI The purchased assets are finally trapped. After a harvest is completed, the price continues to fall. It hits a low point in March. From July to December, it will drop to the point of questioning life. Nearly collapsing in 2027. By 2030, the servers are expected to expire. Delist and run!! Everyone, hurry up and buy buy buy... Don't miss the chance to get on board. Invest all your assets and hold until 2030. Financial freedom is in 2030. Let's work hard together...Participate in horse racing betting, complete tasks to earn horse racing tickets, and enjoy a million red envelope rain daily, sharing a prize pool of 100,000 USDT at the Gate 2026 Spring Festival Celebration. https://www.gate.com/competition/year-of-horse-2026?ref_type=165&utm_cmp=7EQB9Jba&ref=VlFGV1EK
View Original
- Reward
- like
- Comment
- Repost
- Share
馬币火
Malaysian Ringgit
Created By@SteadyProgressTowardABright
Listing Progress
100.00%
MC:
$6.73K
More Tokens
Participate in horse racing betting, complete tasks to earn horse racing tickets, and enjoy a million red envelope rain daily, sharing a prize pool of 100,000 USDT at the Gate 2026 Spring Festival Celebration. https://www.gate.com/competition/year-of-horse-2026?ref_type=165&utm_cmp=7EQB9Jba&ref=VLYVBGPDUG
View Original
- Reward
- like
- Comment
- Repost
- Share
#我在Gate广场过新年 Gate Weekly Coin Listing Report: February 9, 2026 - February 15, 2026
🔹 Spot: $UP, $AZTEC, $ESP
🔹 Contracts: $ESP, $AZTEC, $OPN
Participate in new coin #CandyDrop activities, millions of candy rewards waiting to be claimed
👉 Join now: https://www.gate.com/candy-drop
View Original🔹 Spot: $UP, $AZTEC, $ESP
🔹 Contracts: $ESP, $AZTEC, $OPN
Participate in new coin #CandyDrop activities, millions of candy rewards waiting to be claimed
👉 Join now: https://www.gate.com/candy-drop


- Reward
- 1
- Comment
- Repost
- Share
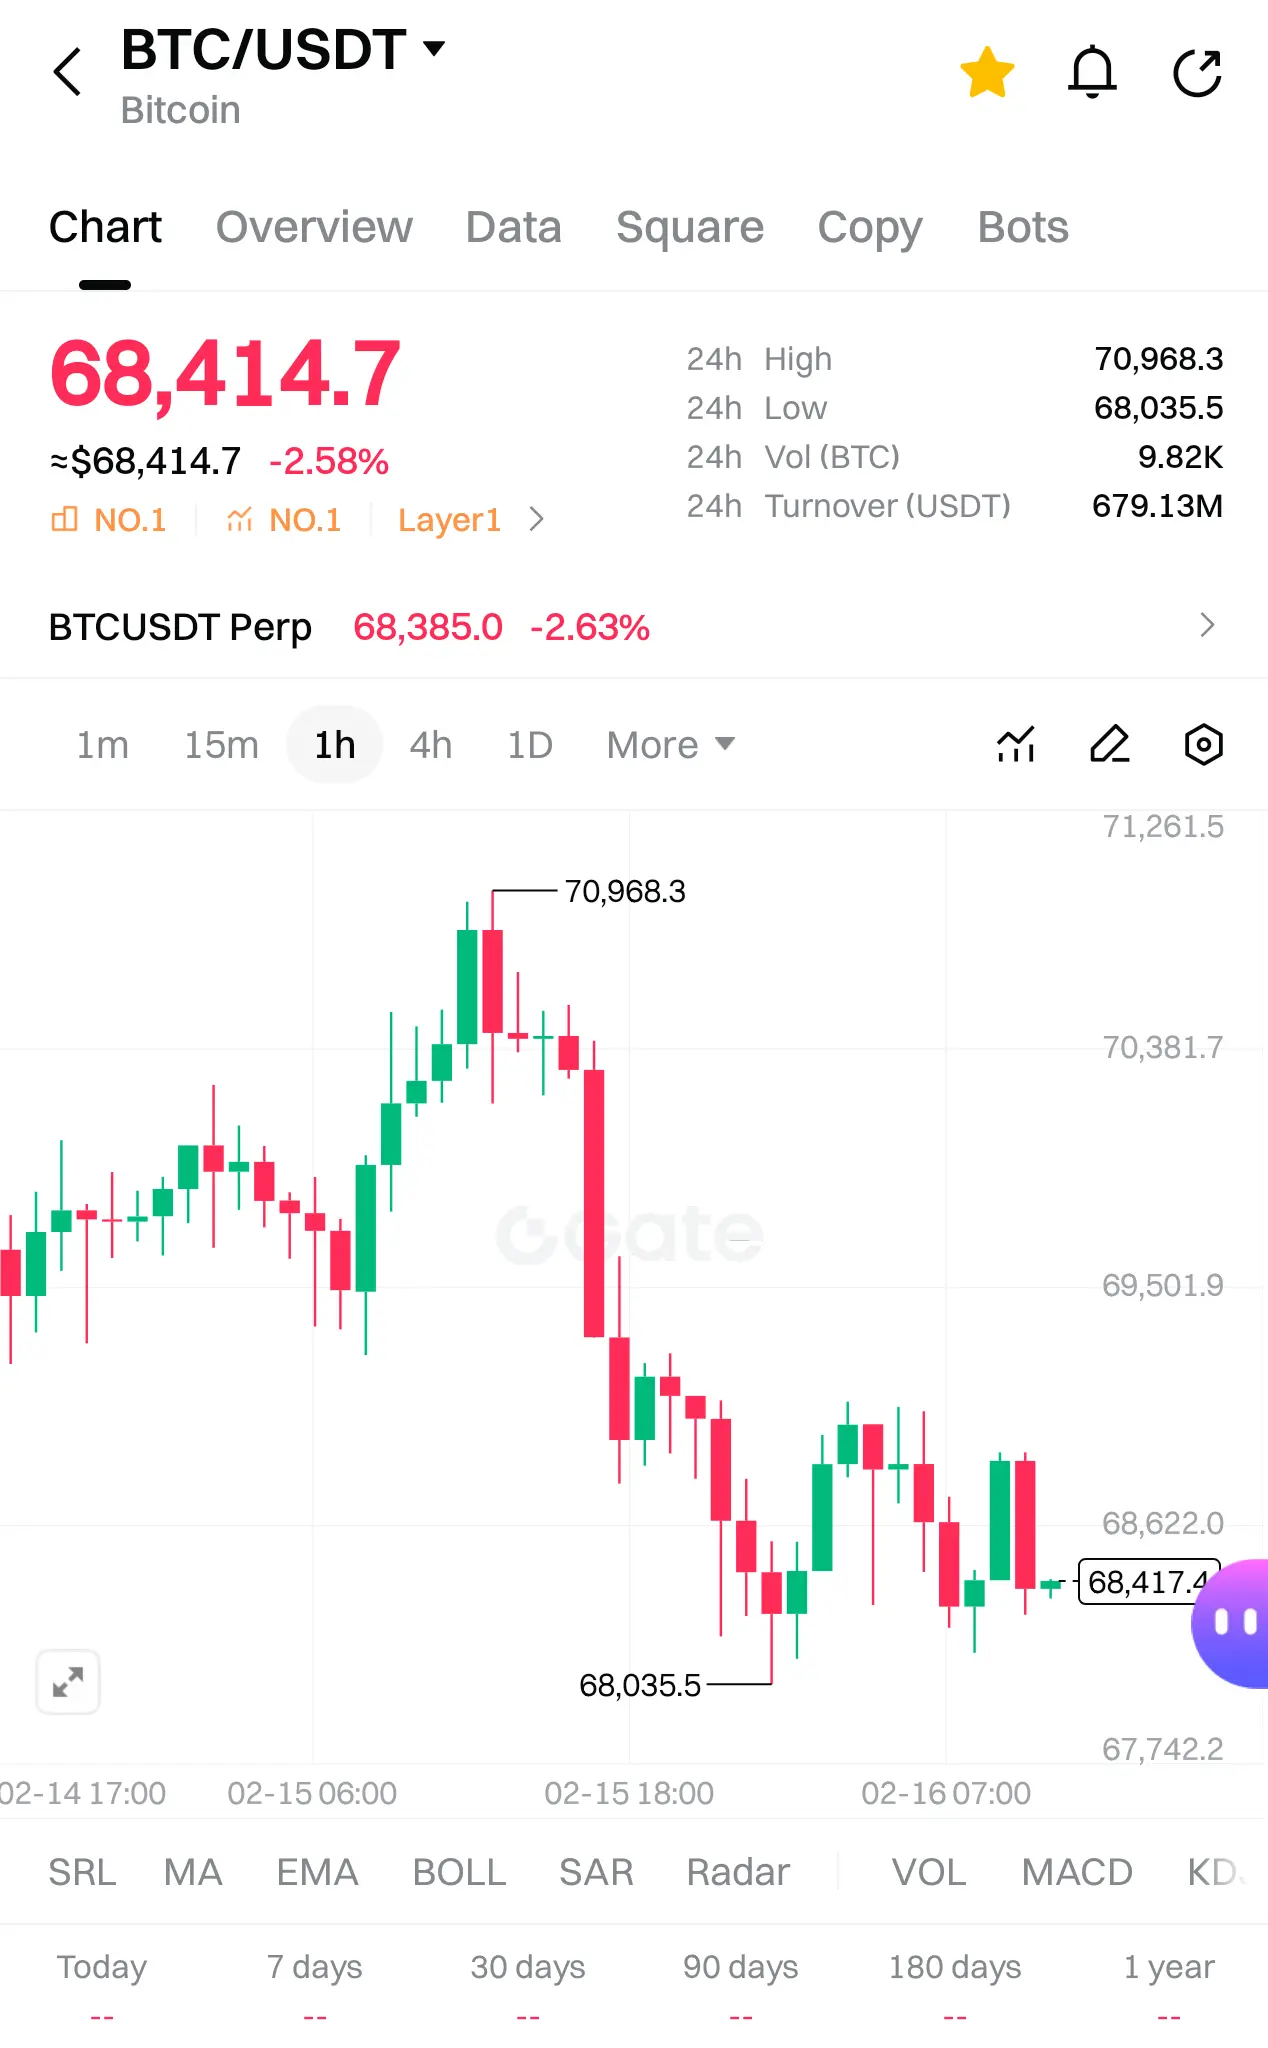
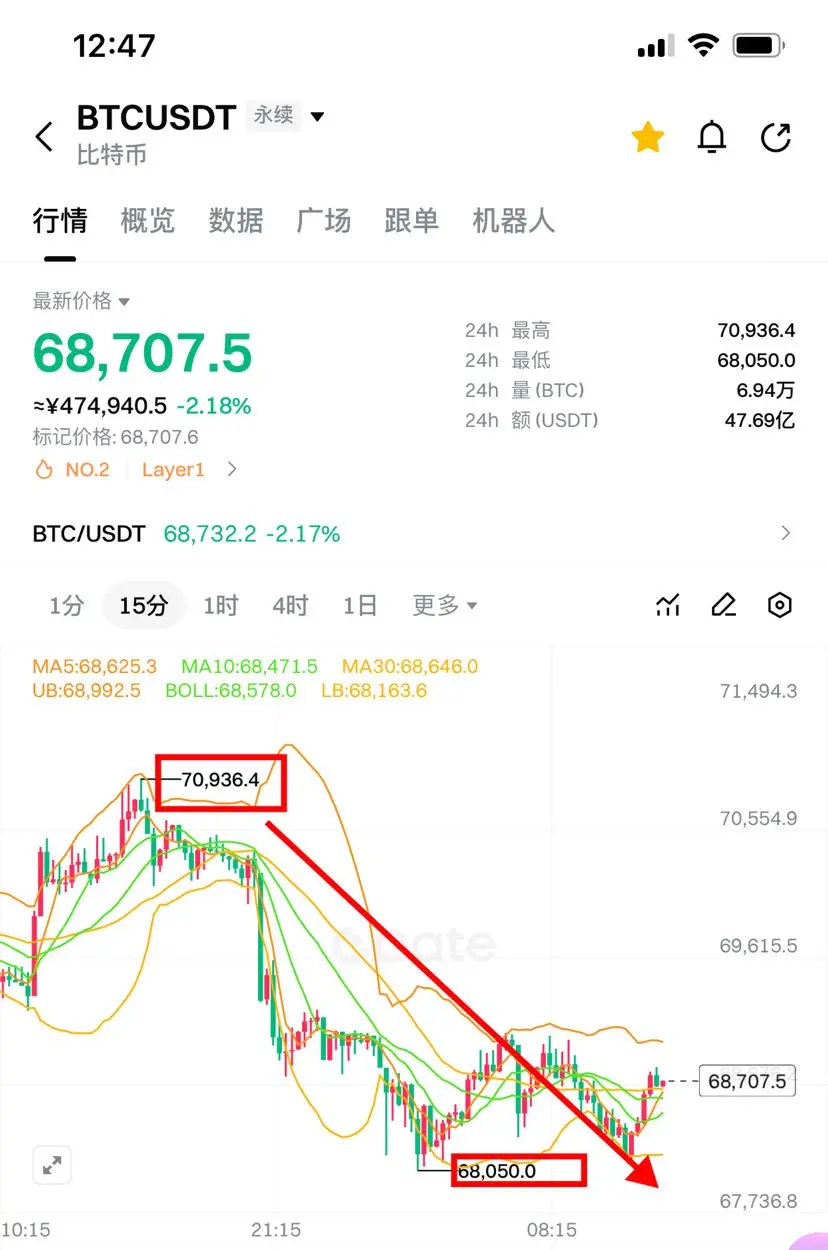
$BTC — Bullish reaction building after liquidity sweep.
I’m seeing buyers defend the 68,000 zone after that sharp flush from 70,900. That low around 68,035 looks like a stop-hunt rather than continuation weakness. Momentum slowed, sellers lost aggression, and structure is trying to base on the 1H.
I’m interested if price holds above 68,200 and reclaims 68,600 with strength.
Entry: 68,450 – 68,650
Targets:
TP1: 69,200
TP2: 69,850
TP3: 70,400
Stop Loss: 67,950
This works if buyers keep defending the swept low and we break minor lower-high structure. A reclaim of 69K shifts short-term control bac
BTC-2,52%
- Reward
- like
- Comment
- Repost
- Share
Alpha Score Speedrun Graduation Day Welcome
277
- Reward
- like
- Comment
- Repost
- Share
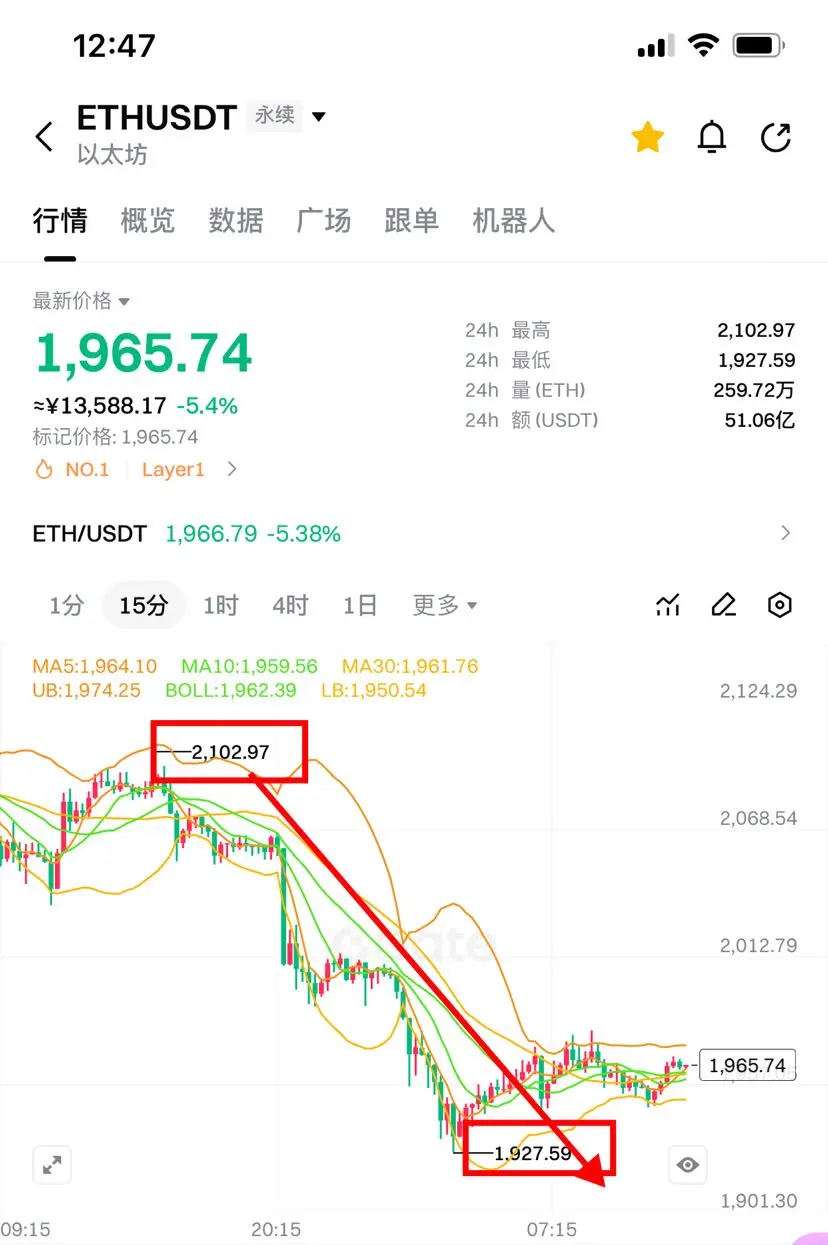
‼️Second order⬇️
‼️Direction: Short (CPI bullish, cautious position in second place)
==============
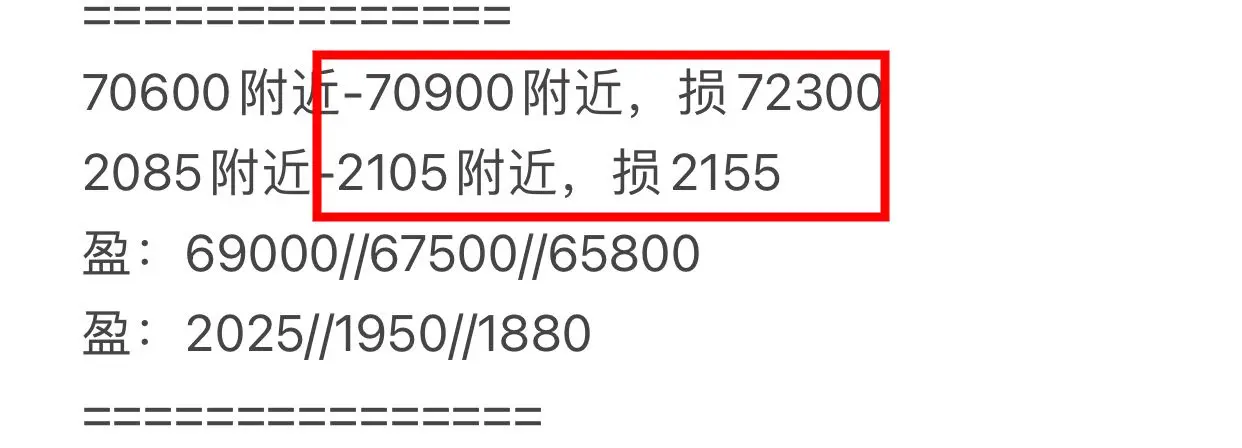
Around 70600-70900, stop at 72300
Around 2085-2105, stop at 2155
Profit: 69000//67500//65800
Profit: 2025//1950//1880
#美国核心CPI创四年新低
View Original‼️Direction: Short (CPI bullish, cautious position in second place)
==============
Around 70600-70900, stop at 72300
Around 2085-2105, stop at 2155
Profit: 69000//67500//65800
Profit: 2025//1950//1880
#美国核心CPI创四年新低
- Reward
- like
- Comment
- Repost
- Share
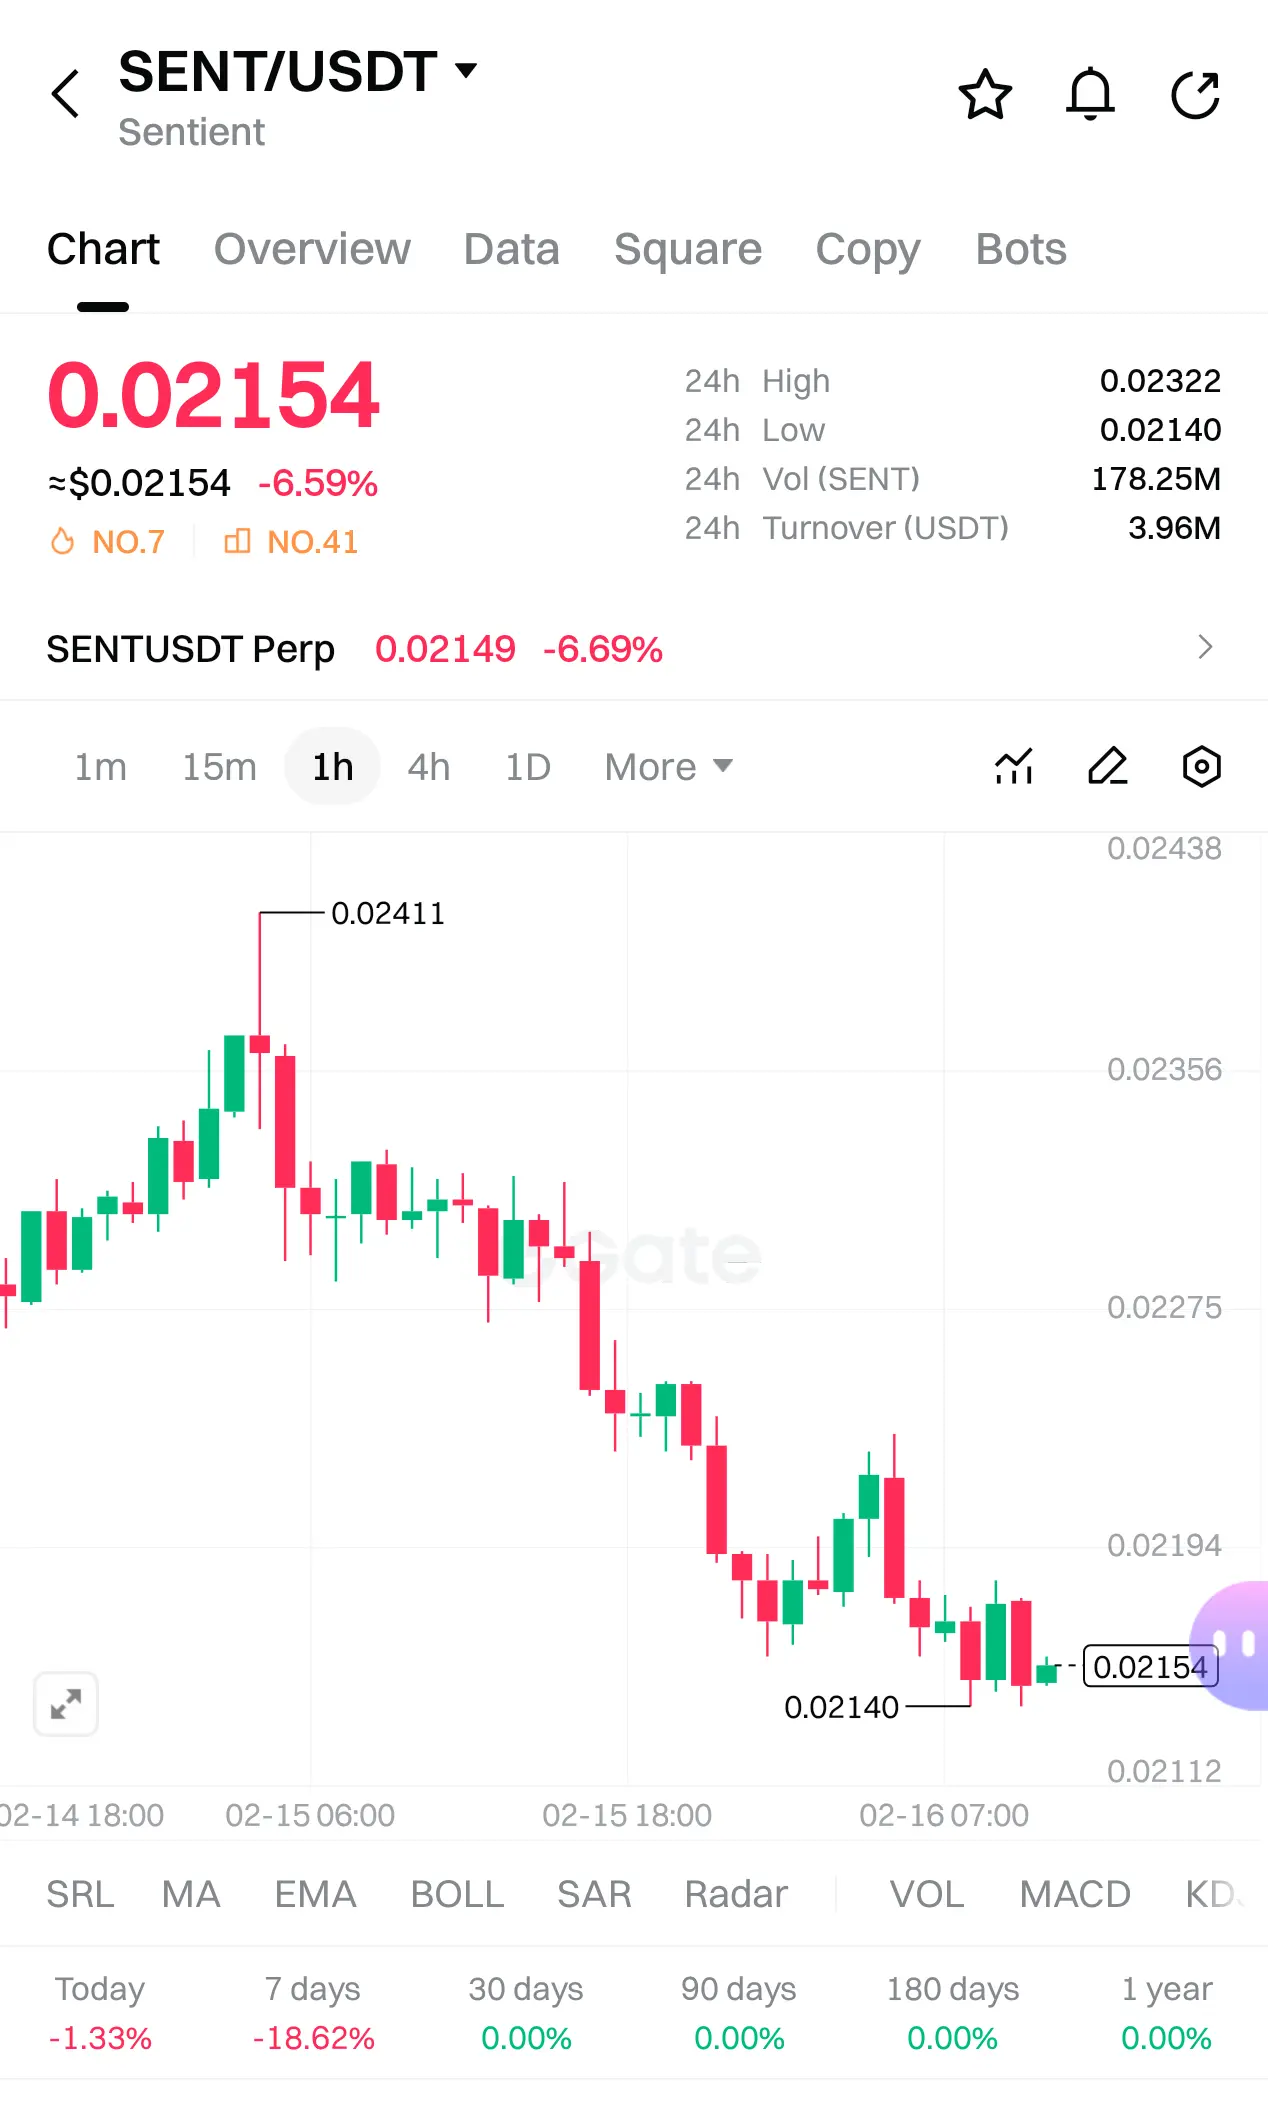
$SENT — Bulls Looking For Base After Controlled Drop
I’m seeing price pull back from 0.0241 into 0.0214 support. The move down was clean, but momentum is slowing near this demand zone. Sellers pushed, but follow-through is weakening.
Now we’re compressing around 0.0215. That’s where reversals usually build if support holds.
Entry: 0.02140 – 0.02160
Targets:
TP1: 0.02230
TP2: 0.02300
TP3: 0.02410
Stop Loss: 0.02090
This works if 0.0214 continues to hold and we break minor lower highs above 0.0222. Once that flips, liquidity sits toward 0.023–0.024 where prior supply formed.
Risk is tight. Struc
SENT-7,17%
- Reward
- like
- Comment
- Repost
- Share
SwapCoffee serves as a decentralized swap interface that enables users to exchange tokens within the TON Blockchain ecosystem. The platform connects to available liquidity sources, allowing swaps to be processed through existing market routes rather than relying on a single pool.
This approach helps maintain consistency in execution while giving users clear visibility into swap details before confirming transactions. Information such as token amounts, routes, and execution parameters are presented transparently, supporting informed interaction.
By providing direct access to token exchange infr


- Reward
- 1
- Comment
- Repost
- Share
Public domain copy traders start from 3k
Invite-based copy traders start from 500
Use time to gain space, use space to gain profit.
If you can accept losses, follow; if not, don't follow!
Trust your judgment the moment you make your choice. Let's delight ourselves with greater efficiency!
Keep going 👏
View OriginalInvite-based copy traders start from 500
Use time to gain space, use space to gain profit.
If you can accept losses, follow; if not, don't follow!
Trust your judgment the moment you make your choice. Let's delight ourselves with greater efficiency!
Keep going 👏

- Reward
- 1
- Comment
- Repost
- Share

Gate2026
Gate2026
Created By@0xd1b5...a733
Listing Progress
0.00%
MC:
$2.47K
More Tokens
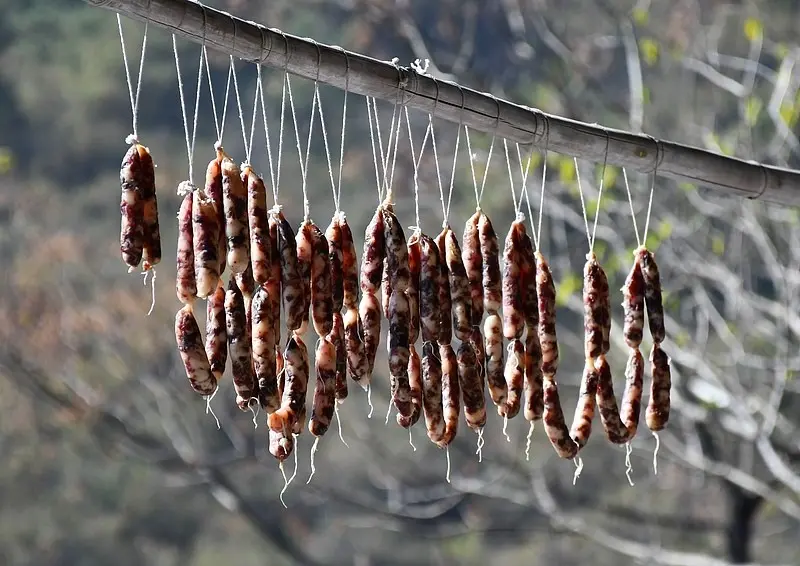
Young people today have already forgotten the rules of the New Year's Eve dinner
Based on personal experience and photos sent by friends, I’ve compiled the characteristics and rules of New Year's Eve dinners from different regions. After reading, you'll understand everything.
For Chinese people, the New Year's Eve dinner is not just a meal; it’s a KPI of year-end delicacies embedded in DNA. The north, south, east, and west each have their own obsessions and rules. Missing even one makes the New Year feel incomplete. Today, let’s use plain language to sort out the five major New Year’s Eve dinn
View OriginalBased on personal experience and photos sent by friends, I’ve compiled the characteristics and rules of New Year's Eve dinners from different regions. After reading, you'll understand everything.
For Chinese people, the New Year's Eve dinner is not just a meal; it’s a KPI of year-end delicacies embedded in DNA. The north, south, east, and west each have their own obsessions and rules. Missing even one makes the New Year feel incomplete. Today, let’s use plain language to sort out the five major New Year’s Eve dinn

- Reward
- like
- Comment
- Repost
- Share

#我在Gate广场过新年 🚀 Gate Square 2026 Mega Fortune Festival — The Next Wave of Rewards Is Coming! 🧧💎
As 2026 moves forward, Gate.io is preparing a brand-new Gate Square Fortune Festival, bringing even bigger rewards, smarter engagement tools, and stronger community incentives. Building on the success of previous red packet events, this upcoming campaign is designed to combine social activity, trading performance, and community influence into one powerful earning experience.
🌟 New Era, New Rewards — What’s Coming Next?
The next phase of Gate Square promotions will introduce multi-layered reward p
GT-3,94%

- Reward
- 6
- 6
- Repost
- Share
Vortex_King :
:
To The Moon 🌕View More
Participate in horse racing betting, complete tasks to earn horse racing tickets, and enjoy a million red envelope rain daily, sharing a prize pool of 100,000 USDT at the Gate 2026 Spring Festival Celebration. https://www.gate.com/competition/year-of-horse-2026?ref_type=165&utm_cmp=7EQB9Jba&ref=BAUXVw9d
View Original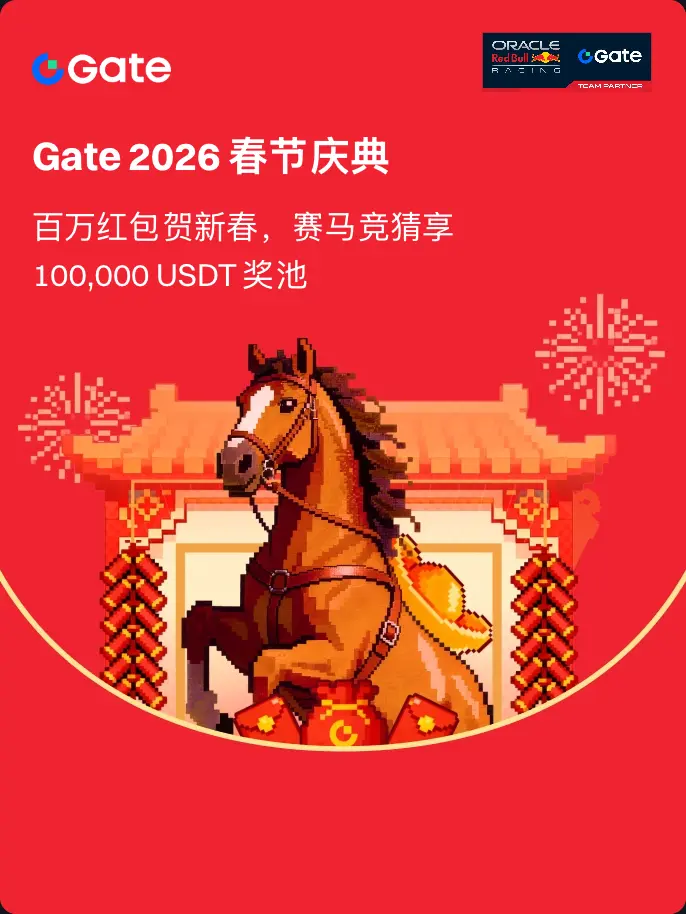
- Reward
- like
- Comment
- Repost
- Share
Participate in horse racing betting, complete tasks to earn horse racing tickets, and enjoy a million red envelope rain daily, sharing a prize pool of 100,000 USDT at the Gate 2026 Spring Festival Celebration. https://www.gate.com/competition/year-of-horse-2026?ref_type=165&utm_cmp=7EQB9Jba&ref=VVHAXQTYAQ
View Original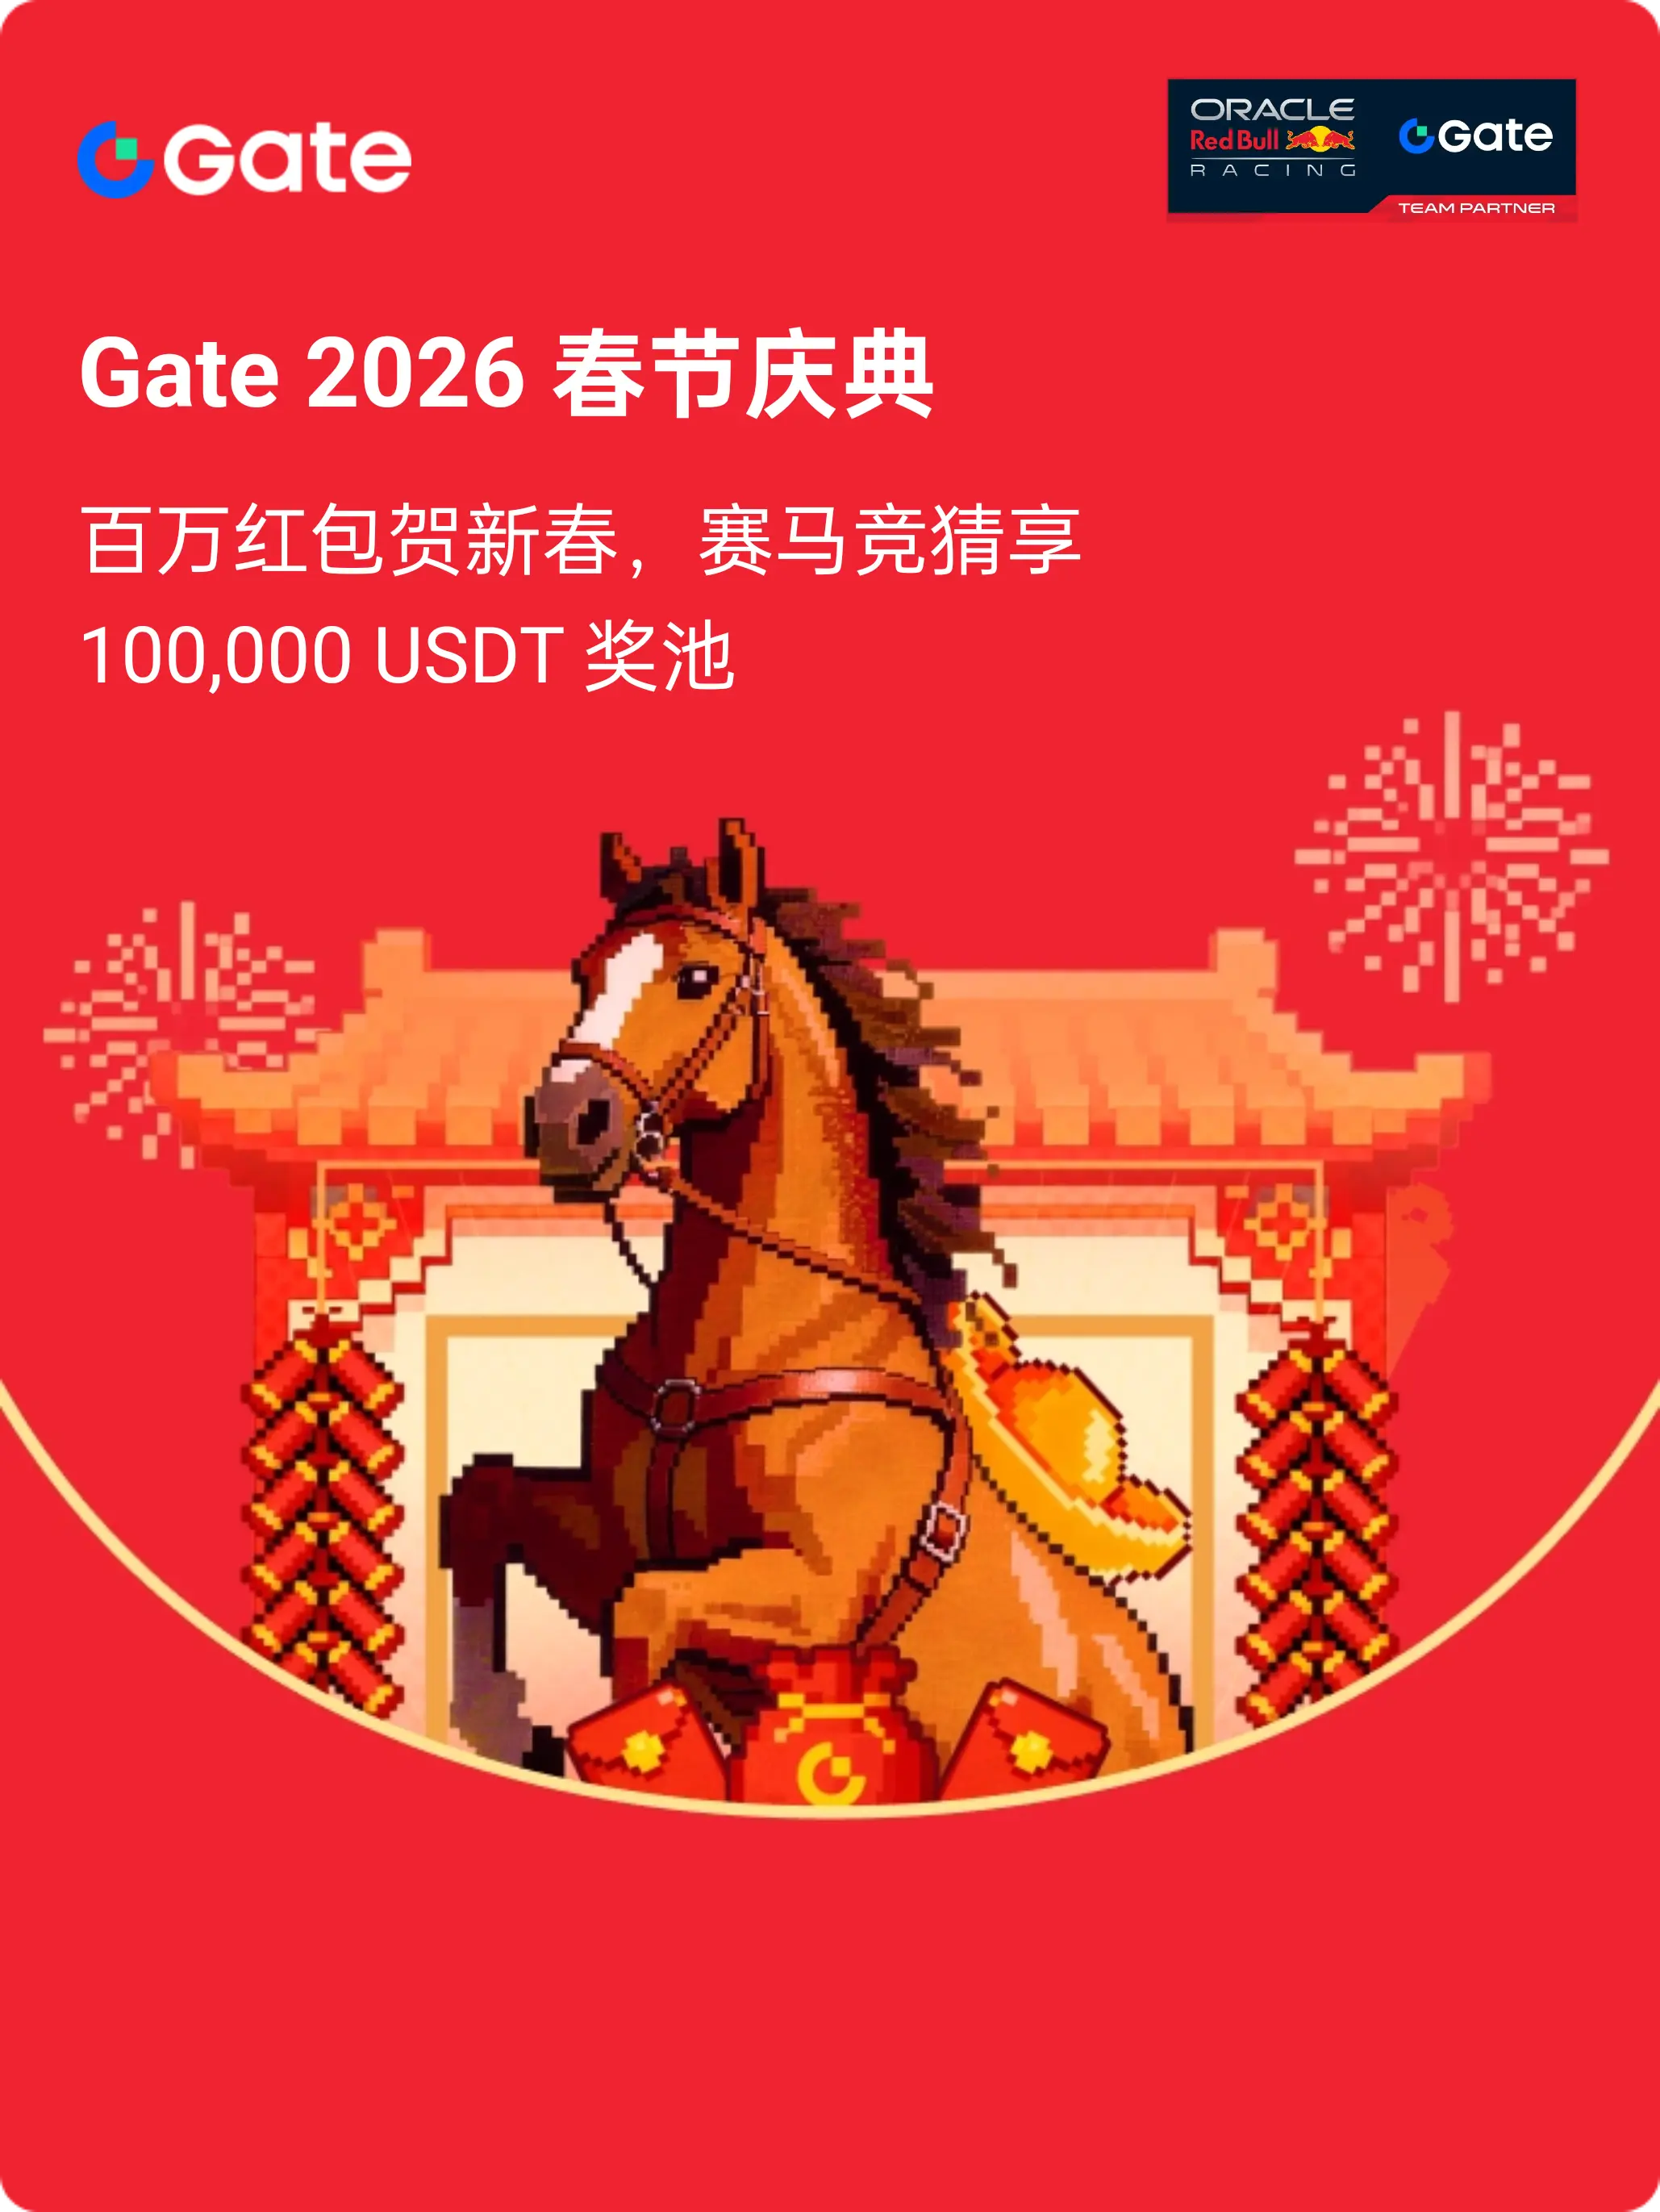
- Reward
- like
- Comment
- Repost
- Share
Crypto companies aiming for banking licenses: Is a historic turning point approaching? The gateway into the US banking system is opening wider than ever as prominent names like Circle, Ripple, BitGo, and Paxos pursue trust bank licenses from OCC. If successful, we will witness a structural leap: no longer needing the SWIFT network or cumbersome intermediary banks, but instead direct, local, and fully legal payments. The fact that traditional banks are panicking and demanding regulators to "pull the brakes" is evidence of the growing threat that Crypto poses to their long-held market share. Onc
BTC-2,52%

- Reward
- like
- Comment
- Repost
- Share
Sentiment read:Market stays cautious ahead of catalysts
502
- Reward
- 1
- Comment
- Repost
- Share
Participate in horse racing betting, complete tasks to earn horse racing tickets, and enjoy a million red envelope rain daily, sharing a prize pool of 100,000 USDT at the Gate 2026 Spring Festival Celebration. https://www.gate.com/competition/year-of-horse-2026?ref_type=165&utm_cmp=7EQB9Jba&ref=AQJFUF5B
View Original
- Reward
- like
- Comment
- Repost
- Share
Load More
Join 40M users in our growing community
⚡️ Join 40M users in the crypto craze discussion
💬 Engage with your favorite top creators
👍 See what interests you
Trending Topics
View More132.07K Popularity
24.25K Popularity
21.43K Popularity
66.41K Popularity
9.9K Popularity
Hot Gate Fun
View More- MC:$2.44KHolders:10.00%
- MC:$2.44KHolders:10.00%
- MC:$2.47KHolders:20.00%
- MC:$2.47KHolders:20.00%
- MC:$2.43KHolders:10.00%
News
View MoreRenaiss hosts a collectibles exhibition at the Consensus conference, with a total value of over $15 million.
26 m
Analysis: Bitcoin has fallen 22.3% since the beginning of the year, potentially marking the worst first quarter performance since 2018.
54 m
Kimi launches Kimi Claw Beta version, offering cloud-native integration based on OpenClaw
1 h
Ethereum Foundation Co-Executive Director: Ethereum can become a chain driven by large language models, currently with natural advantages
1 h
Willy Woo: The market has pre-priced the quantum threat with 4 million sell pressure, and BTC price performance will continue to be overshadowed by gloomy conditions
1 h
Pin