Executive Summary
- Bitcoin remains in the $110k–$116k “air gap” after contracting from its August all-time high. The bounce from $107k was supported by dip-buying, but selling pressure from short-term holders has capped the momentum so far.
- Profit-taking by 3–6 month holders and loss realization by recent top-buyers created headwinds. Sustaining a rally requires the price to stabilize above $114k to rebuild confidence and attract inflows.
- On-chain liquidity is still constructive but trending lower. Meanwhile, ETF flows have slowed to ~±500 BTC/day, weakening the TradFi demand that previously fuelled upside in March and December 2024.
- With spot demand softened, derivatives have become the main driver. Futures basis and volume remain balanced, and options open interest is rising, pointing to a more risk-managed market structure.
- The market sits at a crossroads, reclaiming $114k could spark fresh momentum, while a breakdown below $108k risks exposing the next cluster’s lower band near $93k.
View all charts in this edition in The Week On-chain Dashboard.
Ranging in Gap
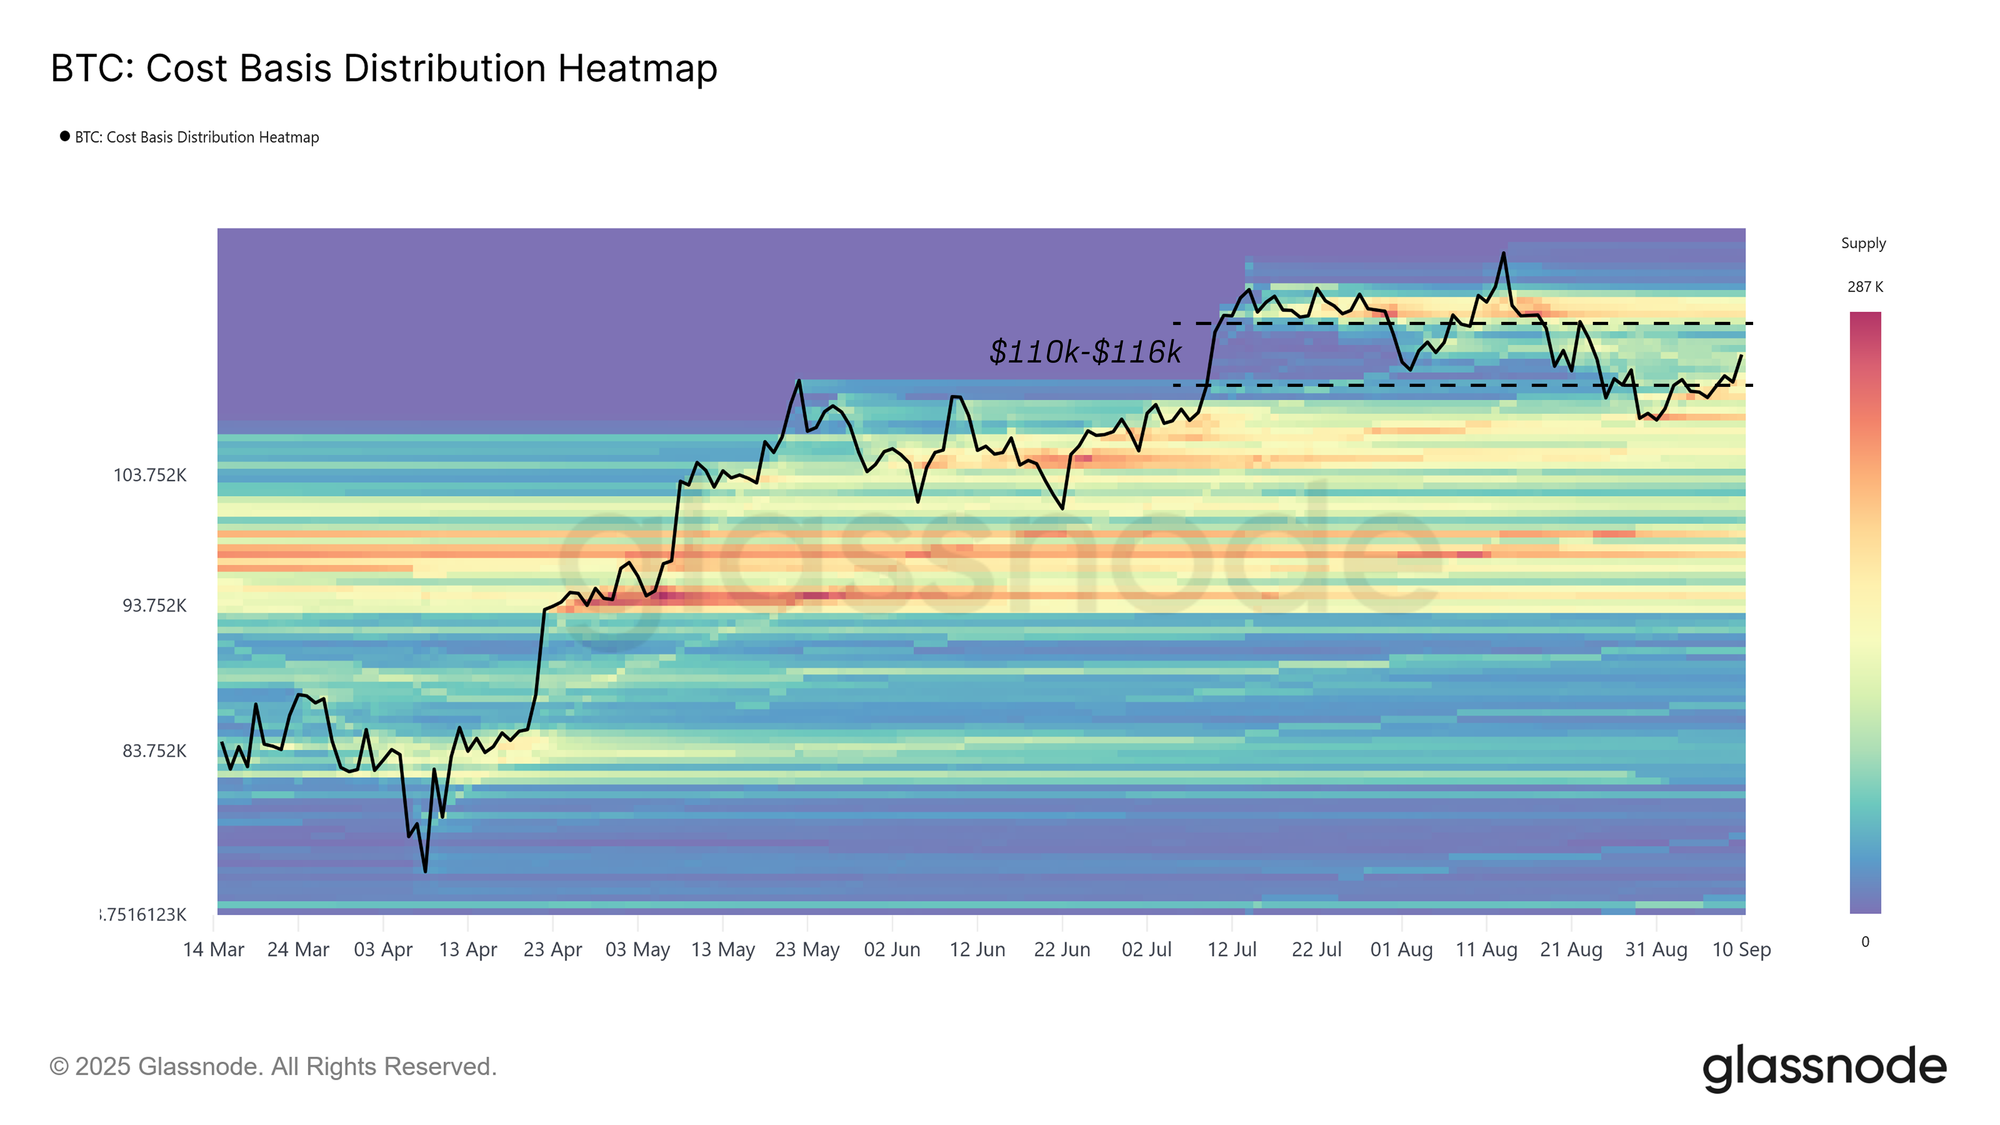
After the mid-August all-time high, market momentum has steadily faded, pulling Bitcoin below the cost basis of recent top-buyers and back into the $110k–$116k “air gap.” Since then, the price has fluctuated within this range, gradually filling it as supply redistributes. The key question now is whether this represents healthy consolidation or the first leg of a deeper contraction.
As shown in the Cost Basis Distribution (CBD), which maps where supply was last acquired across price levels, the bounce from $108k was underpinned by clear buy pressure on-chain — a “buy-the-dip” structure that helped stabilize the market.
This report examines the sell-side dynamics and momentum across both on-chain and off-chain indicators, highlighting the forces most likely to drive Bitcoin’s next decisive move out of this range.
Live Chart
Mapping Supply Clusters
To begin, we first map out the cost basis of the clusters around the current price, as these levels often anchor short-term price action.
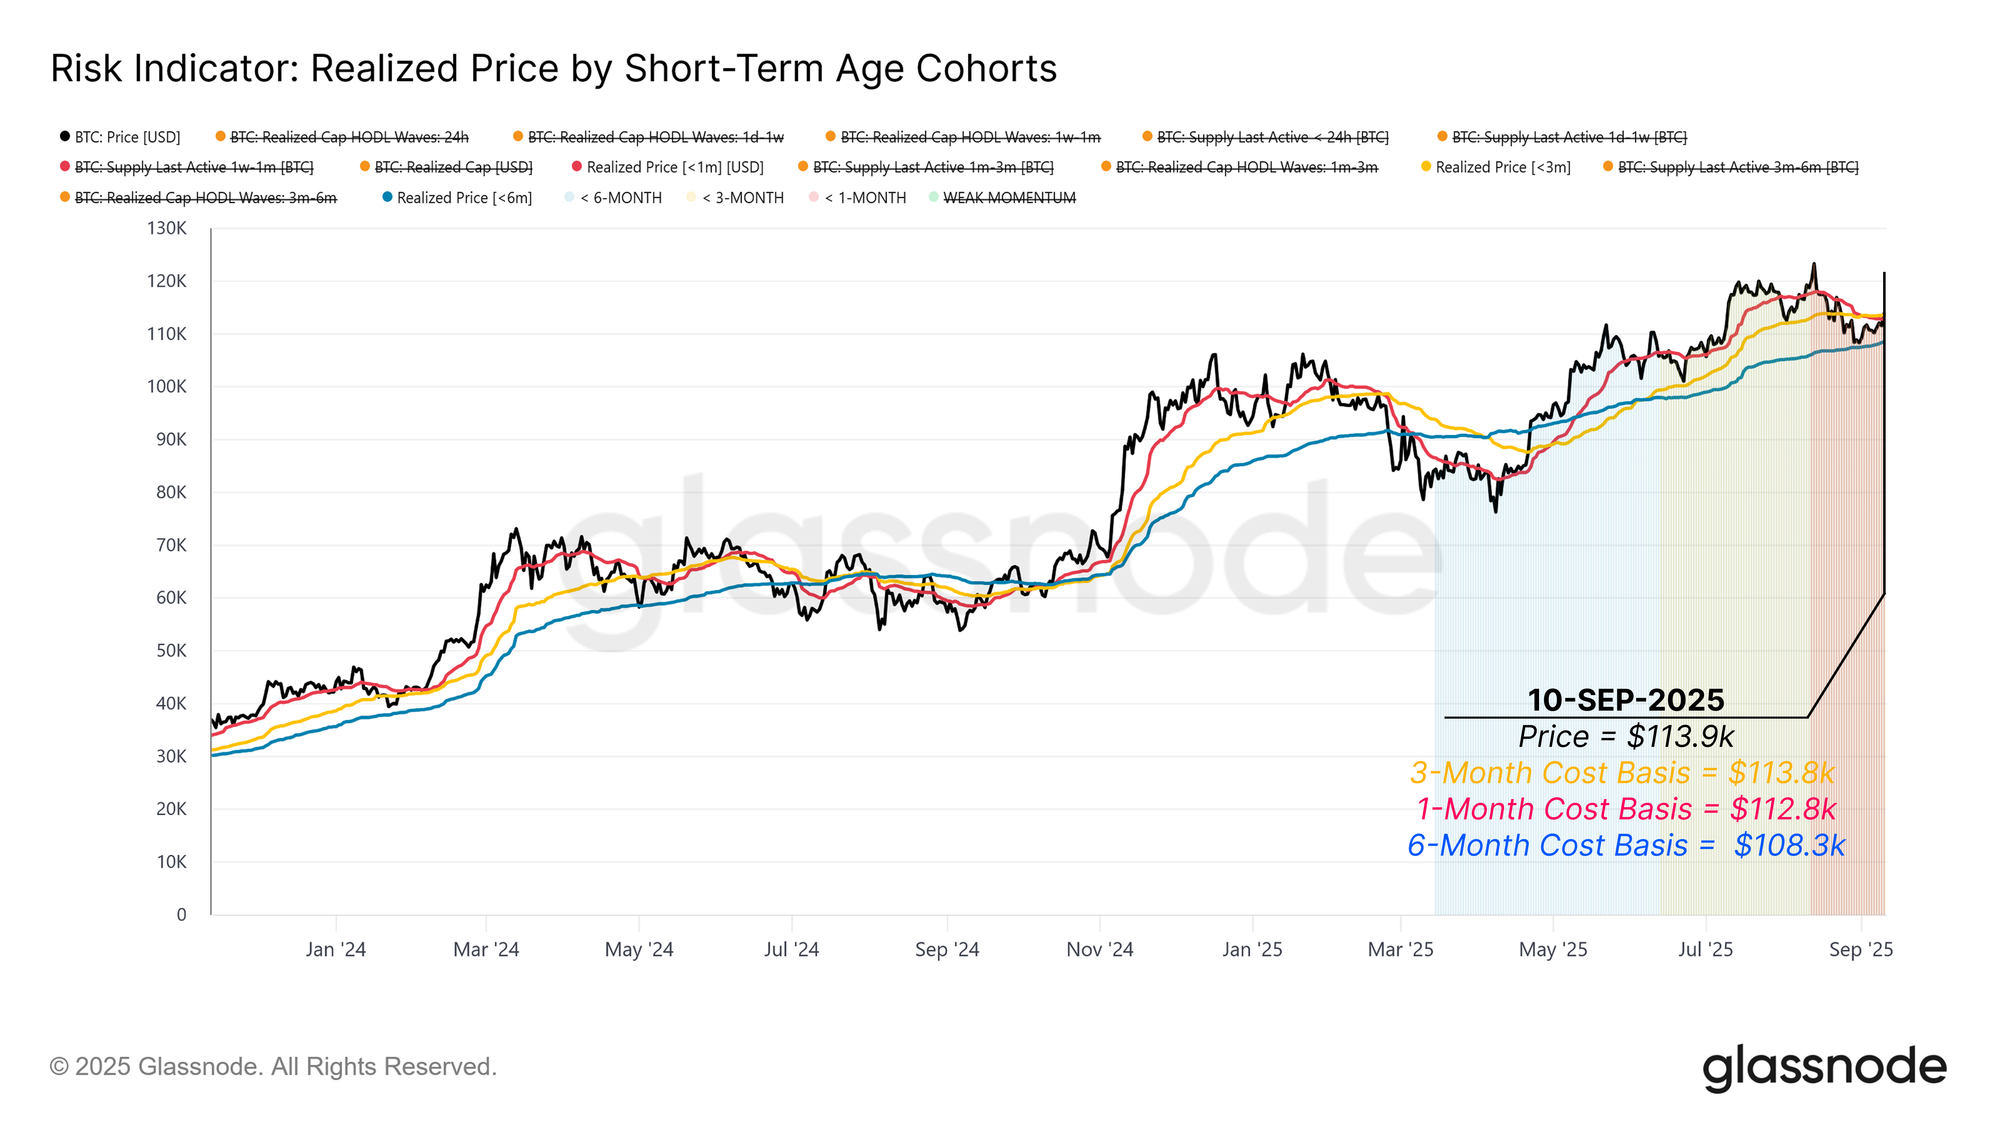
Based on the CBD heatmap, three distinct cohorts of investors are currently shaping price action:
- Top-buyers over the past three months, with a cost basis near $113.8k.
- Dip-buyers in the last month clustered around $112.8k.
- Short-term holders from the past six months, anchored near $108.3k.
These levels define the current trading range. Reclaiming $113.8k would return top-buyers to profit and fuel a bullish continuation. A breakdown below $108.3k, however, risks tipping short-term holders back into loss, potentially triggering renewed sell pressure and opening a path toward the next major supply cluster’s low band at $93k.
Live Chart
Profit-Taking by Seasoned Short-Term Holders
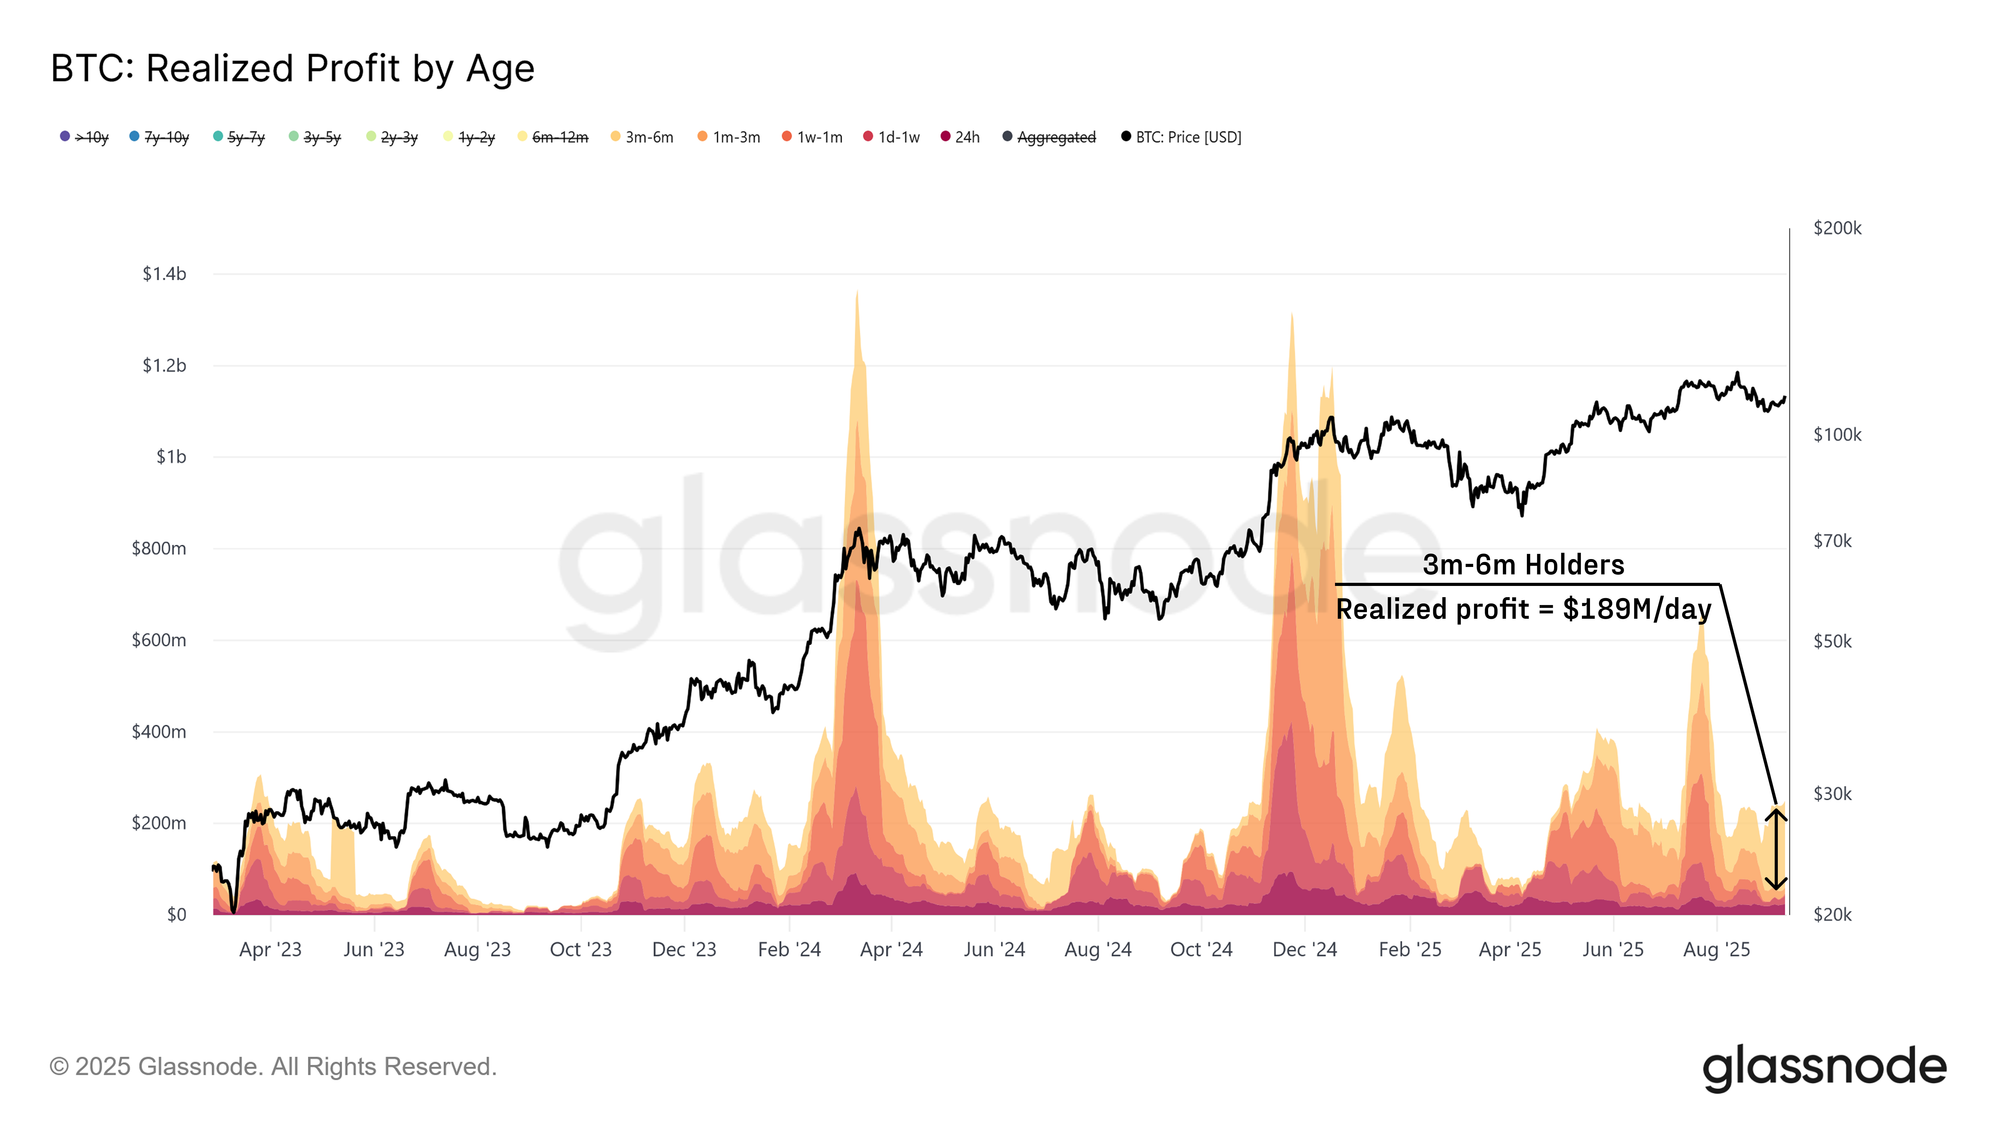
Having identified the immediate supply clusters around the current price shaping the range, we next consider how different holder cohorts behaved during the rebound from $108k to $114k.
While dip-buyers provided support, selling pressure came primarily from seasoned short-term holders. The 3–6 month cohort realized around $189M per day (14-day SMA), accounting for roughly 79% of all short-term holder profits. This suggests that investors who bought earlier over the February-May dip used the recent bounce to exit profitably, creating notable headwinds.
Live Chart
Top-Buyers Realizing Losses
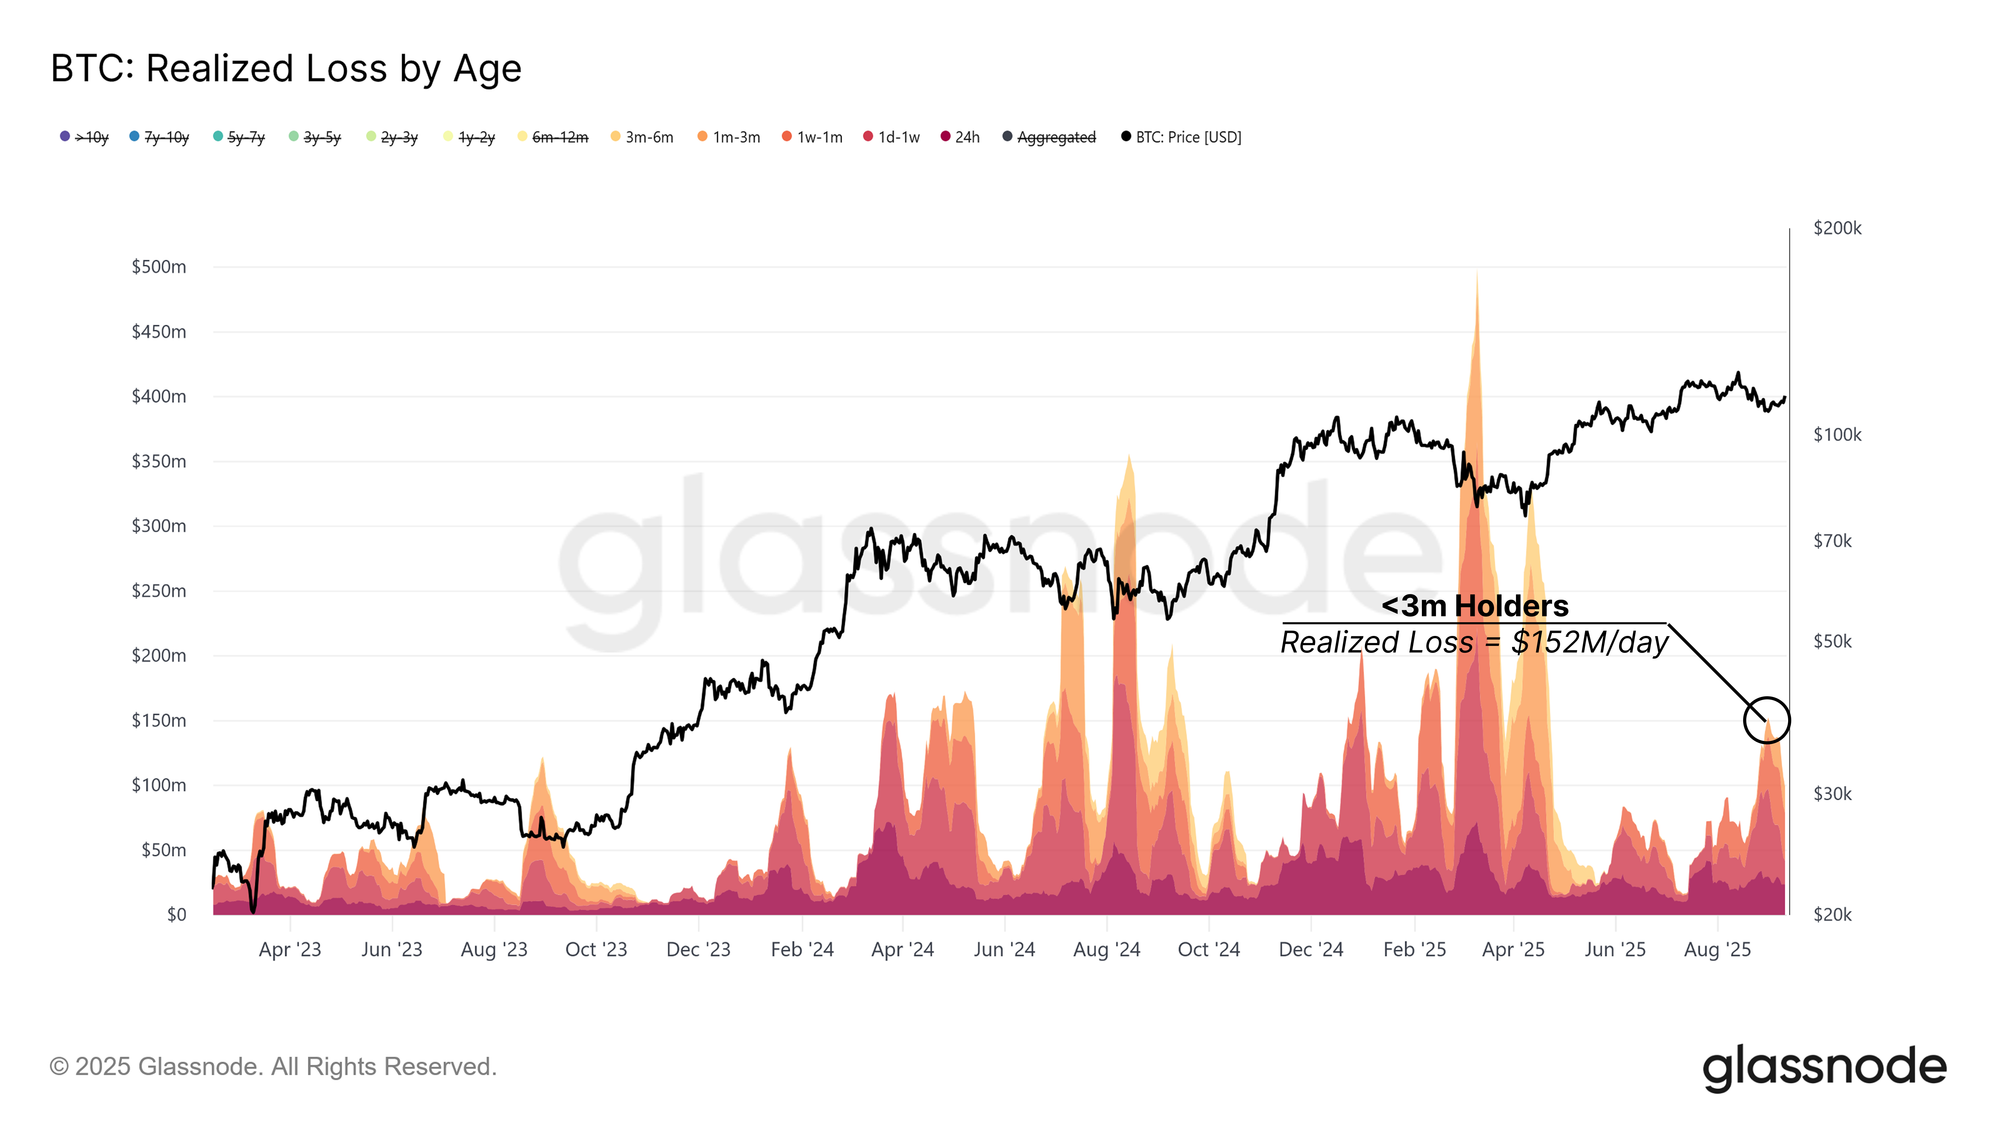
In addition to profit-taking by seasoned short-term investors, recent top-buyers also weighed on the market by realizing losses during the same rebound.
The up-to-3-month cohort realized losses of up to $152M per day (14-day SMA). This behaviour mirrors earlier stress periods in April 2024 and January 2025, when peak-buyers capitulated in a similar fashion.
For a mid-term rally to resume, demand must be strong enough to absorb these losses. Confirmation would come if the price stabilizes above $114k, restoring confidence and encouraging new inflows.
Live Chart
Liquidity Absorbing the Sell-Side
With both profit-taking and loss realization pressuring the market, the next step is to assess whether new liquidity is strong enough to absorb these sellers.
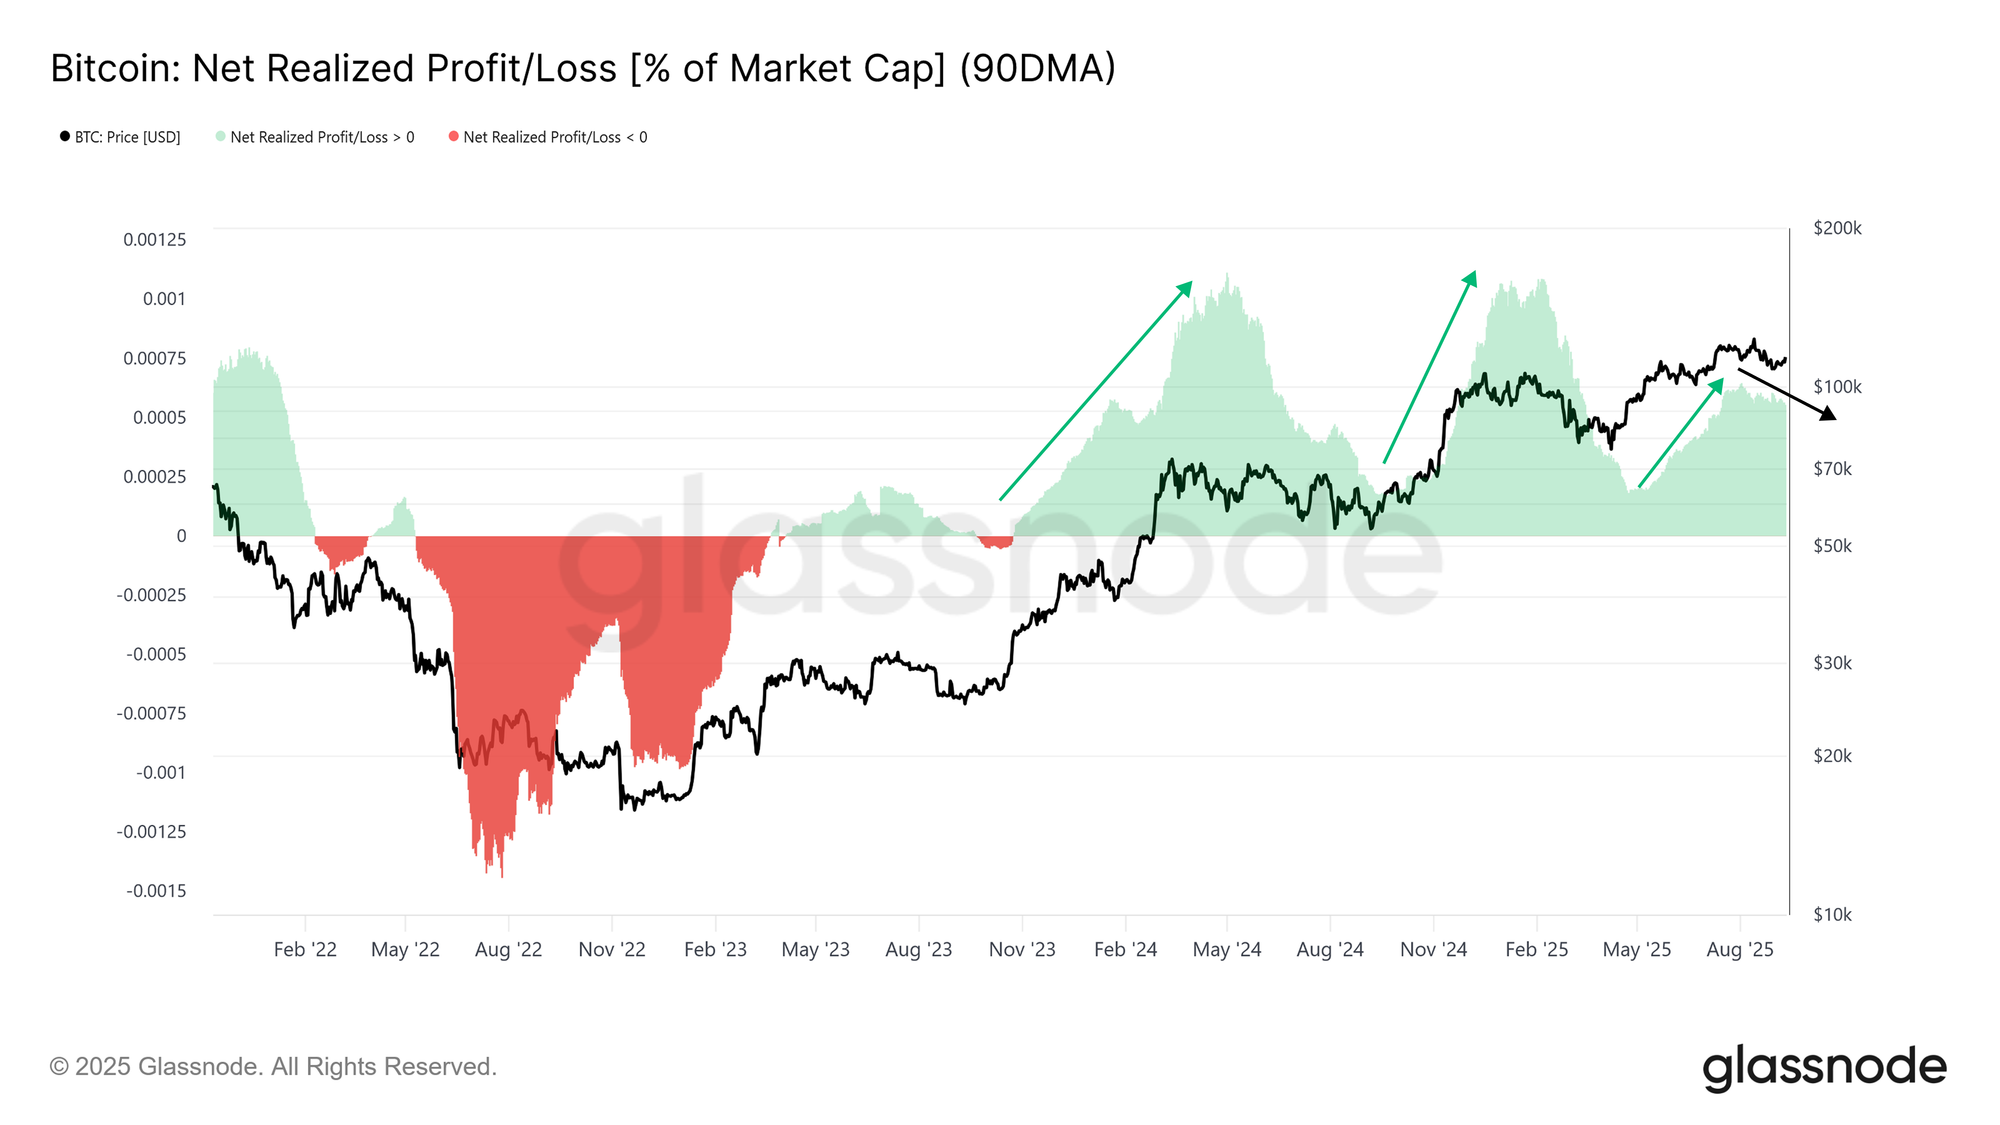
Net Realized Profit, expressed as a share of market cap, provides this measure. The 90-day SMA peaked at 0.065% during the August rally and has since trended lower. While weaker than at the peak, the current level remains elevated, suggesting inflows still provide support.
As long as price holds above $108k, the liquidity backdrop remains constructive. A deeper breakdown, however, could drain these inflows and stall further rallies.
Live Chart
TradFi Flows Losing Steam
Beyond on-chain flows, it is also critical to assess external demand via ETFs, which have been a major driver of this cycle.
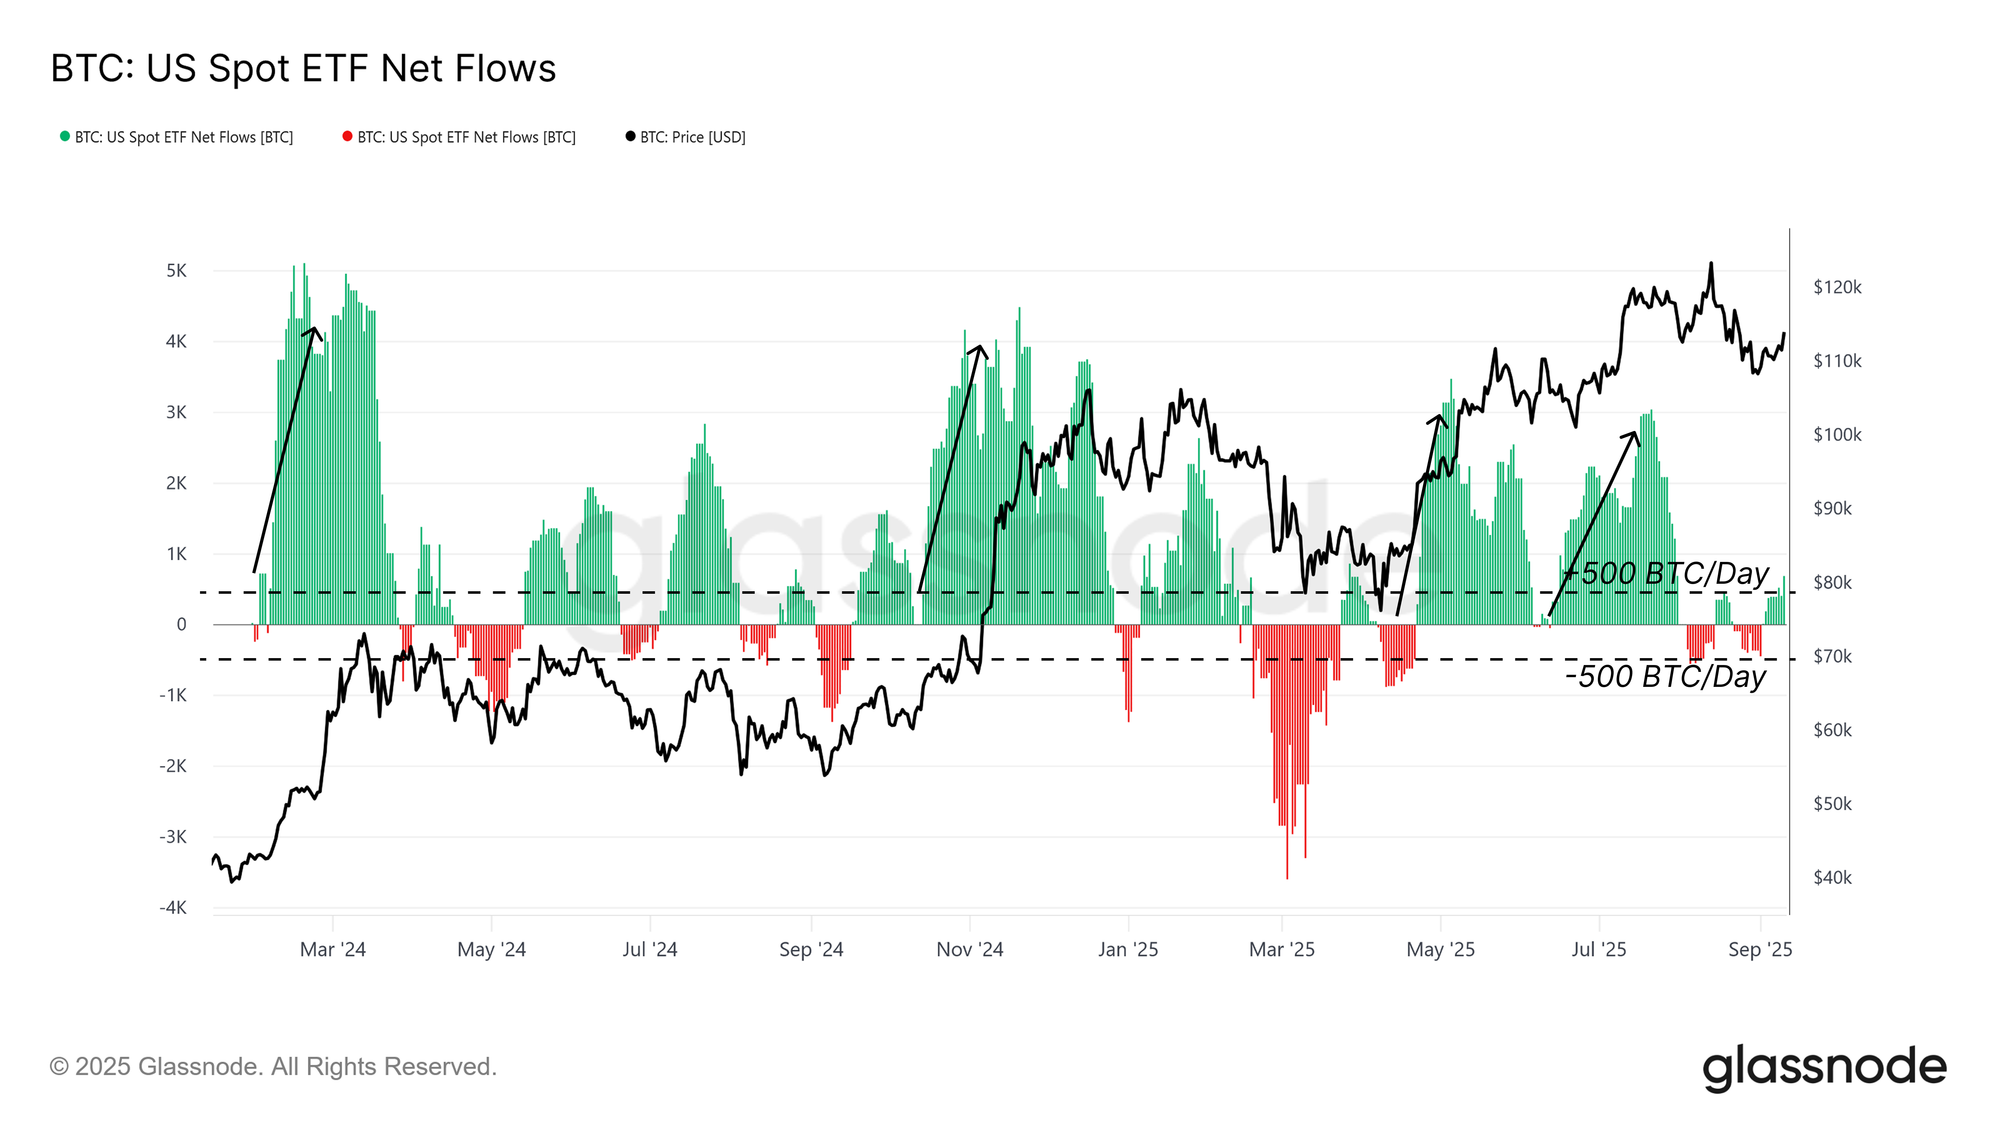
Since early August, US Spot ETF netflows have dropped sharply, now hovering near ±500 BTC per day (14-day SMA). This is far below the inflow intensity that supported earlier rallies in the current cycle, underscoring a loss of momentum from TradFi investors. Given the pivotal role ETFs have played in fueling upside, their slowdown adds fragility to the current structure.
Live Chart
Derivatives in the Spotlight
With on-chain liquidity softening and ETF demand fading, attention now shifts to derivatives markets, which often set the tone when spot flows weaken.
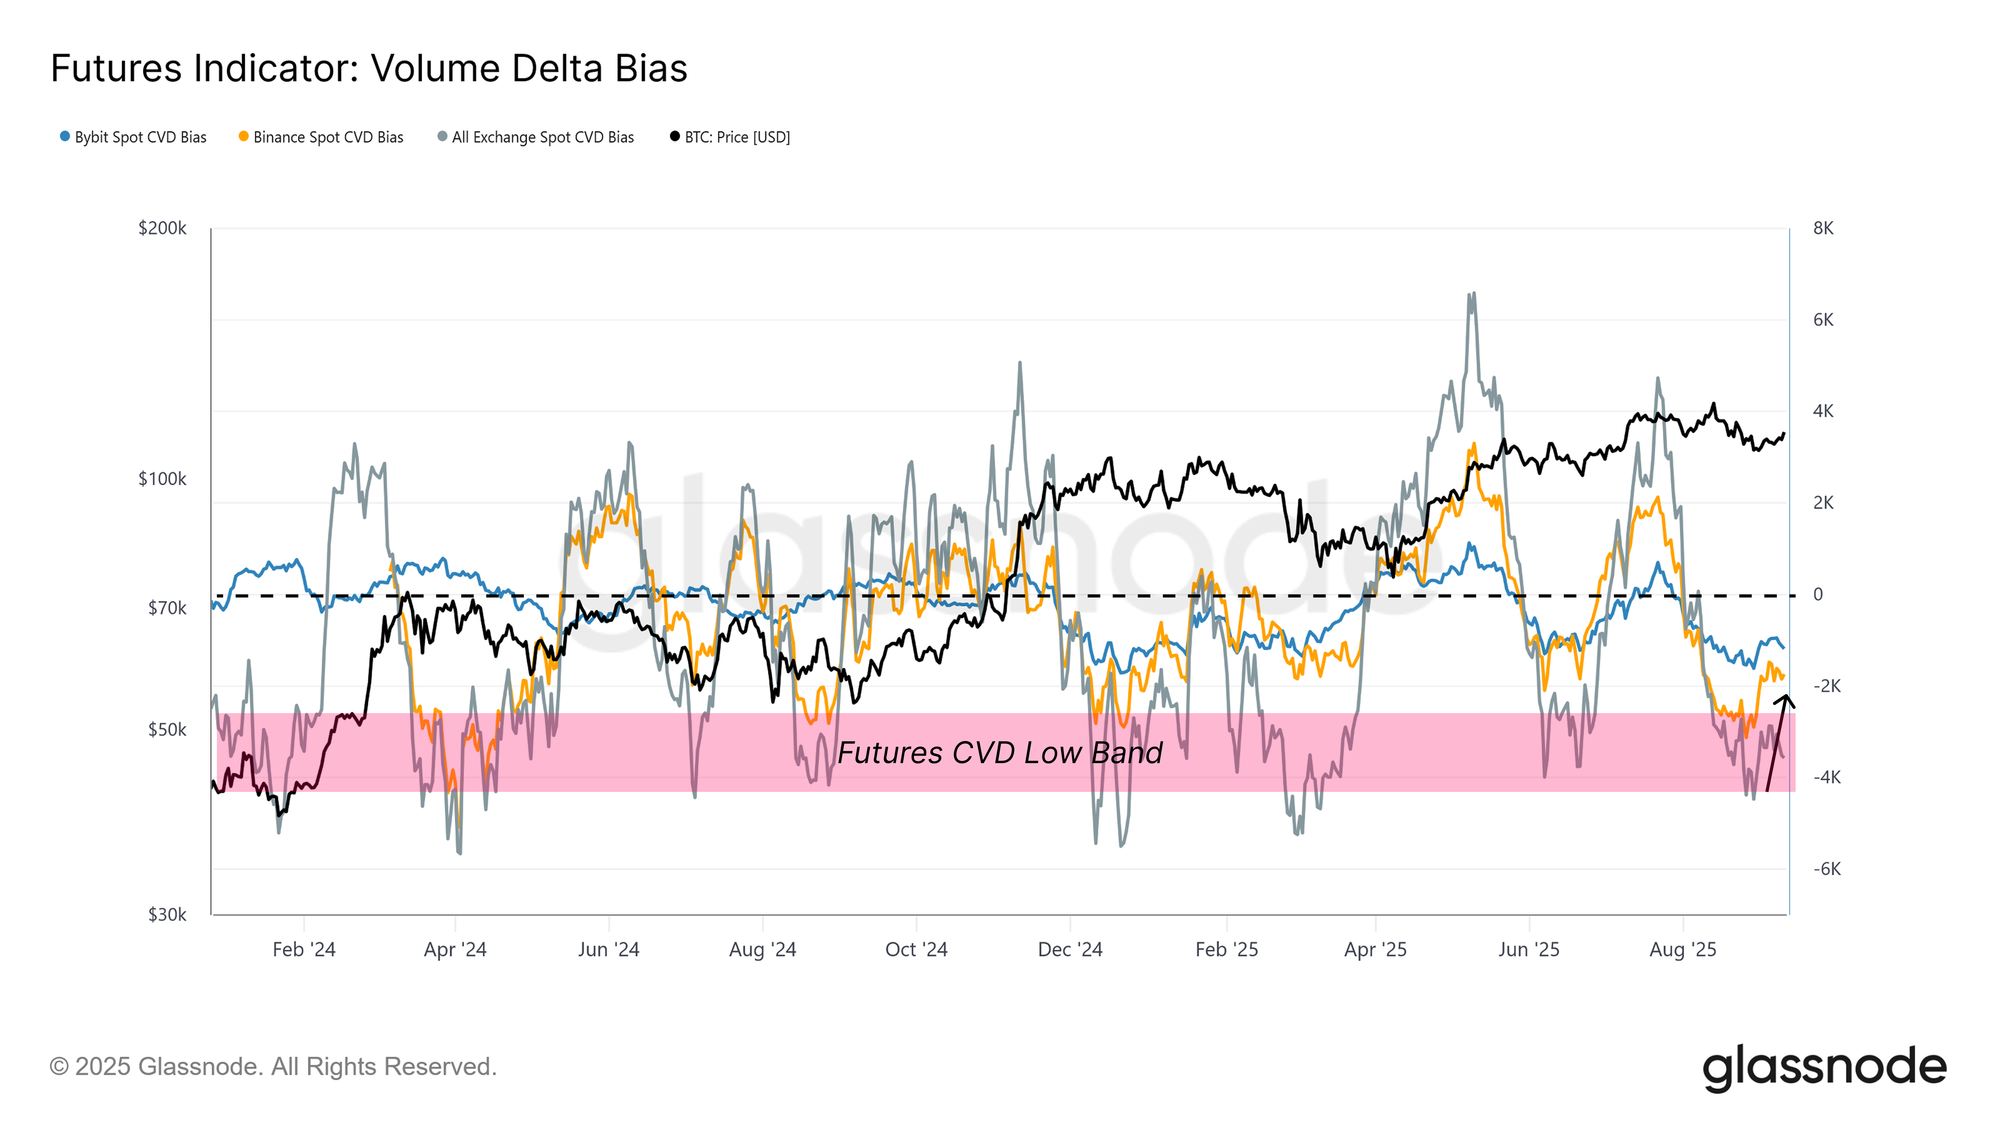
The Volume Delta Bias, measuring the deviation of cumulative volume delta from its 90-day median, recovered during the rebound from $108k, signalling seller exhaustion across venues like Binance and Bybit. This suggests that futures traders helped absorb recent sell pressure.
Going forward, the evolution of derivatives positioning will be critical to navigating the market in this low spot-liquidity environment.
Live Chart
A Balanced Futures Market
Looking deeper into futures, we find a market that appears balanced rather than overheated.
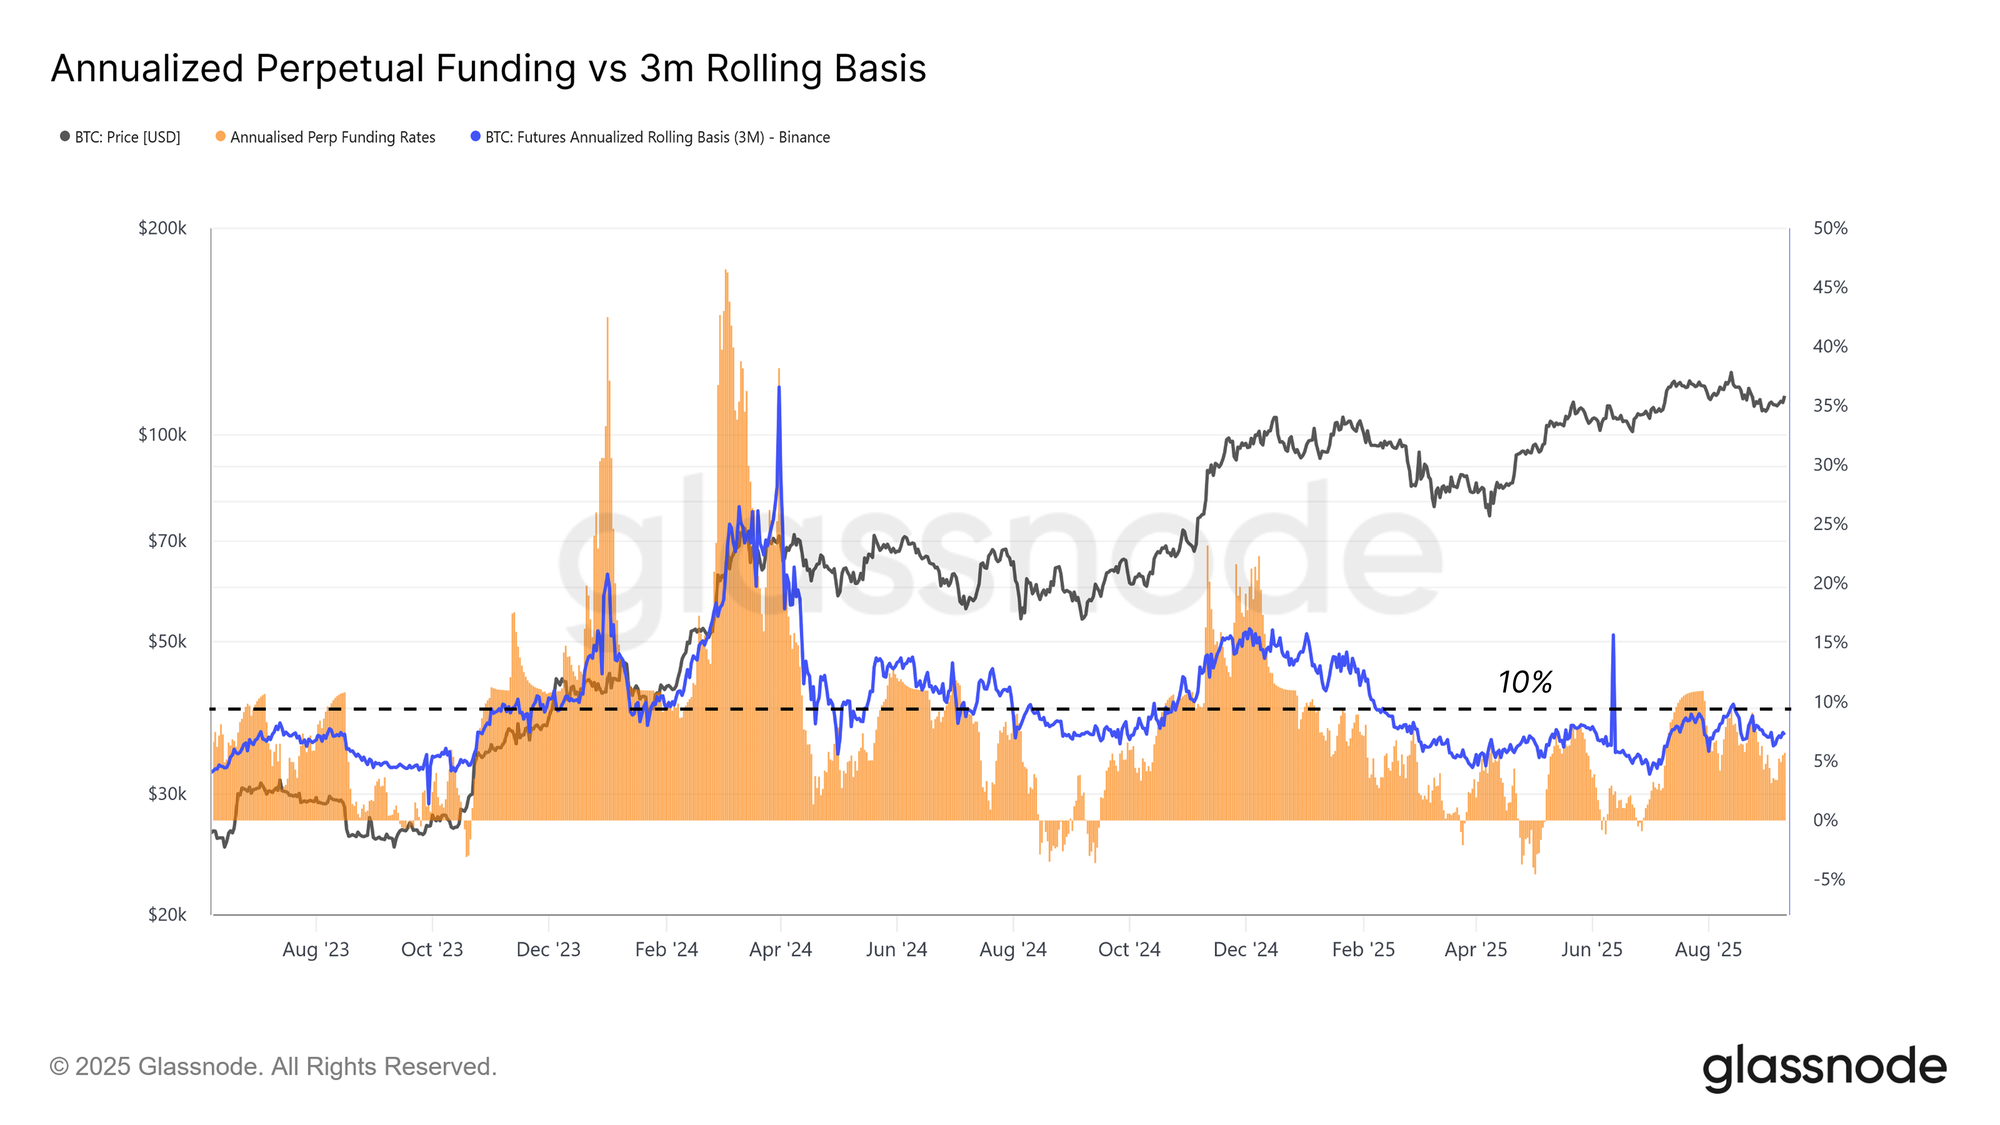
The 3-month annualized futures basis remains below 10% despite higher prices, reflecting steady demand for leverage without the extremes that often precede liquidations. This suggests a healthier structure, more consistent with accumulation than speculation.
Live Chart
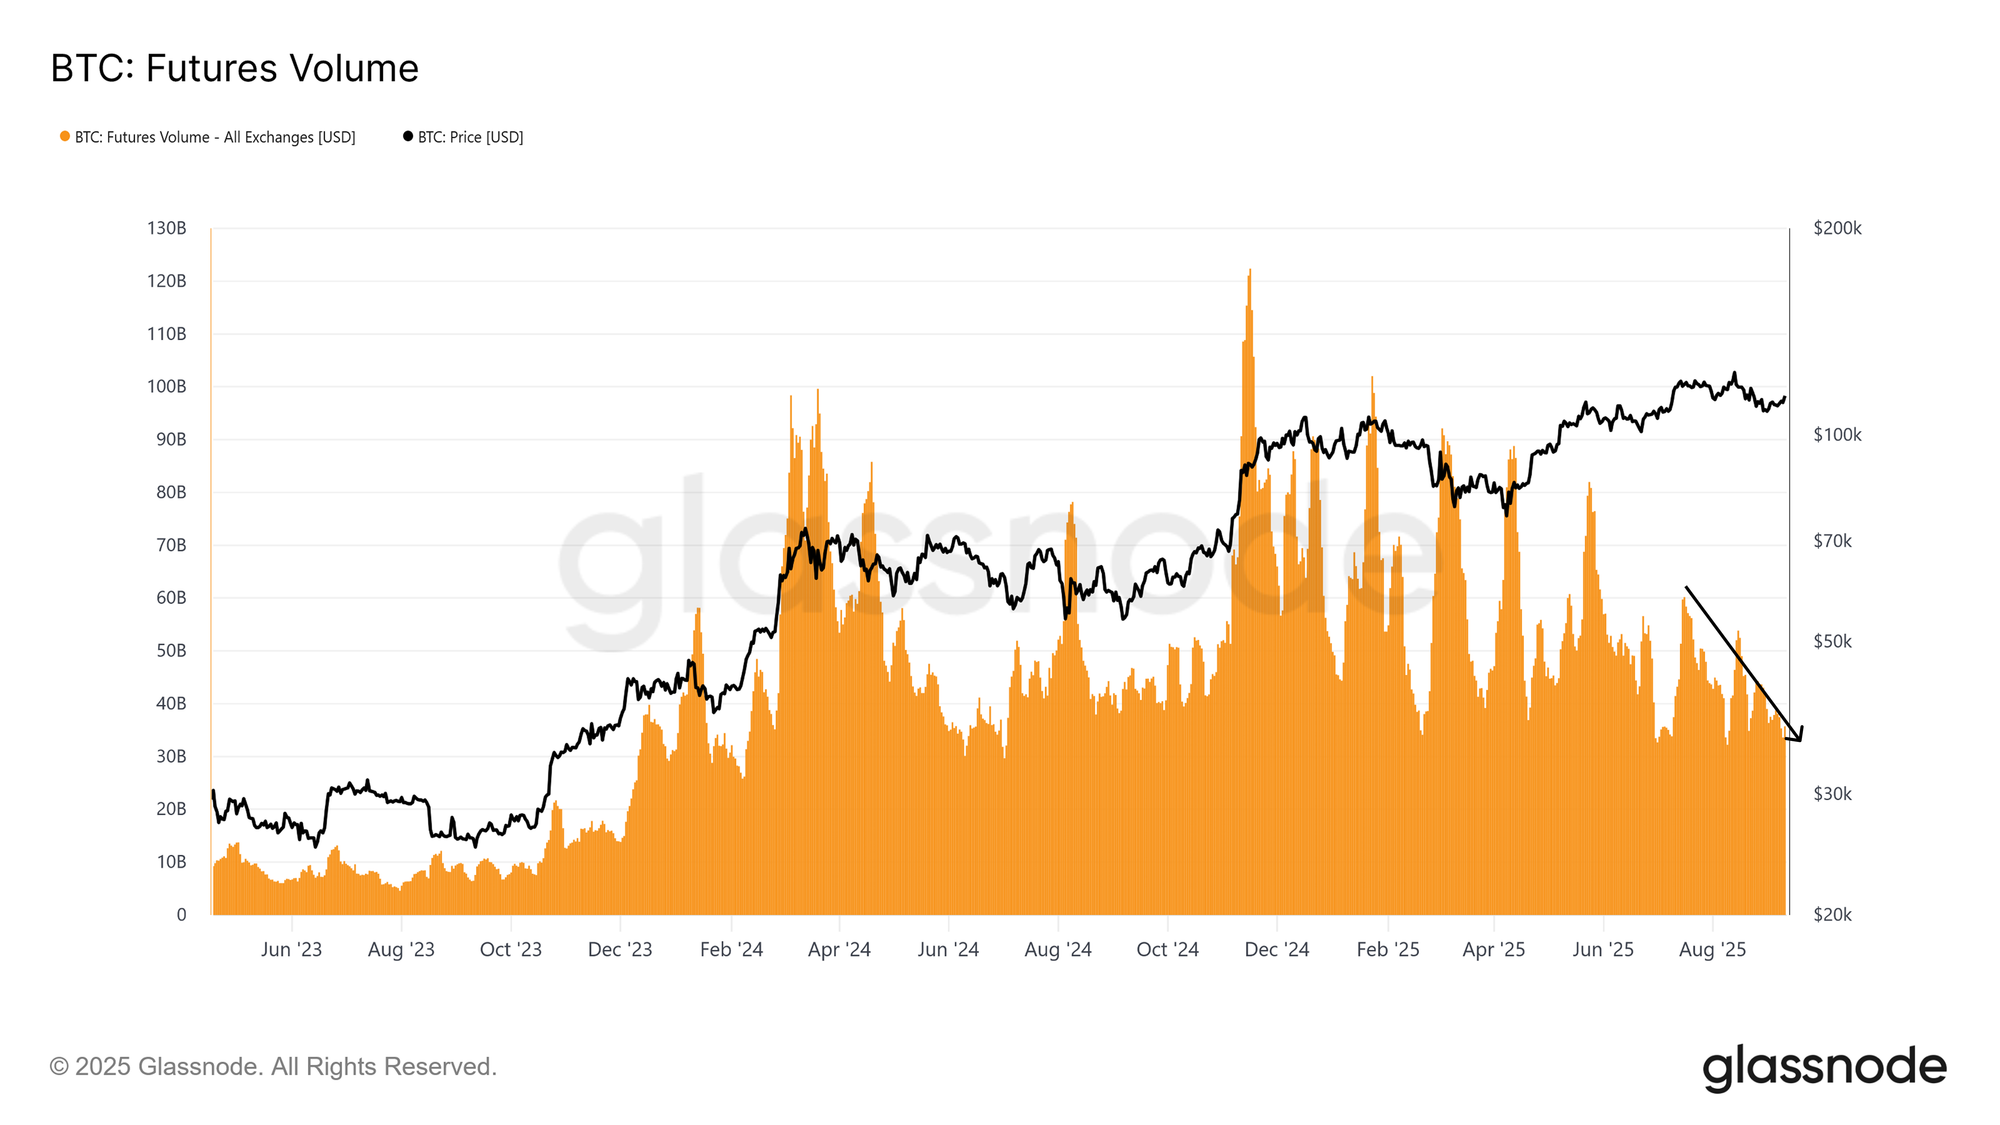
Perpetual futures volume also remains muted, aligning with the typical post-euphoric lull. The absence of aggressive leverage spikes points to an advance built on steadier foundations rather than speculative excess.
Live Chart
Options Growing Role in Risk Management
Finally, the options market provides further insight into how participants are managing risk and shaping exposure.
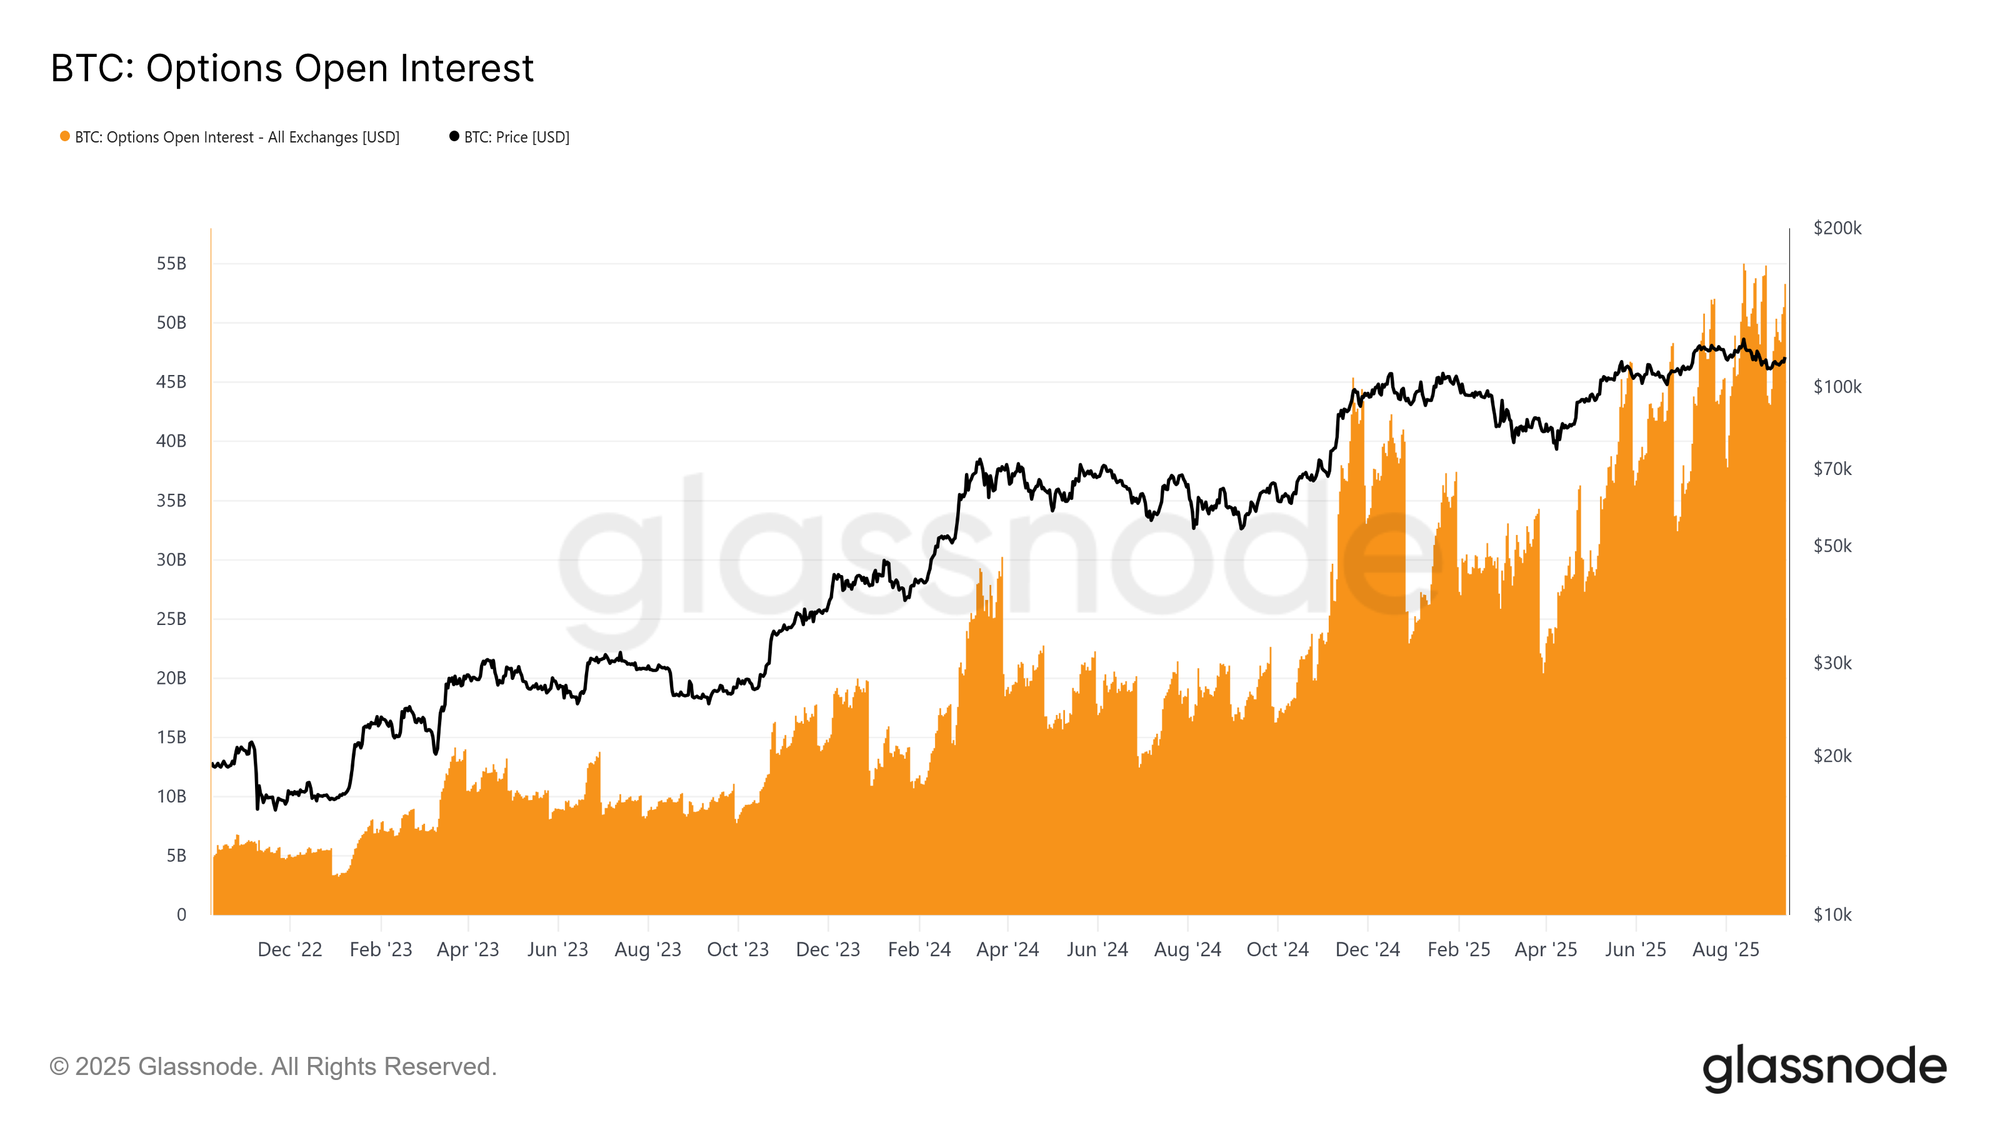
Bitcoin options open interest has reached record highs, reflecting their growing importance. With ETFs offering spot access, many institutions prefer options to manage risk through protective puts, covered calls, or defined-risk structures.
Live Chart
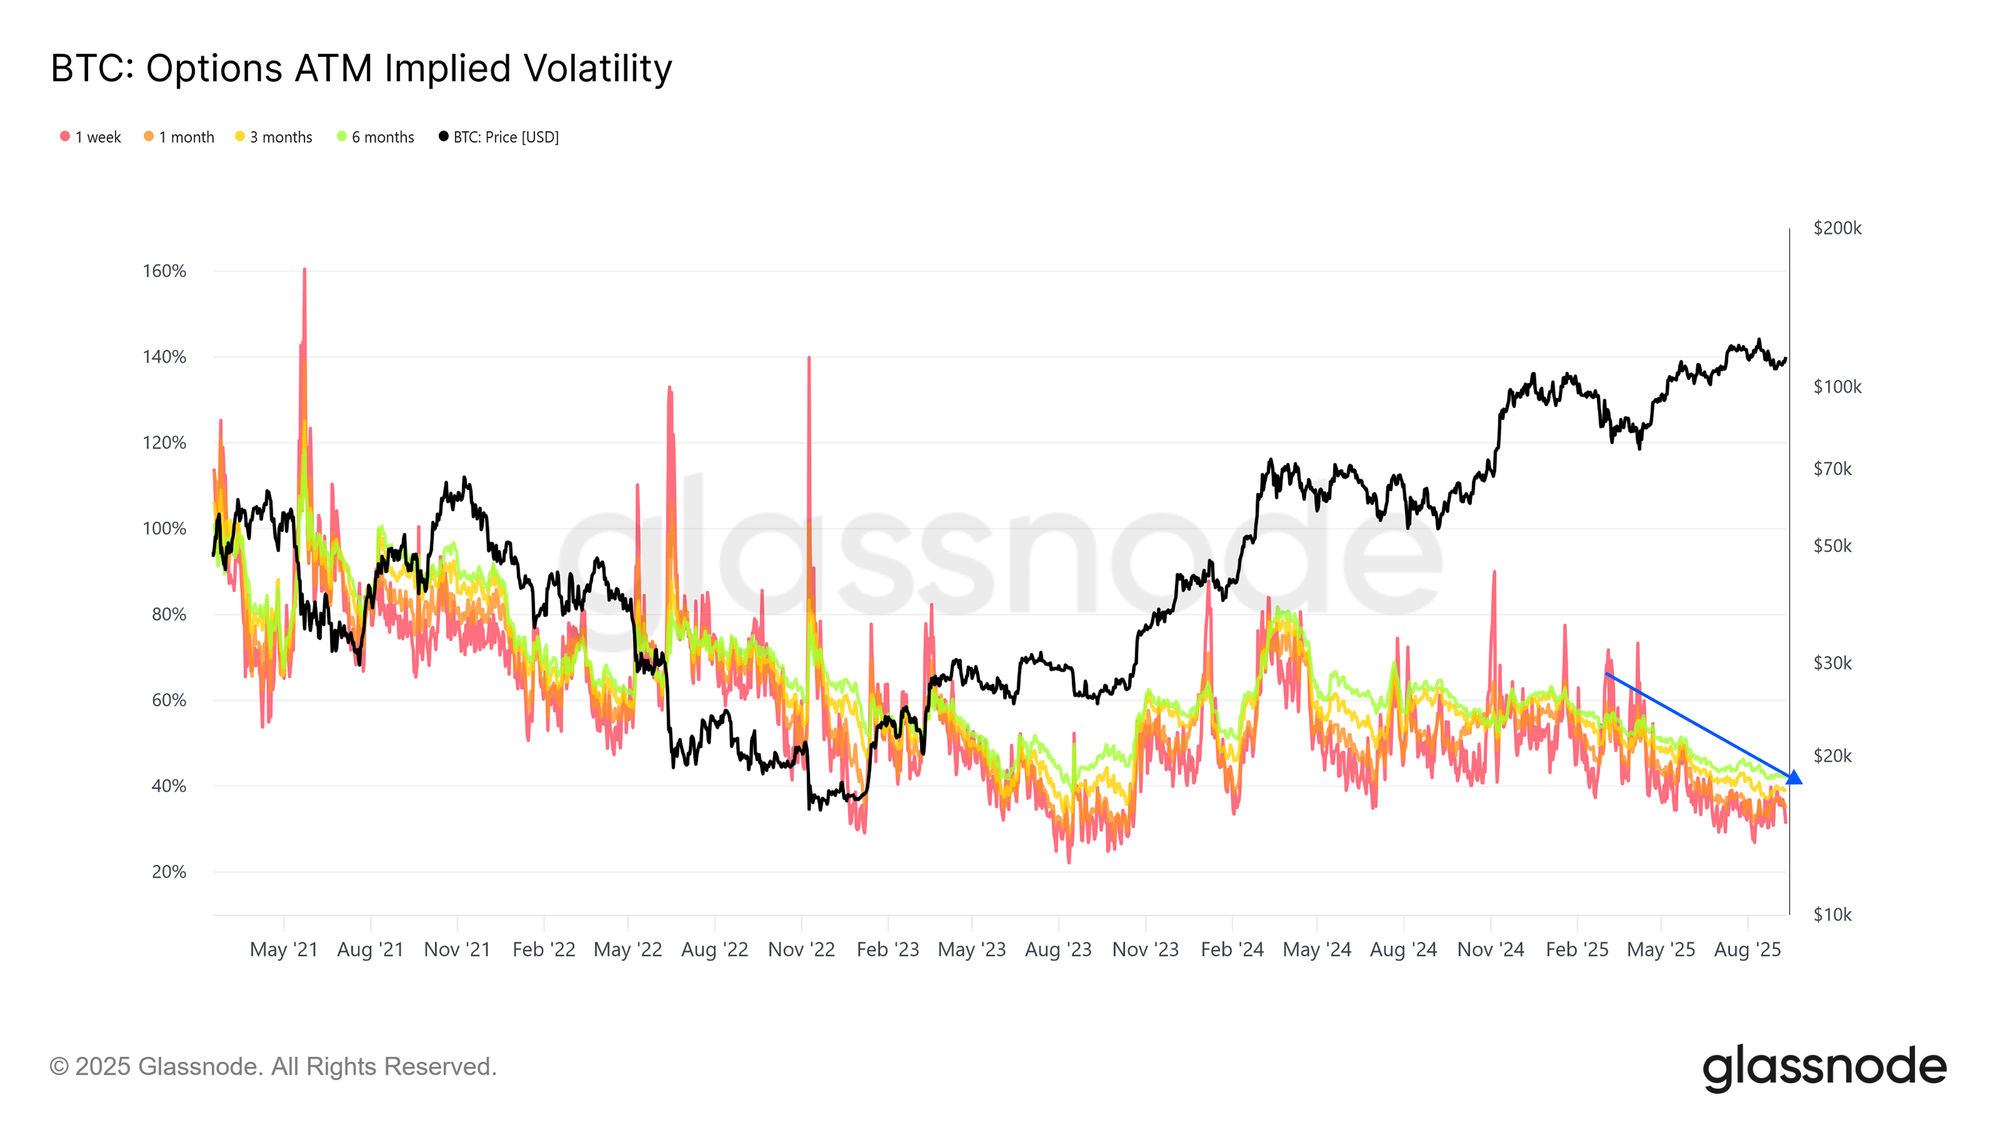
Implied volatility continues to decline, a sign of a more mature and liquid market. Volatility selling, a common TradFi strategy, has introduced steady downward pressure on implied levels, resulting in more stable price action compared with past cycles.
Live Chart
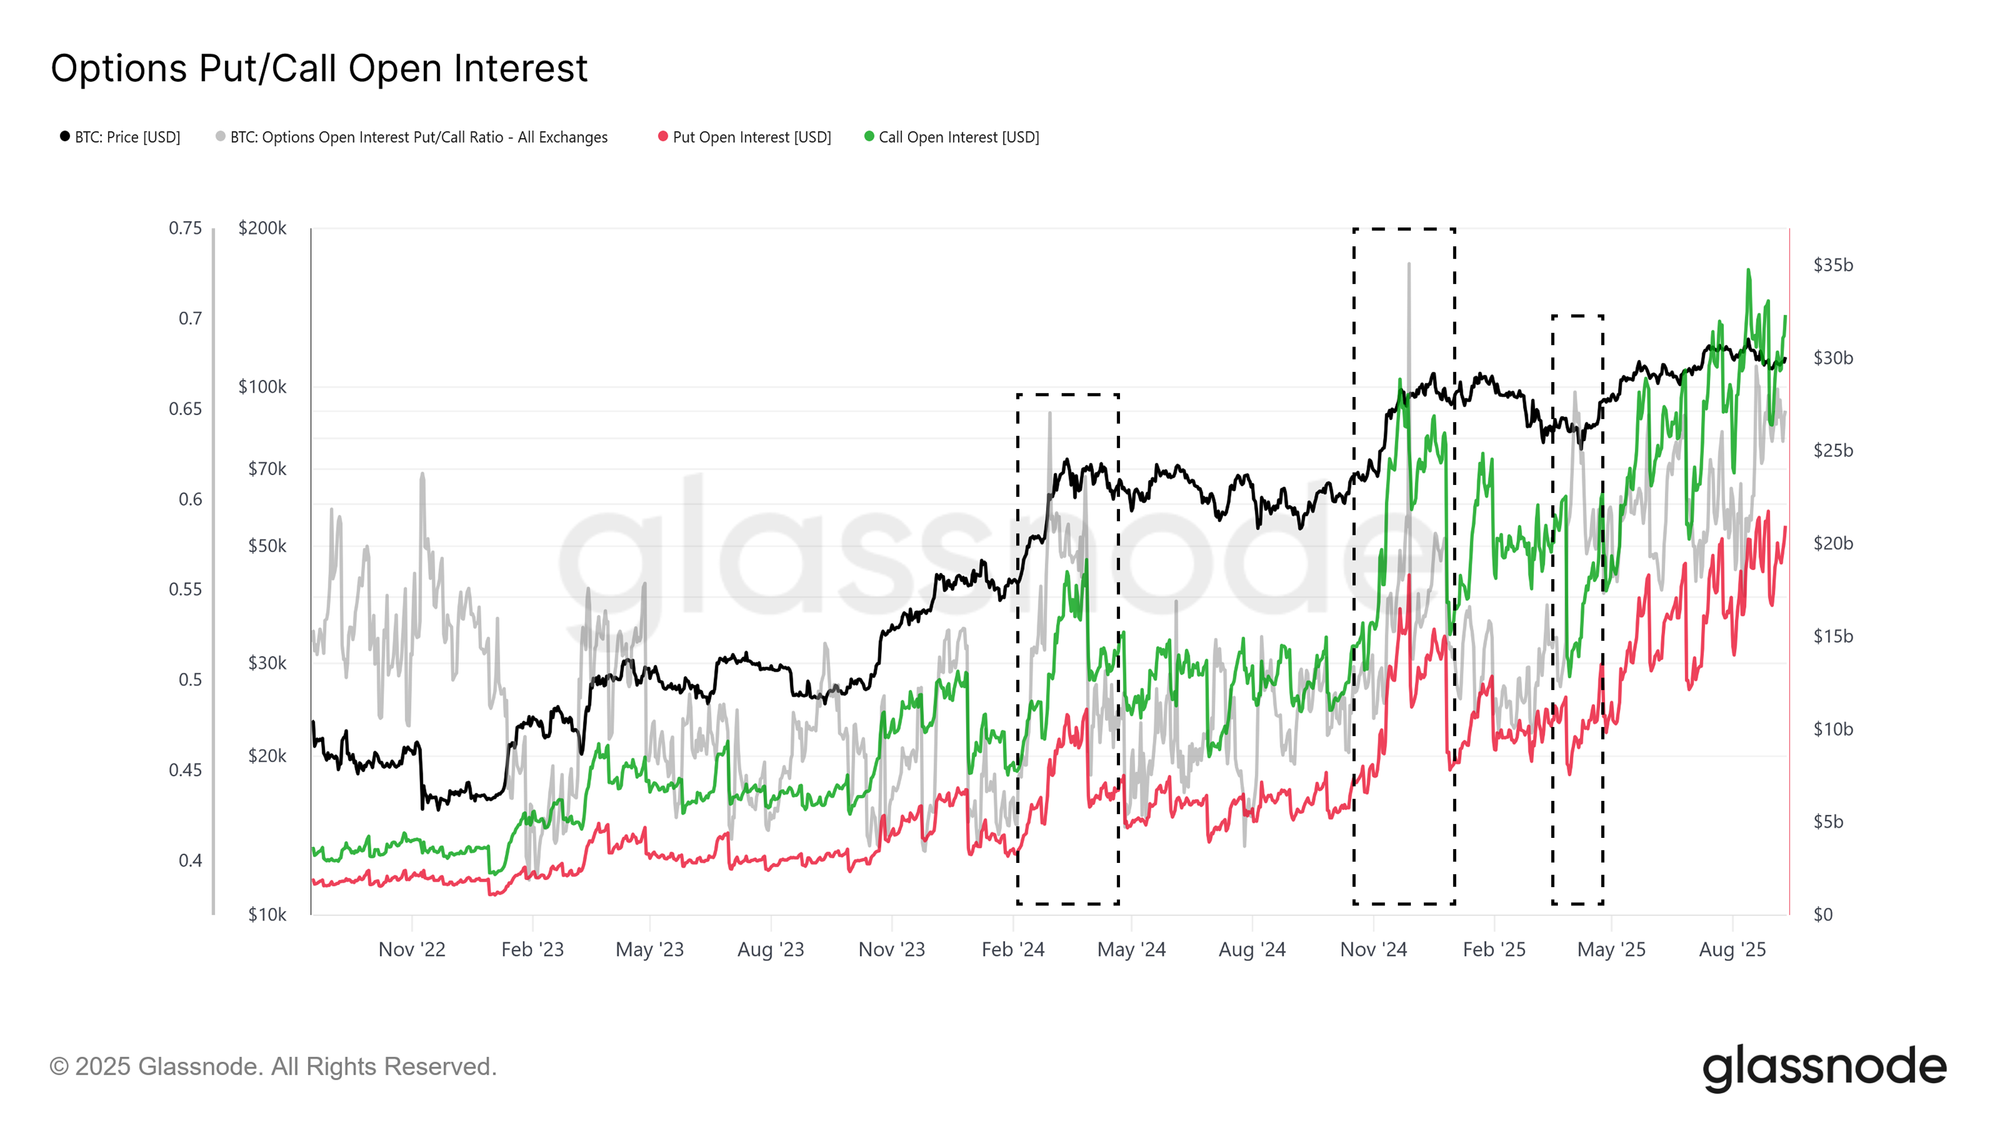
Open-interest composition shows a clear tilt toward calls over puts, particularly during a top-formation regime, highlighting a market that leans bullish while still managing downside risk. Together, these dynamics point to a healthier, more risk-managed market structure that could dampen both upcoming euphoric and bearish moves.
Live Chart
Conclusion
The Bitcoin market is currently defined by a delicate balance between sell-side pressure and weakening inflows. Profit-taking from seasoned short-term holders, combined with loss realization by recent top-buyers, has limited upside momentum and left the $110k–$116k range as the dominant battleground.
On-chain liquidity remains constructive but is trending lower, while ETF flows — once the cornerstone of this cycle’s upside — have lost intensity. As a result, derivatives markets have taken on greater importance, with futures and options activity helping to absorb selling and shape price direction. Encouragingly, both futures basis and options positioning reflect a more balanced structure than in past overheated phases, pointing to a market advancing on firmer footing.
Looking forward, the ability to reclaim and hold above $114k will be critical in restoring confidence and drawing in fresh inflows. Failure to do so risks renewed stress for short-term holders, with $108k and ultimately $93k as key downside levels. In short, Bitcoin sits at a crossroads, with derivatives support holding the structure together while broader demand must strengthen to fuel the next sustained rally.
Disclaimer:
- This article is reprinted from [insights.glassnode]. All copyrights belong to the original author [Chris Beamish, CryptoVizArt, Glassnode]. If there are objections to this reprint, please contact the Gate Learn team, and they will handle it promptly.
- Liability Disclaimer: The views and opinions expressed in this article are solely those of the author and do not constitute any investment advice.
- Translations of the article into other languages are done by the Gate Learn team. Unless mentioned, copying, distributing, or plagiarizing the translated articles is prohibited.