Gate Research: Ethereum Institutional Bets Reach New High, Emerging Chains Attract Capital Rapidly|Web3 On-Chain Data Insights for August 2025
Abstract
- On-chain ecosystems are increasingly diverging: Solana maintains its dominance in high-frequency interactions, while Ethereum solidifies its position as the high-value chain. Capital flows are increasingly concentrated among leading networks, forming a “winner-takes-all” pattern. Emerging chains show strong momentum, whereas some sidechains and L2s are under capital outflow pressure.
- Ethereum remains the core public chain, supported by over $2 billion in net capital inflows and record highs in both price and institutional allocation. While emerging chains are attracting capital and rising rapidly, sidechains like Polygon are seeing significant capital outflows, reinforcing the “winner-takes-all” market structure.
- Bitcoin’s capital inflow slowed after hitting its $124,000 peak, but selling pressure remains mild and cost-basis support is strong. Unrealized losses are still at low levels, indicating the current pullback is more likely a temporary correction rather than a trend reversal.
- Aave continues to dominate the decentralized lending sector, and with the launch of the Horizon platform, it has entered the institutional-grade RWA collateral lending market—further strengthening its core role in bridging DeFi and traditional finance.
- BIO is rapidly rising in the DeSci sector with its V2 upgrade and ecosystem expansion. Both token market cap and staking volume have surged in tandem, and on-chain capital is accelerating into the project, showcasing its strong potential to lead the decentralized scientific research movement.
On-Chain Insights Overview
Overview of On-Chain Activity and Capital Flow
In addition to analyzing overall on-chain capital flows, we further selected several key on-chain activity metrics to assess the actual usage and engagement levels across blockchain ecosystems. These indicators include daily transaction volume, daily gas fees, daily active addresses, and net cross-chain bridge flows—capturing user behavior, network utilization intensity, and asset mobility. Compared to observing capital inflows and outflows alone, these native on-chain data points provide a more comprehensive reflection of fundamental shifts in blockchain ecosystems. They help determine whether capital flows are accompanied by genuine user demand and growth, enabling identification of networks with sustainable development potential.
Transaction Volume Analysis: Ethereum Hits New Highs, Solana Remains the Leader
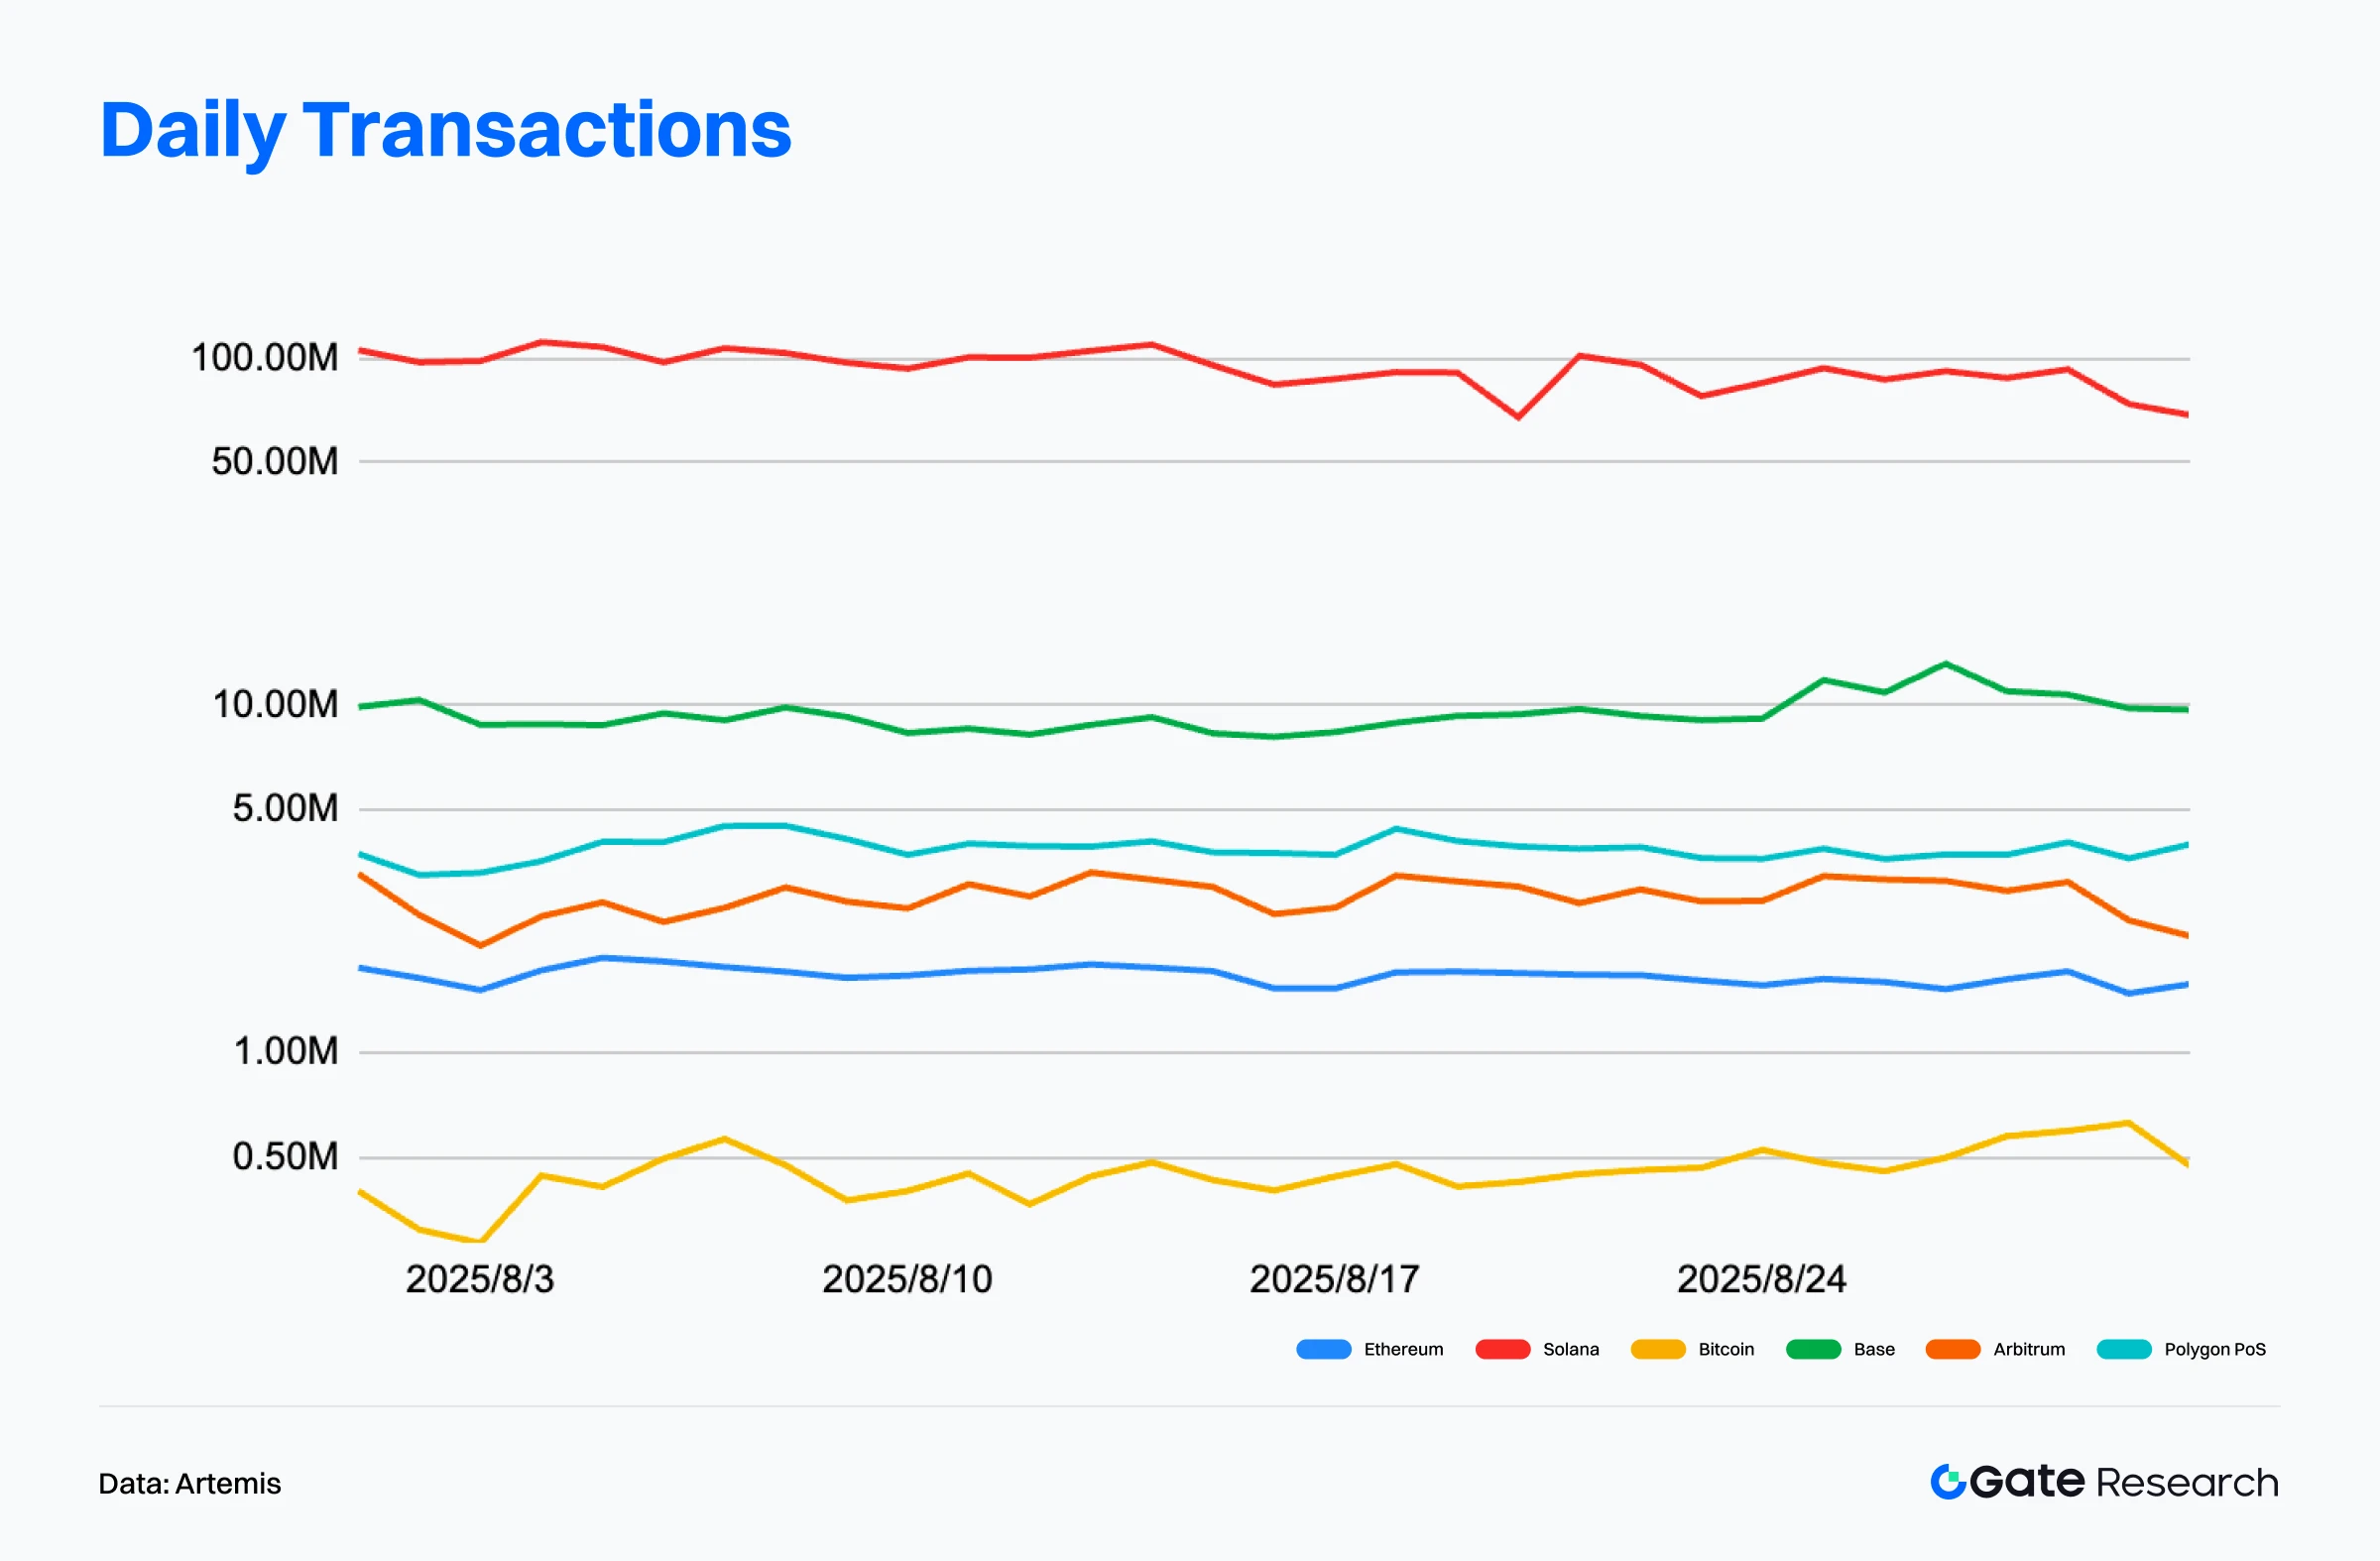
According to Artemis data, as of August 31, 2025, Solana maintained its lead among major public chains with over 29 billion monthly transactions, averaging 90–100 million daily transactions. Despite slight fluctuations at the end of the month, its overall activity remained far above other chains, showcasing the strength of its high-frequency interaction model and robust ecosystem infrastructure.【1】
Meanwhile, Ethereum’s on-chain transaction volume hit new highs for two consecutive months, surpassing 51.77 million transactions—the highest in nearly four years. This indicates that, despite the offloading of activity to Layer 2 networks, Ethereum’s mainnet remains vibrant. Although high transaction value and gas fees remain limiting factors, Ethereum continues to exhibit a healthy transaction structure with increasingly synergistic interactions between the mainnet and Layer 2.
According to DefiLlama, Ethereum-based DEXs recorded a historic $140.1 billion in trading volume in August 2025. Total Value Locked (TVL) stood at $92.58 billion, still about 17% below its 2021 peak. The rise in both trading volume and active users suggests improved capital efficiency and a shift from passive asset locking to more active trading and liquidity engagement—a trend structure of “trading activity outpacing TVL recovery.”
Overall, Solana continues to dominate on-chain transaction activity with its high-frequency, high-stickiness interaction model. Base is steadily securing its position as a major Layer 2 transaction hub, while Ethereum demonstrates classic resilience and value-carrying capacity through its dual approach of mainnet and L2 coordination. The on-chain transaction ecosystem is structurally diverging into “high-frequency chains” and “value-focused chains”.【2】
Active Address Analysis: Solana Leads, Ethereum Reaches New Highs
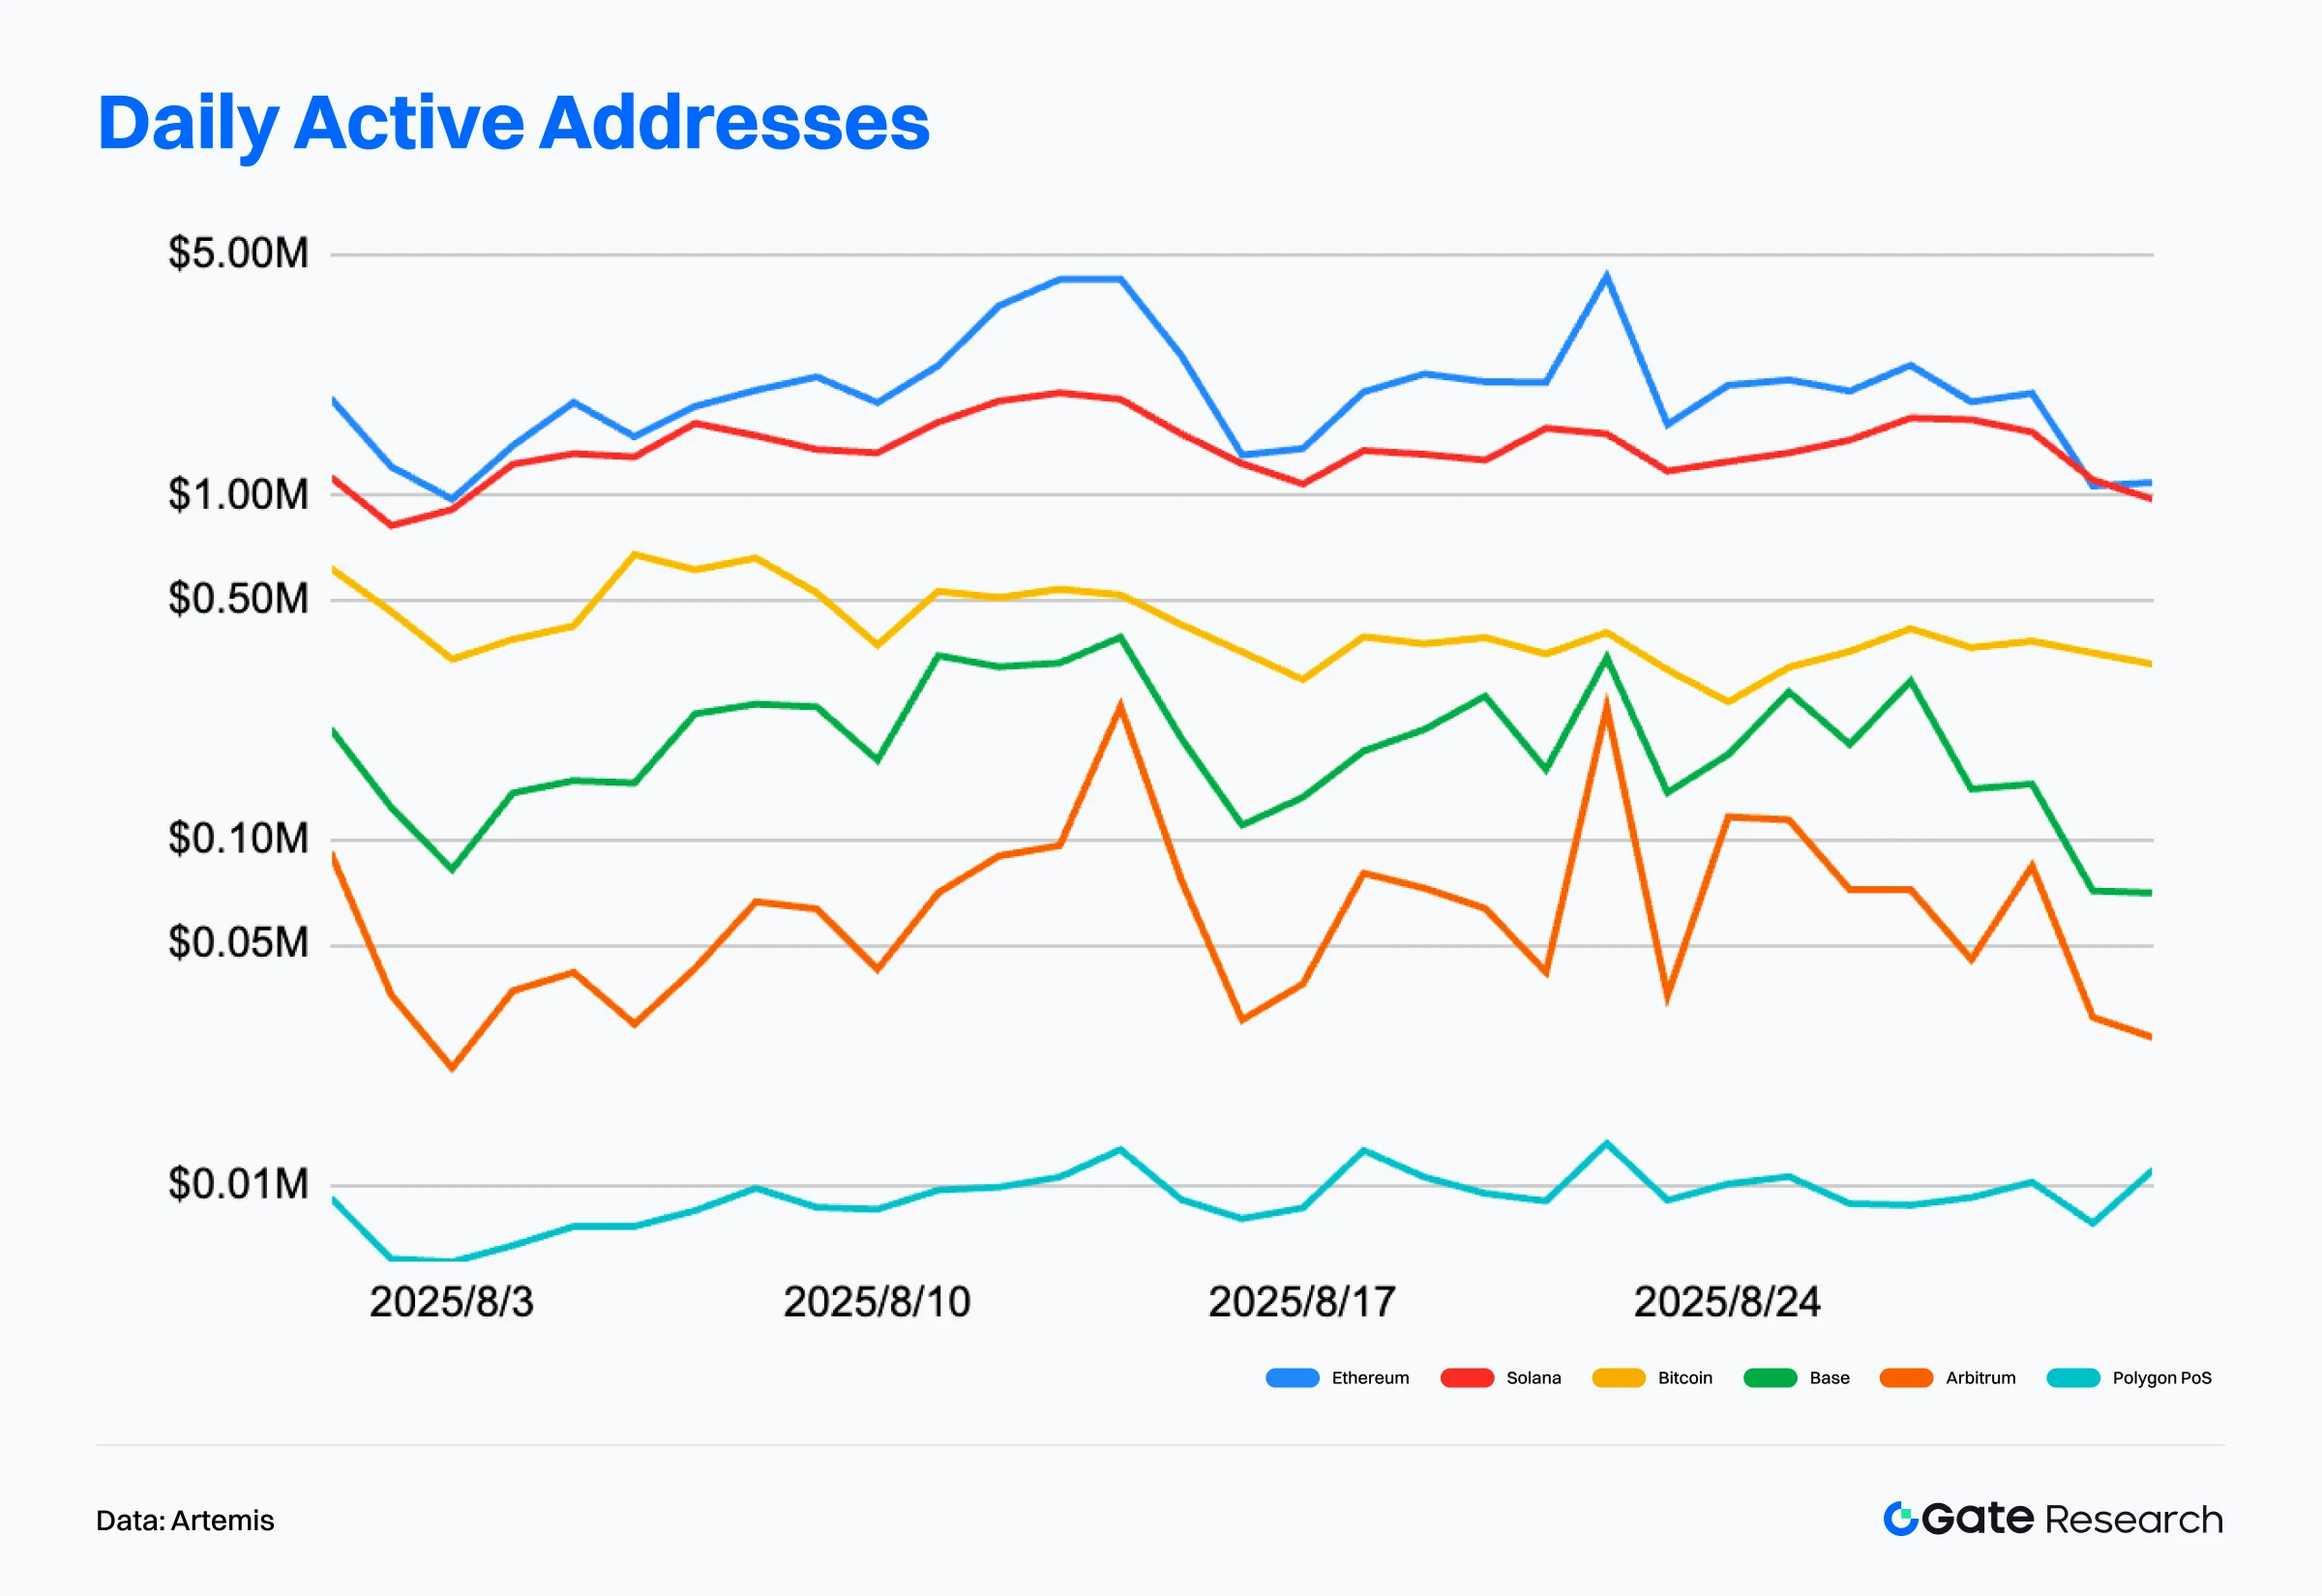
According to Artemis, Ethereum’s mainnet averaged ~543,000 daily active addresses as of August 31, 2025, steadily rising, with over 16 million monthly active addresses—a new all-time high. This reflects its expanding user base.
Solana maintained an absolute lead in active addresses, with 3.587 million daily active users, indicating strong stickiness and high-frequency usage scenarios. Base followed in second place with 1.206 million daily addresses, reflecting its success in ecosystem development and application onboarding.【3】
In sum, Solana continues to lead in user activity, Base is rising rapidly, and Ethereum, through its “Mainnet + Layer 2” structure, forms a more complete interaction ecosystem. The user structure across blockchains is now clearly segmented into “high-frequency user chains” and “value-carrying chains”, with increasingly distinct ecosystem roles.
On-Chain Fee Revenue Analysis: Ethereum Dominates High-Value Use Cases, Solana Holds Strong
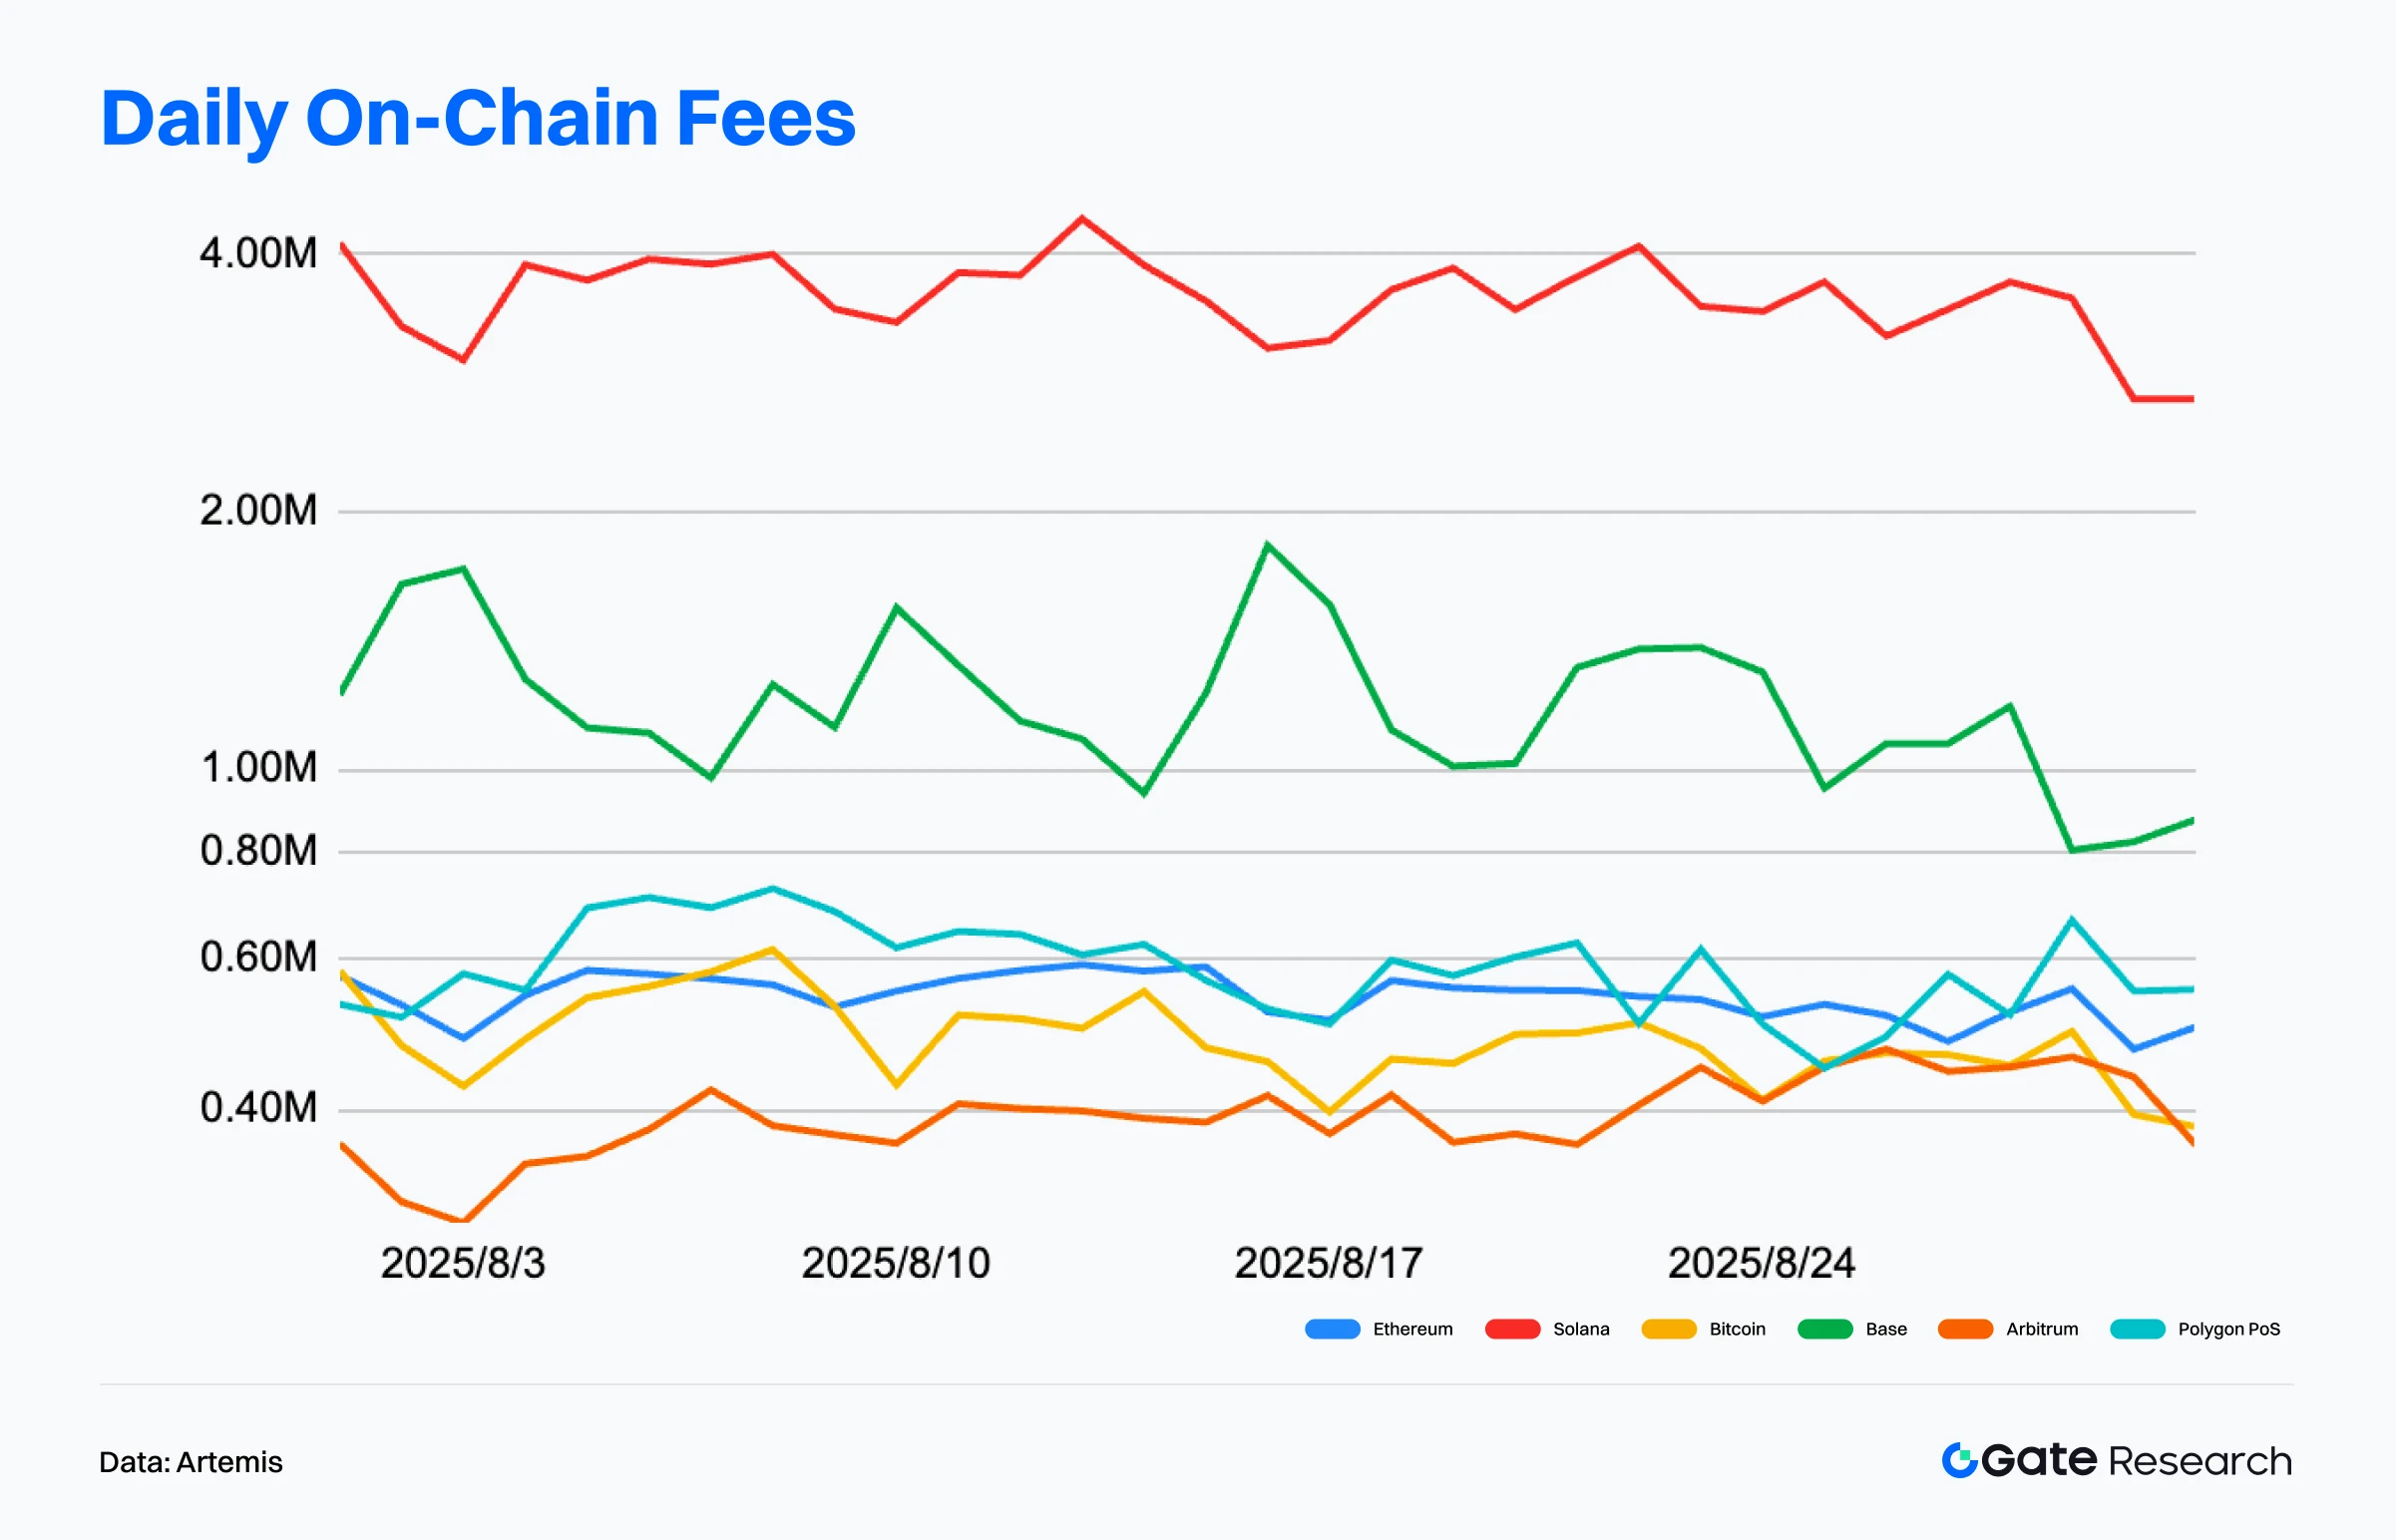
According to Artemis data, Ethereum’s total on-chain fee revenue reached approximately $65 million in August 2025. Though slightly lower than the previous month, it remained far ahead of all other public chains. A single-day peak of nearly $5 million mid-month highlighted strong transaction demand from DEX activity and new project deployments.【4】
Solana, on the other hand, exhibited impressive consistency, with daily fee income ranging between $1 million and $1.5 million, placing it second only to Ethereum. Its ultra-low transaction fees, combined with massive transaction volume, have allowed it to build a solid commercial foundation for high-frequency use cases.
In summary, Ethereum retains a clear lead in on-chain fee generation, Solana steadily follows with high-frequency-driven volume, and Base is gradually rising with support from its native ecosystem. The growing divergence in fee revenue reflects different strategic focuses among chains—“value-based interaction” versus “frequency-based interaction.”
Public Chain Capital Flow Analysis: Ethereum Dominates, Polygon Sees Largest Outflows
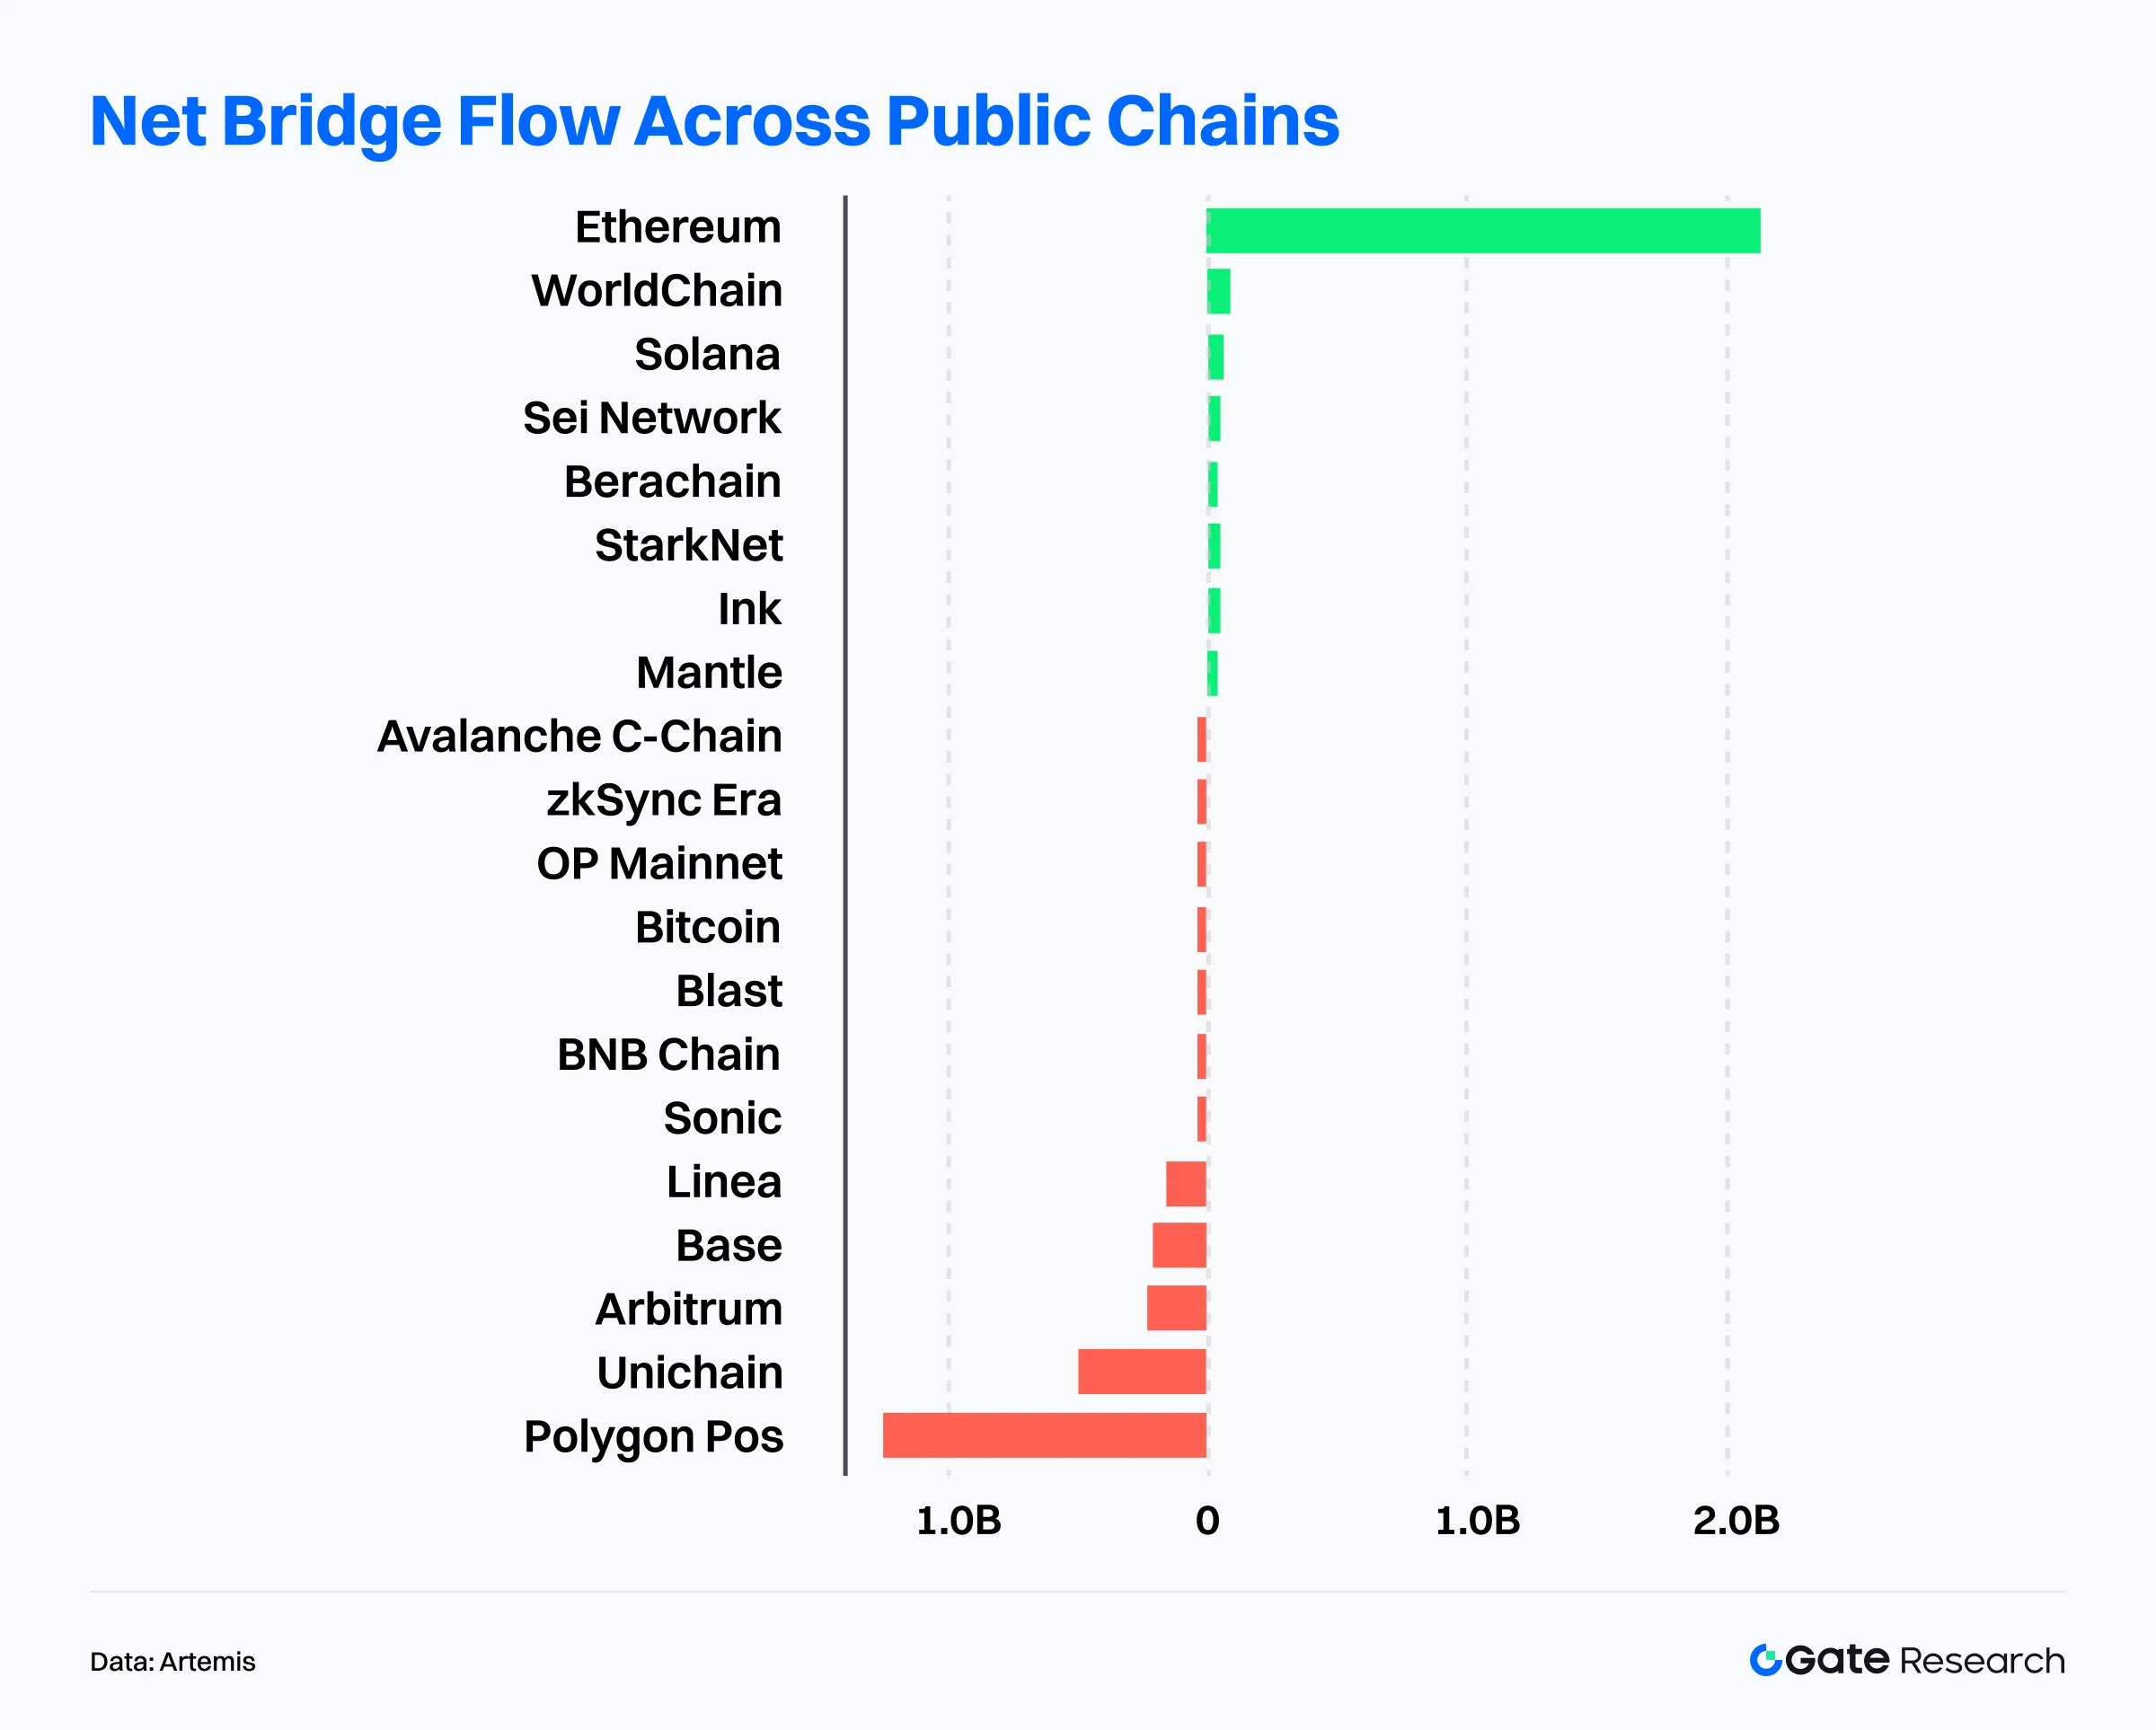
According to Artemis, Ethereum saw over $2 billion in net capital inflows, reaffirming its dominance in institutional adoption and ecosystem maturity. 【5】Boosted by dovish Fed signals and institutional buying, ETH’s price hit an all-time high of $4,956, with a market cap exceeding $580 billion. Ethereum ETFs collectively reached $30.5 billion AUM, with $2.8 billion in net inflows in a single month.【6】
Simultaneously, ecosystem expansion accelerated. Platforms like Robinhood and Ondo Finance enabled stock-tokenized trading, USDC’s monthly transfer volume hit $748.3 billion, and DeFi protocol Pendle’s TVL exceeded $10 billion, all highlighting Ethereum’s growing foothold in regulated finance and DeFi infrastructure.【7】
Besides Ethereum, WorldChain and Solana also recorded notable net inflows of $98.8 million and $72.7 million, respectively—indicating strong capital appeal across both emerging and established networks.
By contrast, several mainstream chains experienced significant capital outflows:
- Polygon PoS lost over $1 billion in net outflows.
- Unichain and Arbitrum saw outflows of $490 million and $230 million, respectively.
- Even Base saw a $190 million outflow.
This reflects a rebalancing of valuations and sentiment across Layer 2 and sidechains.
In conclusion, capital flows are increasingly consolidating, with Ethereum’s lead in institutional deployment and ecosystem development growing even stronger. Emerging chains like WorldChain and Solana continue to attract capital via ecosystem stacking effects, while earlier hype-driven L2s and sidechains are under pressure as market hotspots rotate and liquidity competition intensifies.
Key Bitcoin Metrics Analysis
Bitcoin hits $124,000 All-Time High in August, followed by consolidation phase. After reaching a historic high of $124,000 in August, Bitcoin’s upward momentum significantly slowed, with price action entering a phase of high-level consolidation and partial retracement. As the core anchor asset of the crypto market, several on-chain structural indicators began to reflect deeper shifts in capital behavior and market structure. Amid cooling inflows and weakening demand momentum, supply distribution and investor positioning have become key factors in anticipating future trends.
To systematically assess the support logic and risk evolution at current high levels, this article focuses on three core on-chain metrics:
- Realized Cap & Net Position Change – assessing capital inflows and outflows.
- Volatility Adjusted Realized Profit/Loss – capturing profit-taking pressure and market absorption strength.
- Cost Basis Distribution & Relative Unrealized Loss – evaluating support levels and downside risk exposure.
These combined indicators offer a forward-looking view of how capital is distributed, absorbed, or stressed at the current high, and help forecast potential future price trajectories.
Bitcoin Inflows Slow, High-Level Demand Weakens
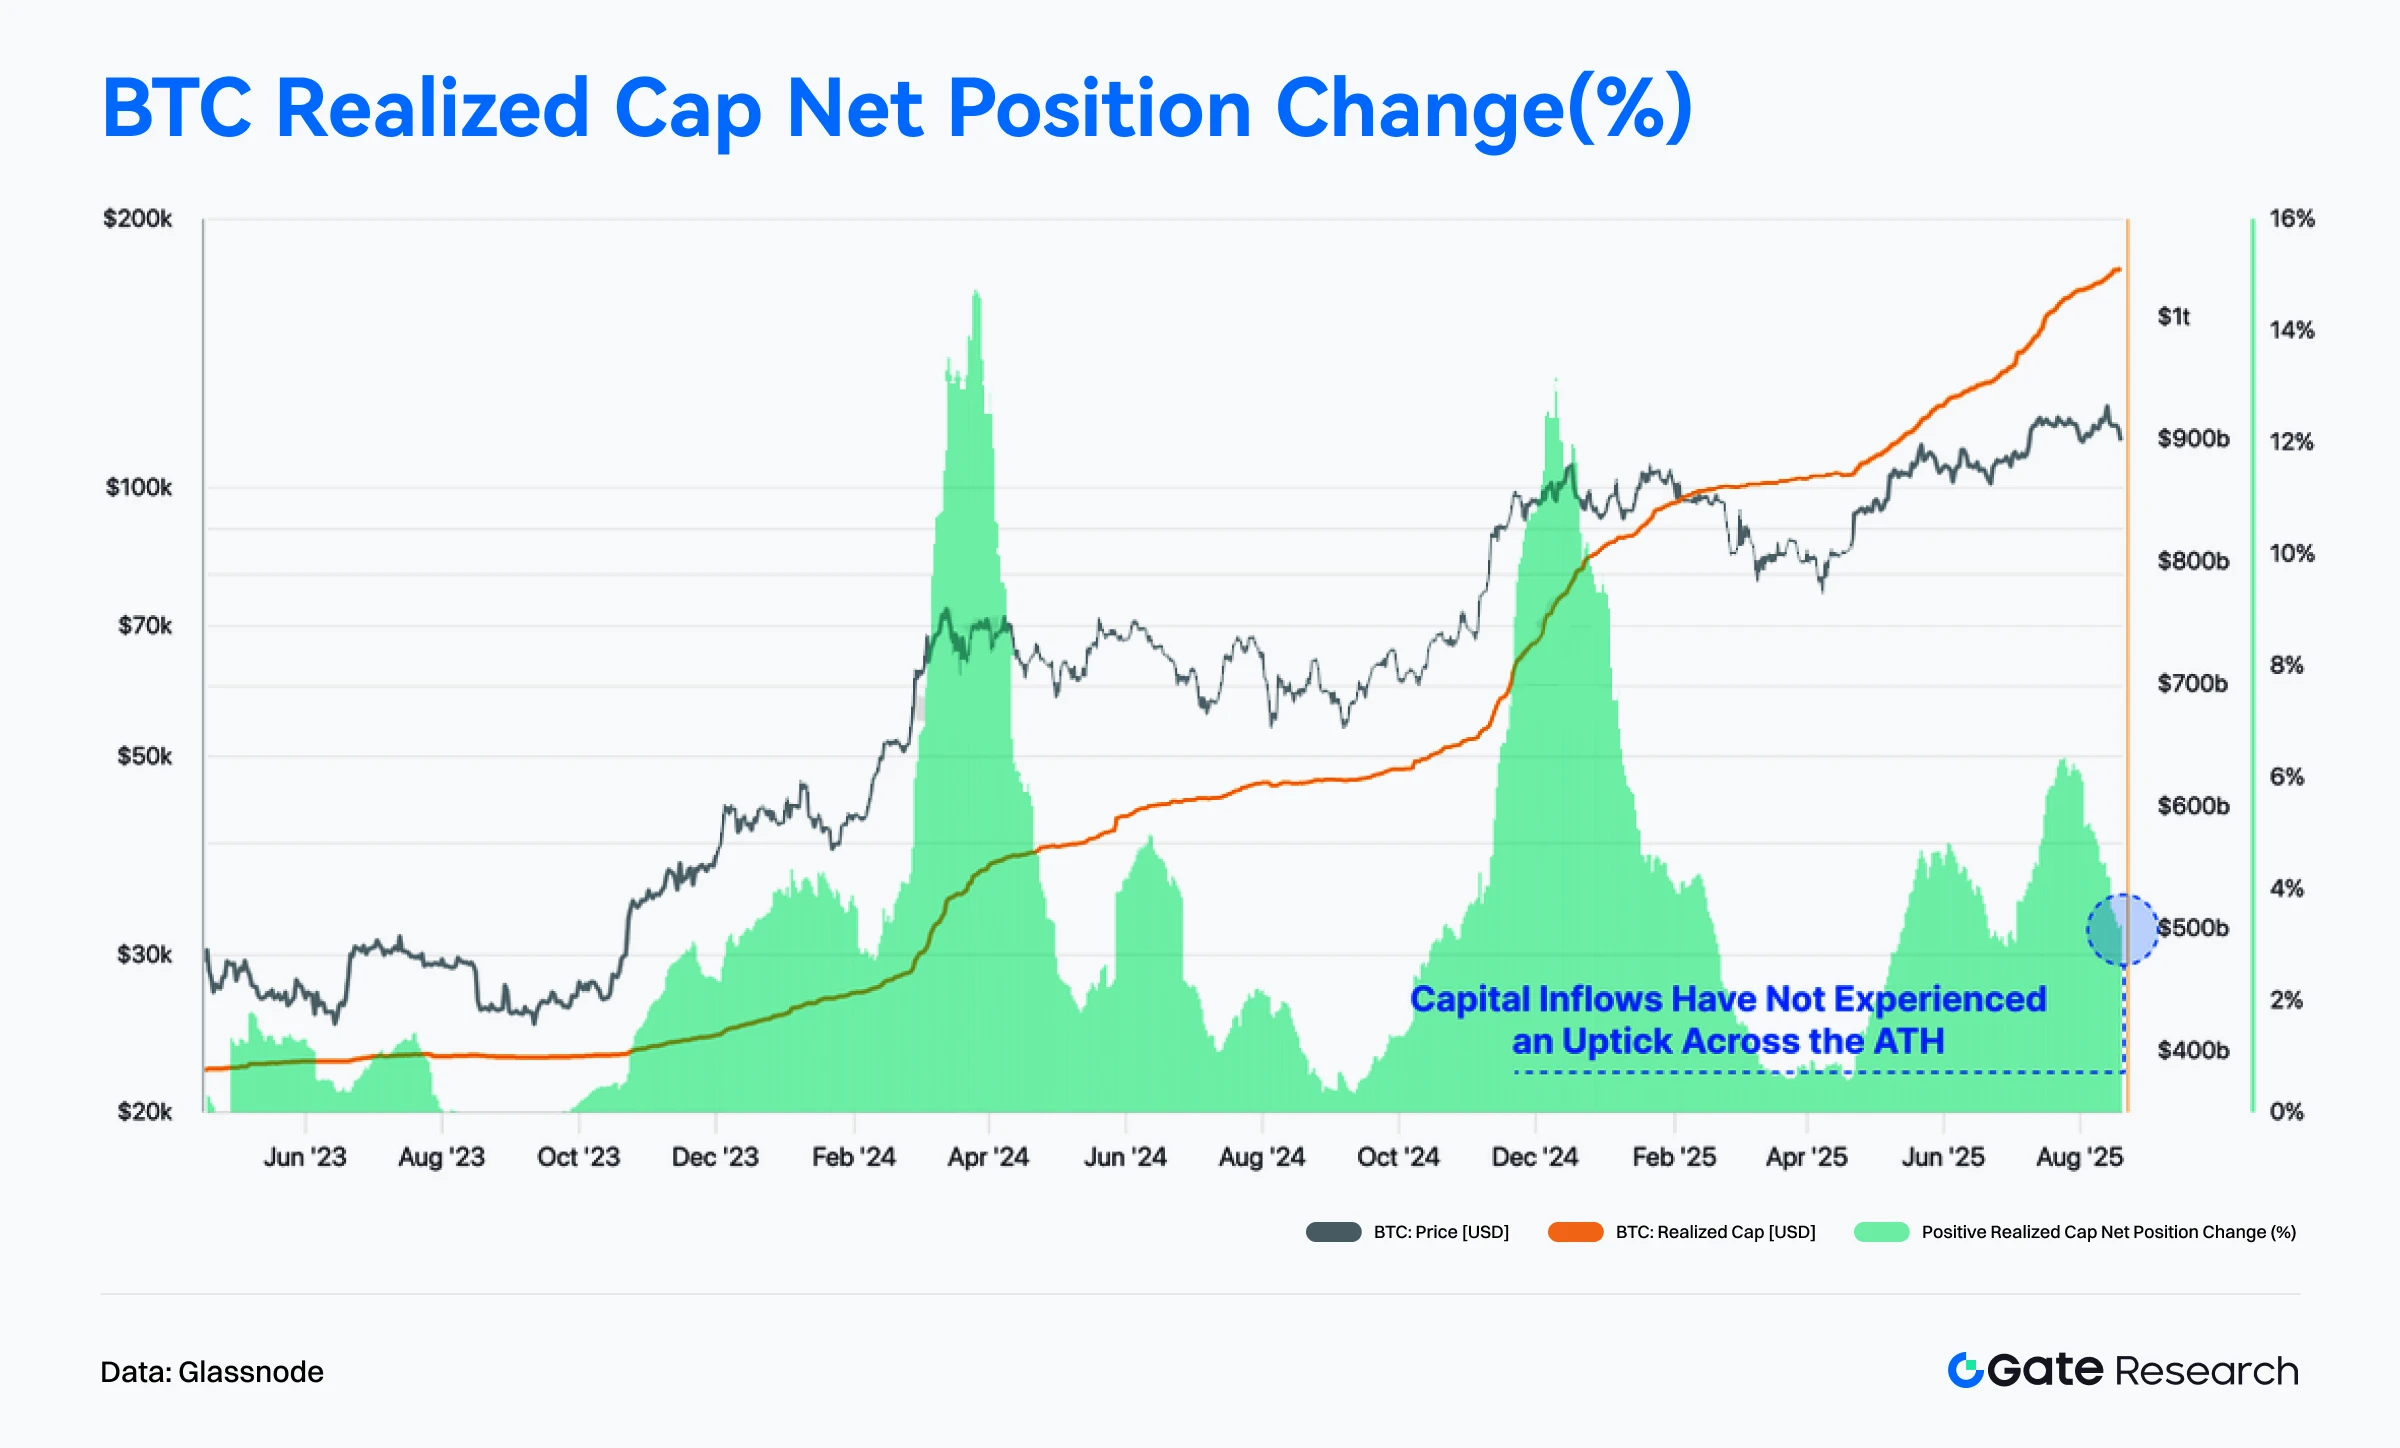
According to Glassnode data, while Bitcoin’s realized market cap continued to rise after breaking through $124,000, the pace of capital inflows significantly declined. Compared to the prior all-time highs in March and December 2024, where capital surged in, the green capital inflow bars during this breakout were noticeably lower. This suggests that despite a new price high, there was no substantial influx of new capital, and investor willingness to enter at these elevated levels was clearly weaker. This reflects sluggish demand-side momentum and limited liquidity support.【8】
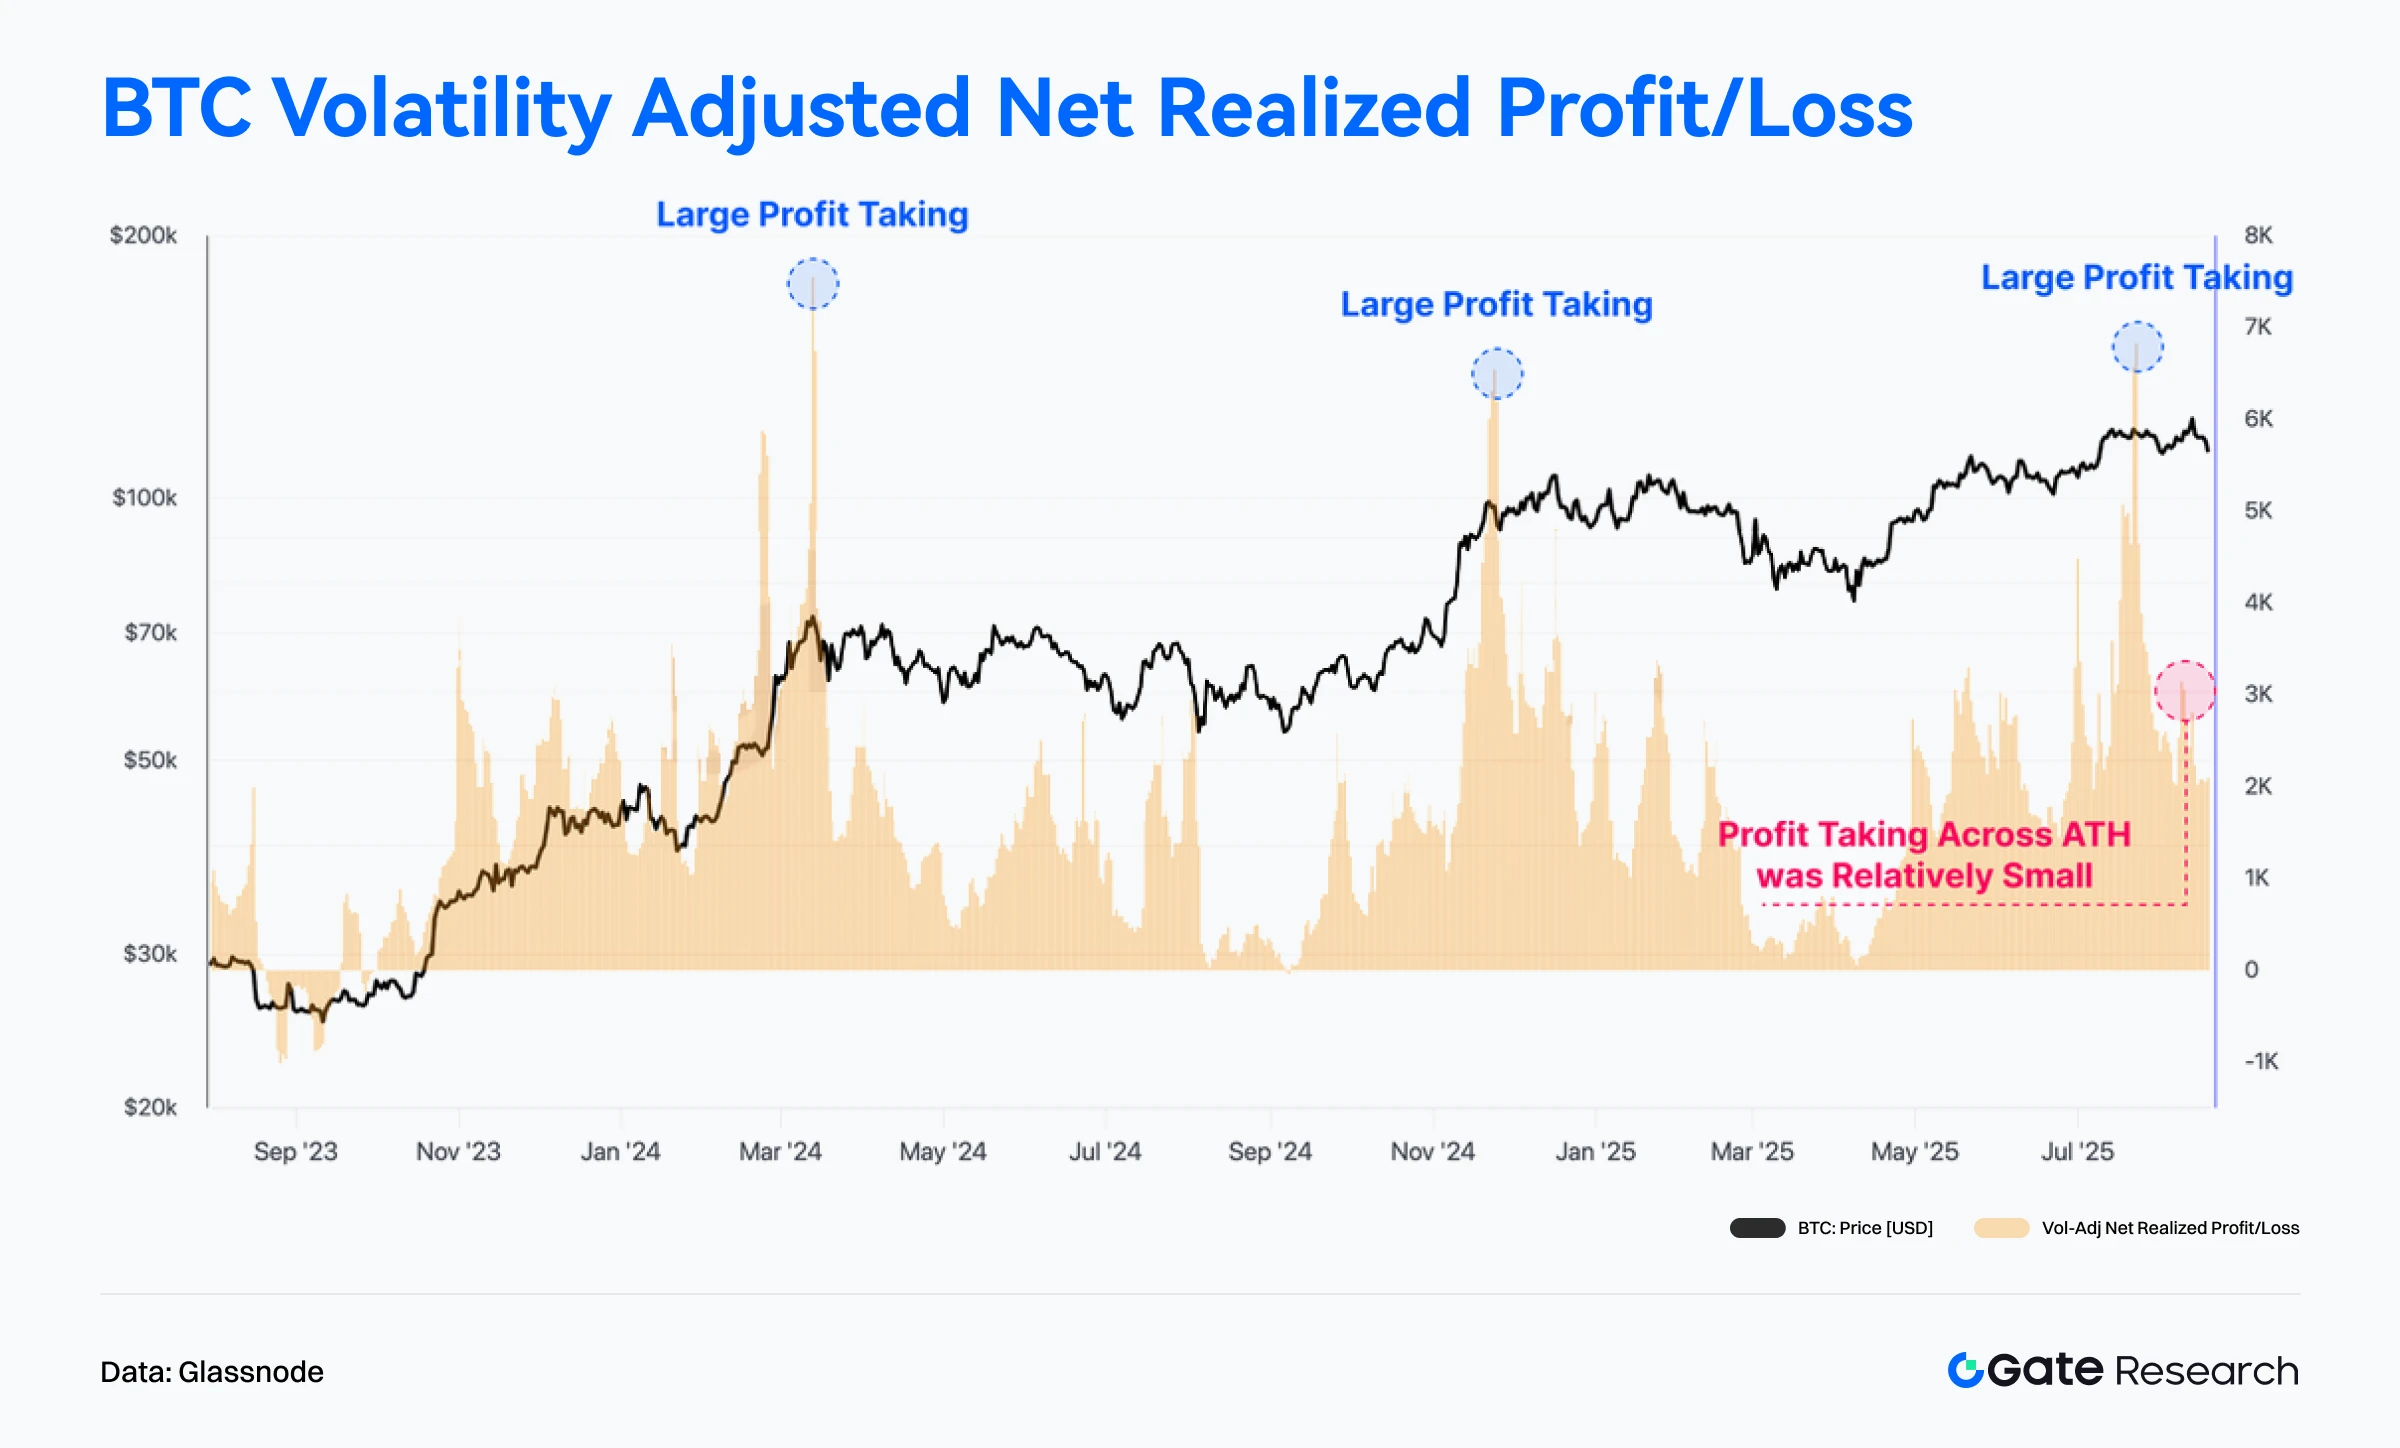
At the same time, the Volatility Adjusted Net Realized Profit/Loss (7d) indicator shows that prior all-time highs have typically triggered intense profit-taking. However, during the August 2025 breakout to $124,000, the magnitude of profit realization was relatively muted, with only modest capital outflows observed—far below the extremes of previous ATHs.【9】
This implies that investors are currently more inclined to hold rather than exit, and selling pressure during this rally remains low, indicating a more resilient market structure.
In summary, while limited capital inflows may constrain further upside in the short term, the lack of aggressive profit-taking supports a prolonged consolidation rather than a sharp reversal.
Bitcoin Cost Basis Concentration Reinforces Key Support Levels
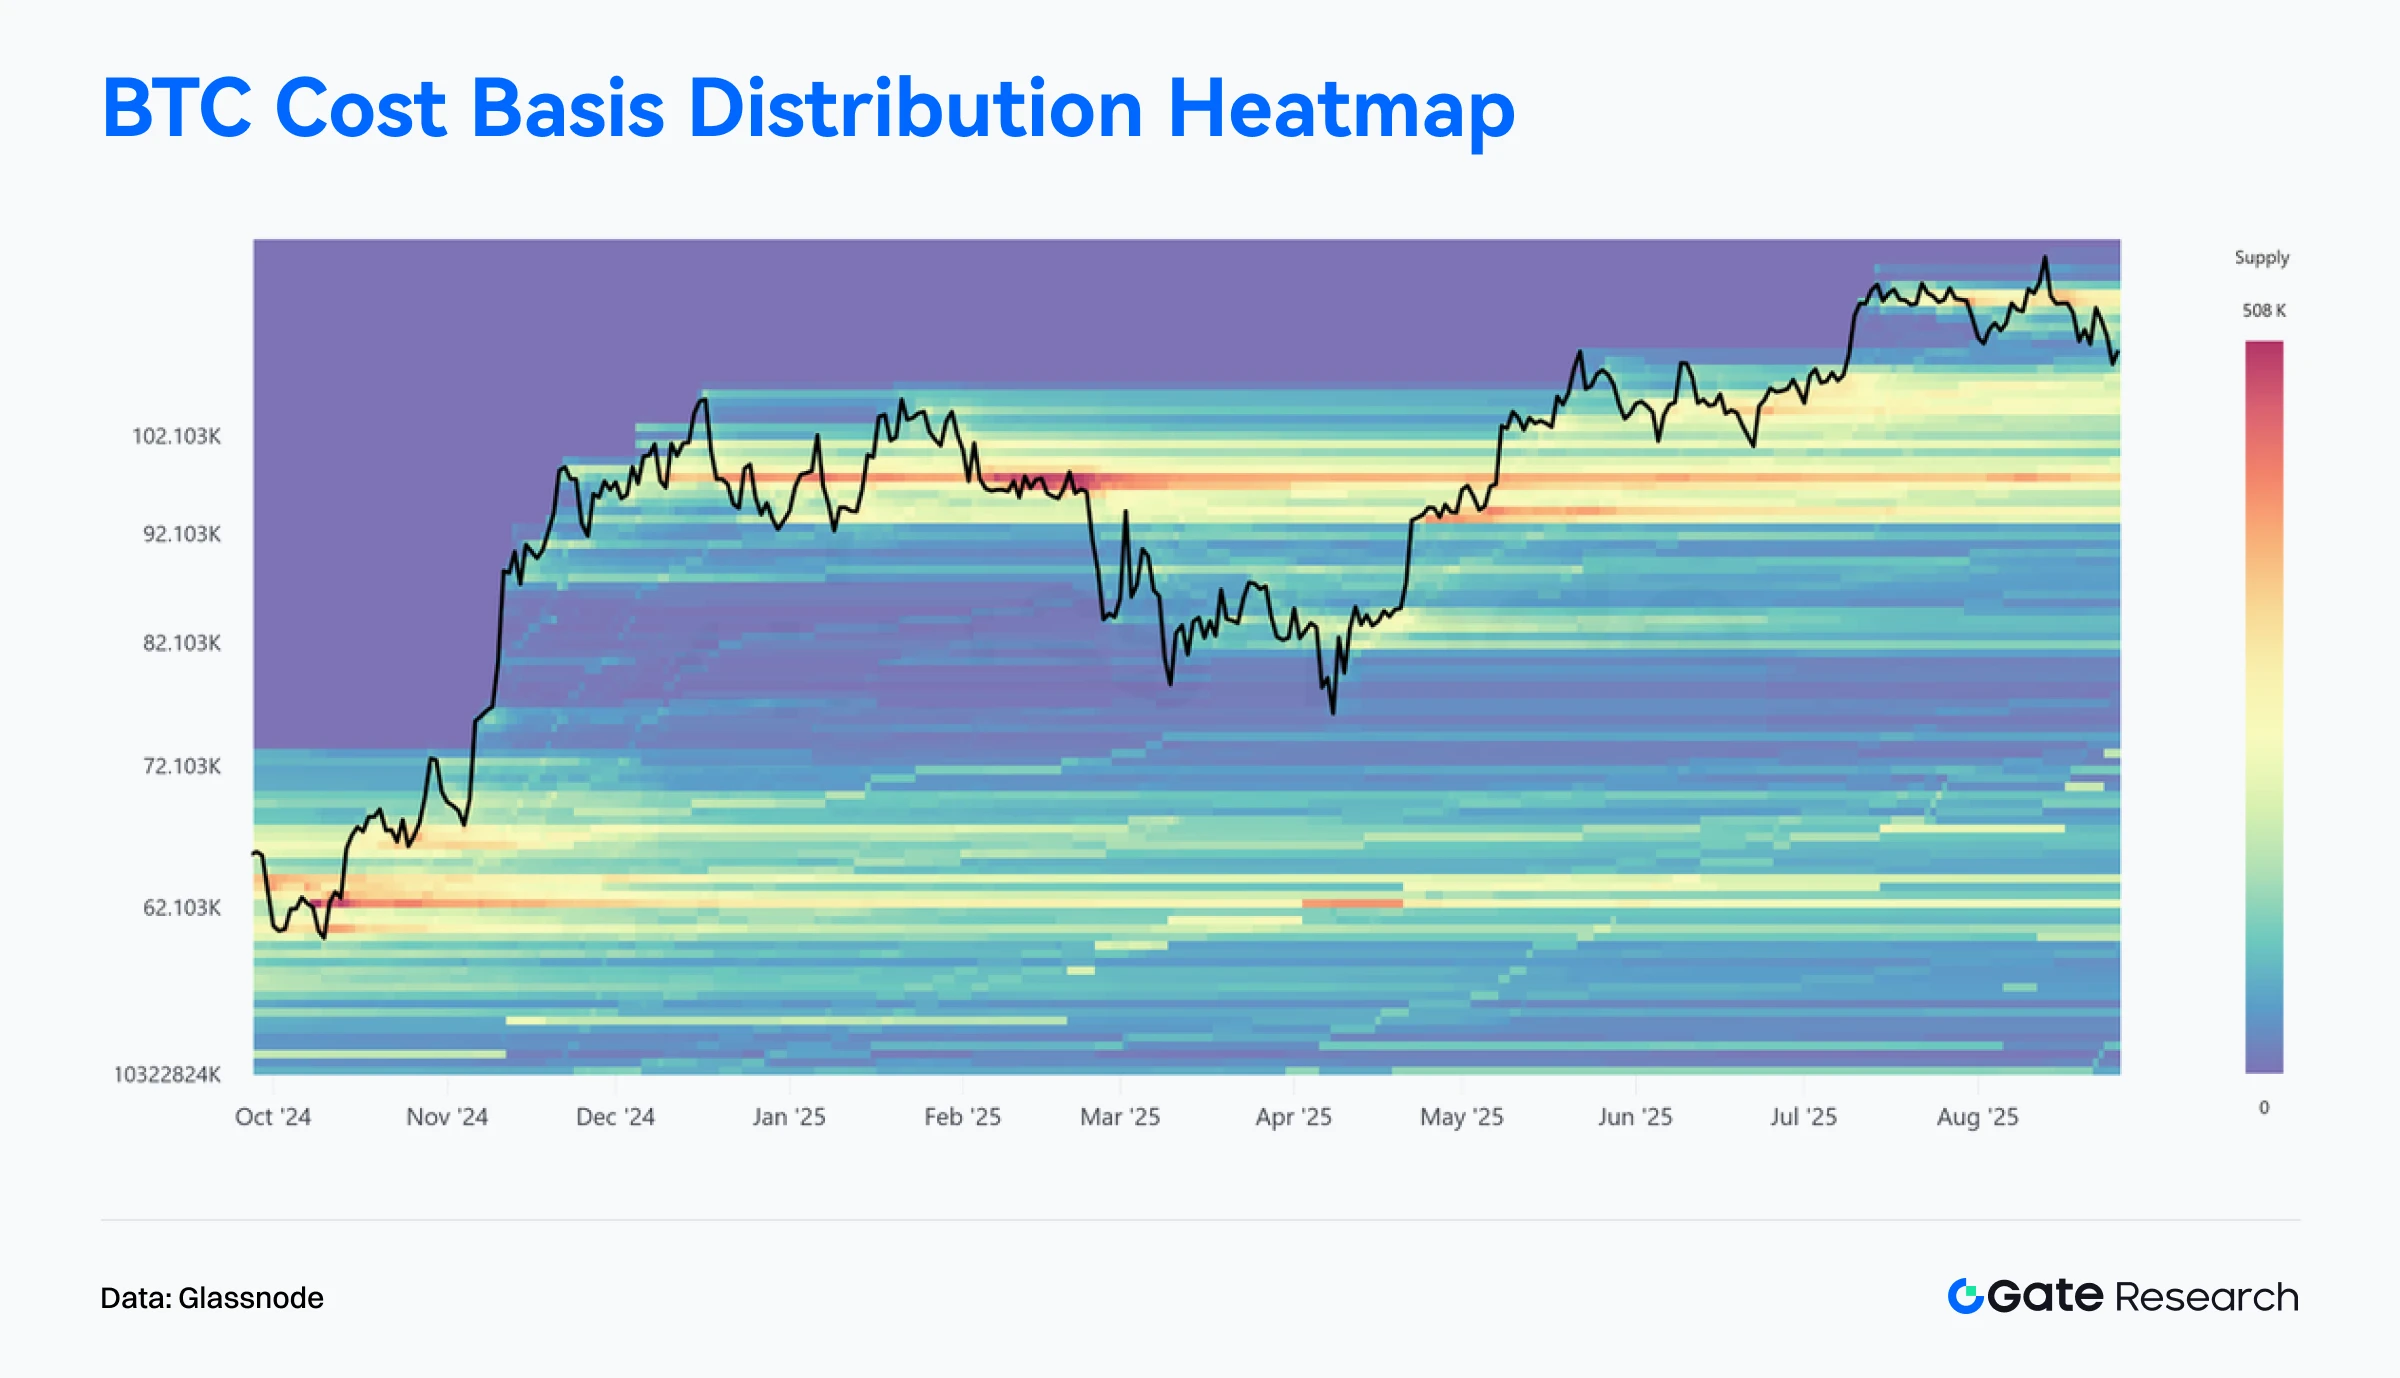
Glassnode’s cost basis heatmap shows a dense concentration of Bitcoin supply in the $93,000–$110,000 range, which has steadily accumulated since December 2024, forming a major support zone in the current cycle.【10】
Despite the recent pullback from the $124,000 peak, BTC’s price remains above this supply band, suggesting strong demand-side absorption. Above $110,000, however, supply becomes sparse, forming a “liquidity gap”, where price lacks strong support or resistance and is thus more volatile.
Currently, the price hovers around $111,000. If a deeper pullback occurs, the dense cost basis region below may offer support. If this zone holds, it could signal sustained accumulation and set the stage for a potential rebound.
Overall, this heatmap highlights the structural concentration of supply in the $93K–$110K range, suggesting a potential bottoming formation and underscoring that BTC is now hovering at a critical support edge.
Unrealized Losses Remain Low, Market Stress Still Contained
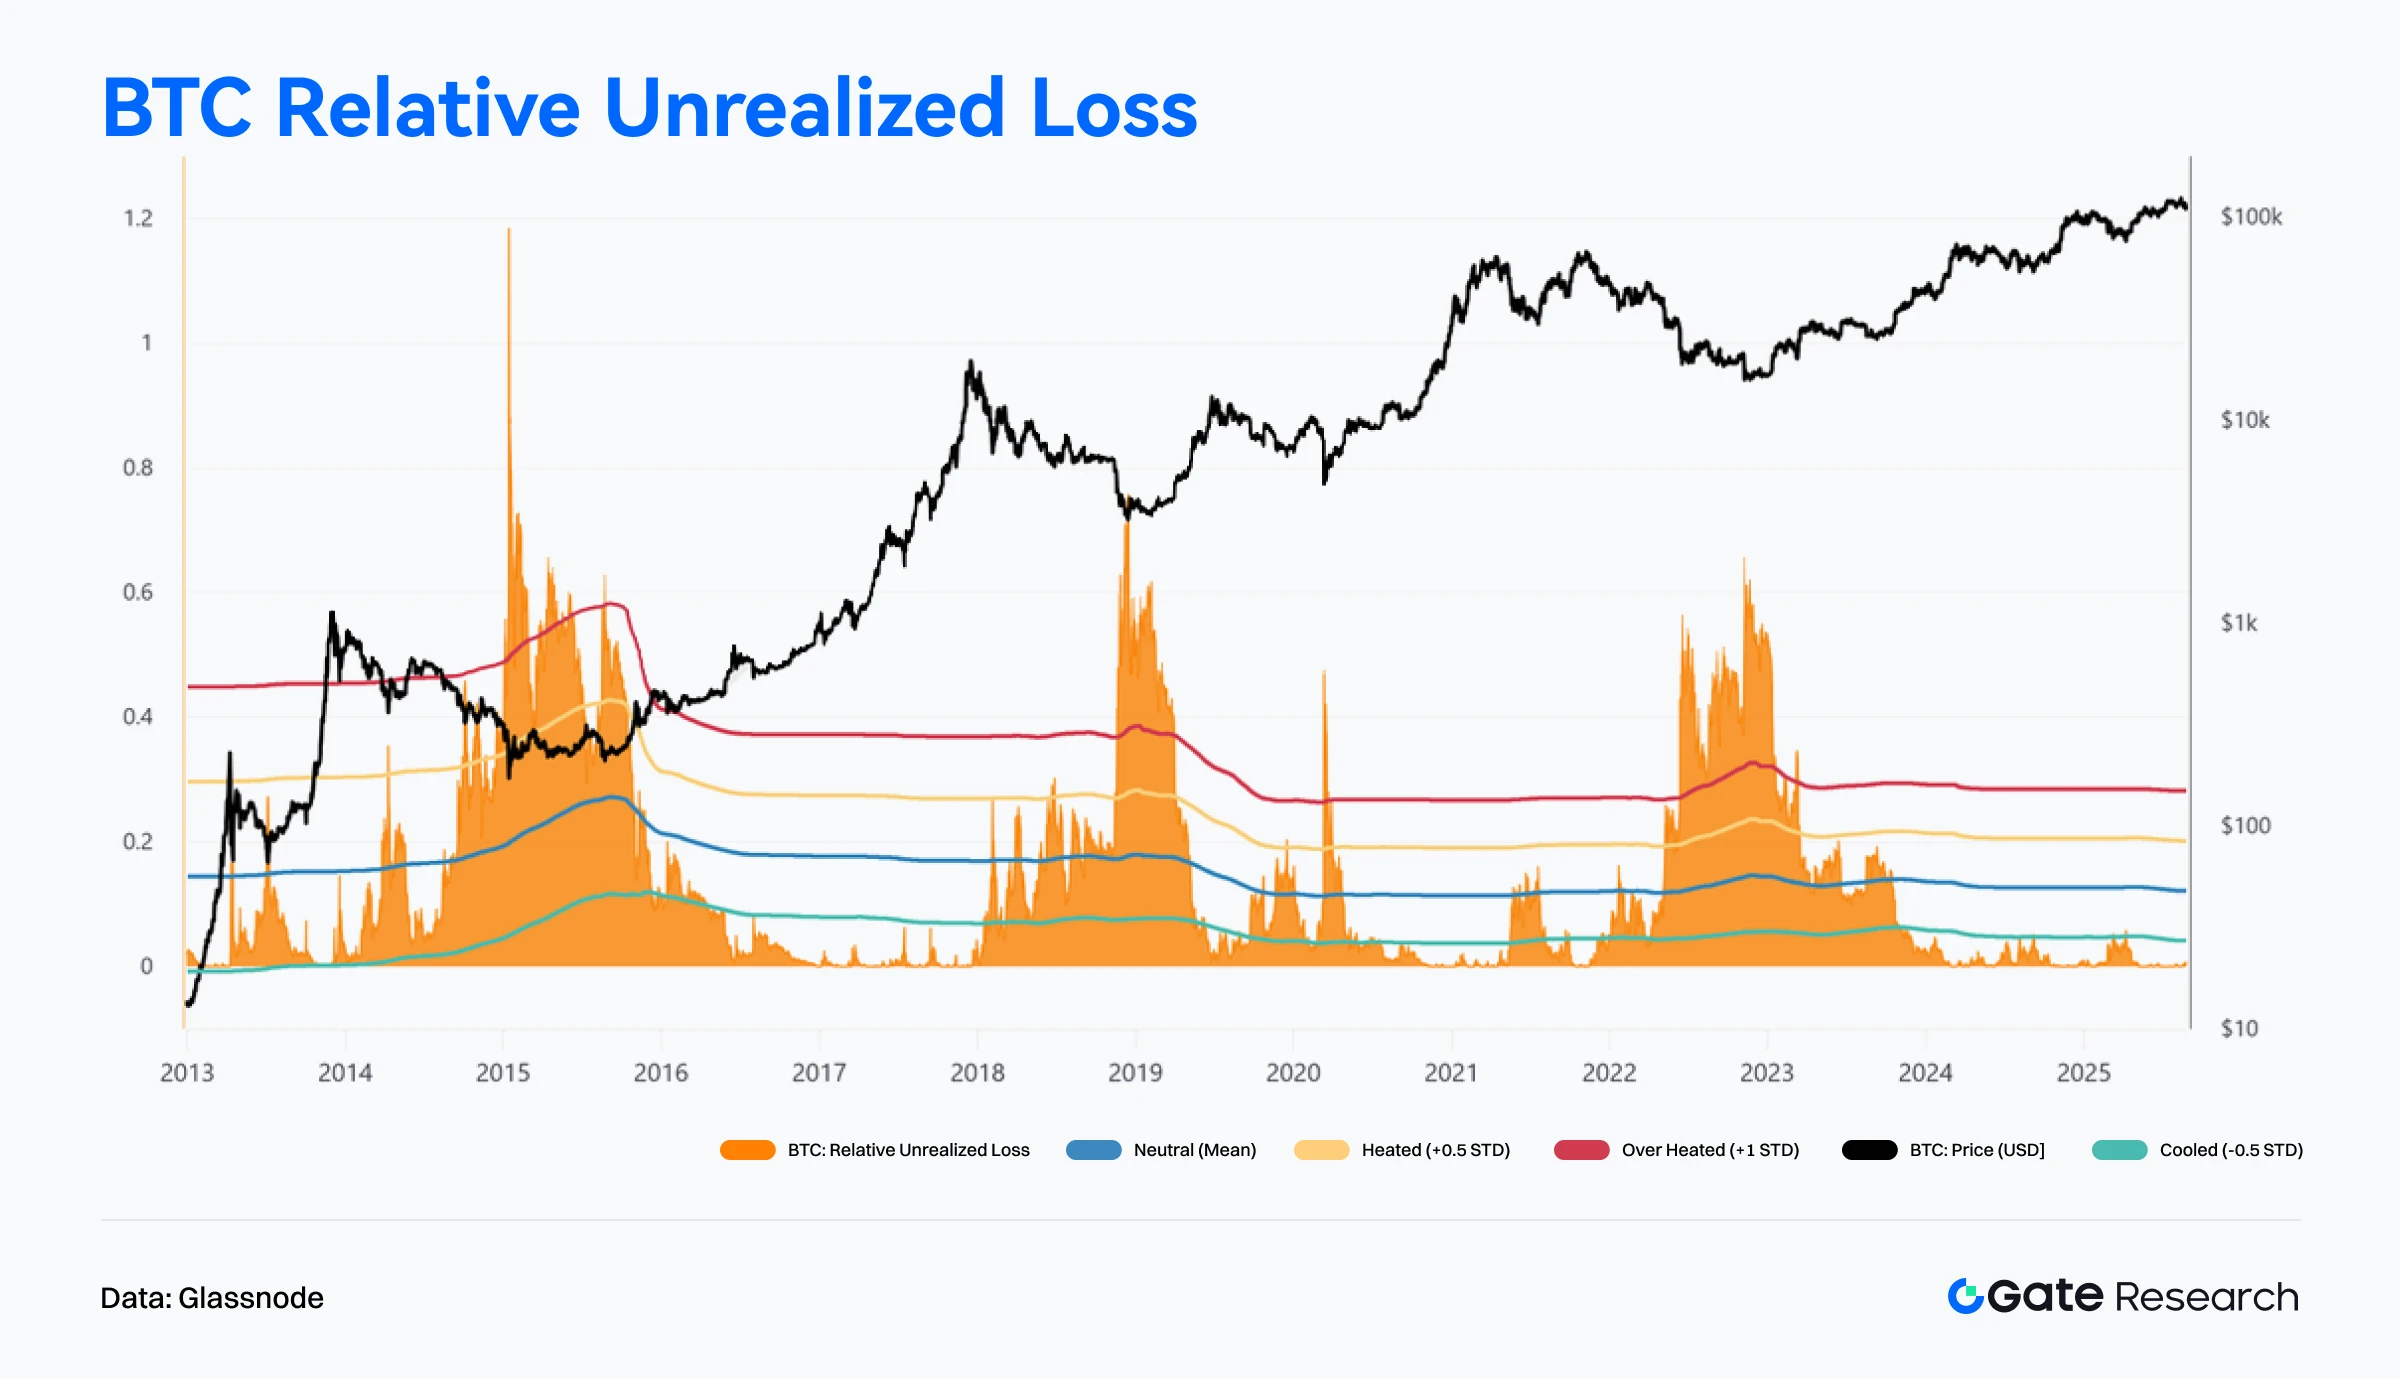
Glassnode’s Relative Unrealized Loss indicator spiked sharply during the 2023 bear market, reflecting severe capital stress among investors. However, since late 2023, the metric has dropped rapidly and remained at low levels throughout 2024 and 2025, consistently below -0.5 standard deviations.【11】
Currently, the metric is around 0.5%, a stark contrast to prior bear market extremes of 30%+ in 2018–2020 and 2022–2023. This suggests that despite the recent pullback from $124,000, overall market stress is mild, and the proportion of underwater holders remains limited.
In essence, this indicator shows that the market is not experiencing a deep panic phase akin to previous cycles. Investor positioning remains healthy, and the current correction is more likely a mid-cycle adjustment than a trend reversal.
Trending Projects & Token Activity
On-chain data indicates that capital and users are increasingly concentrating in ecosystems with strong interaction infrastructure and deep application layers. Projects that combine narrative appeal with technological innovation are emerging as new focal points for investor attention. The following section will highlight recent high-performing projects and tokens, analyzing the underlying drivers and potential implications.
Overview of Popular Project Data
Aave
Aave is a decentralized lending platform that removes traditional financial intermediaries through the use of smart contracts, allowing users to lend and borrow directly. Known for its innovative lending products, Aave supports multiple cryptocurrencies and leverages Layer 2 solutions to improve performance. Its mechanisms include collateralized loans and flash loans, and it features a Safety Module to protect the protocol from capital loss.
Aave V4 will introduce a unified liquidity layer, soft interest rate control, and other new features. Additionally, the proposed Aave Network will function as an application chain capable of fee collection in GHO and integration with Aave V4.
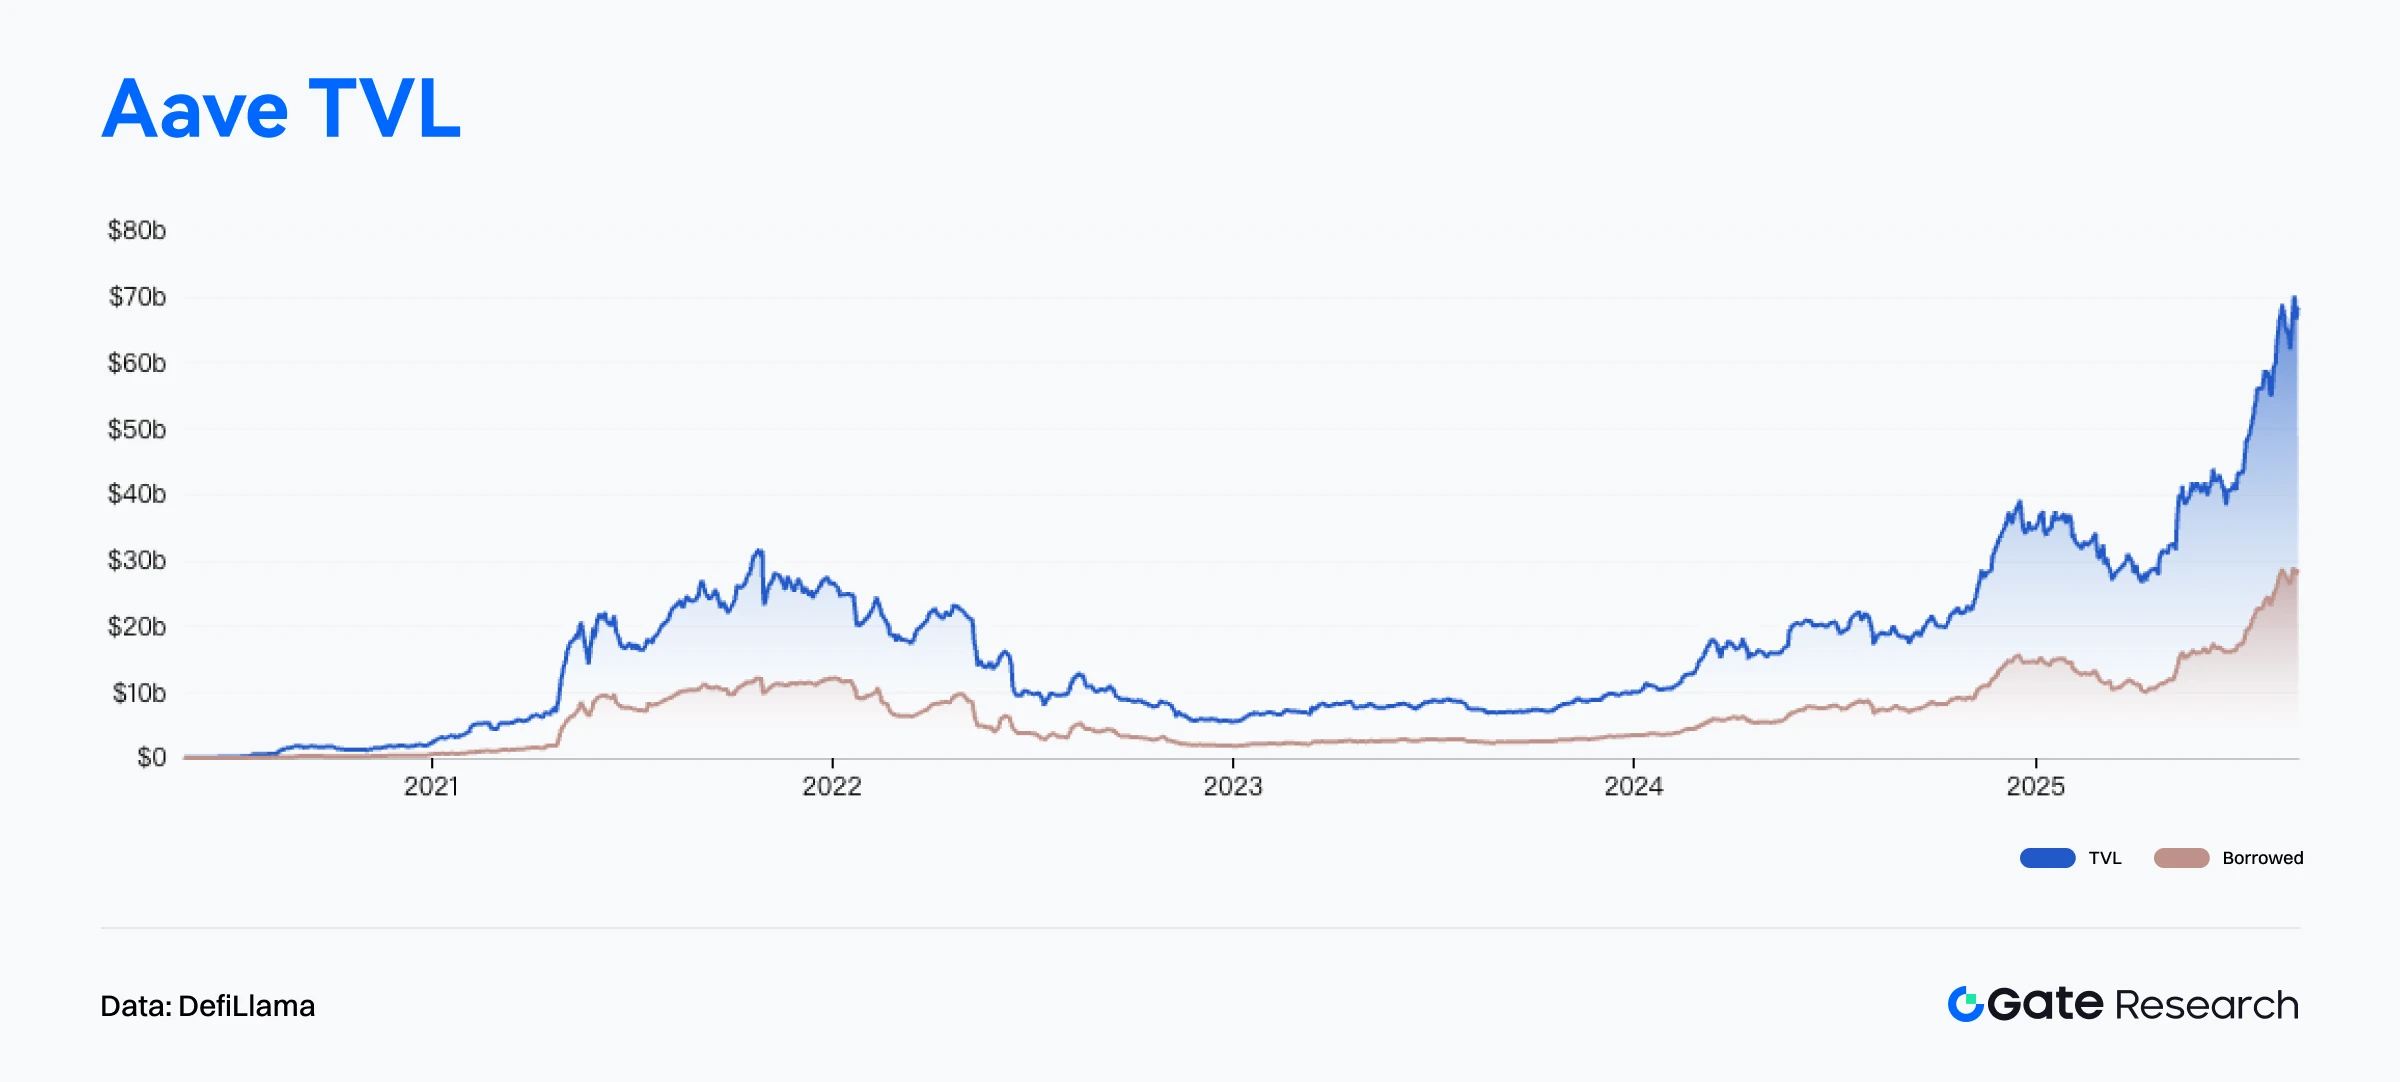
According to DefiLlama, Aave’s Total Value Locked (TVL) has surpassed $41.1 billion, setting a new all-time high.【12】Including $28.9 billion in outstanding loans, Aave’s total managed capital exceeds $70 billion, ranking it among the top 37 U.S. banks (top 1.7%) by asset size.【13】Aave founder Stani Kulechov emphasized that Aave is an open financial network capable of offering institutional investors yield opportunities without relying on the Federal Reserve—highlighting DeFi’s structural potential as a substitute for traditional finance.
Aave continues to lead the DeFi lending sector, controlling around 50% of total market TVL, nearly 6 times that of its closest competitor Morpho, underscoring the high concentration of both user and institutional capital based on its perceived security and stability.
Aave Labs recently launched Horizon, a new platform designed to provide institutional investors with stablecoin loans backed by tokenized real-world assets (RWAs). In its initial phase, qualified institutions can use tokenized assets—including government bonds and crypto asset funds—as collateral to borrow USDC, RLUSD, and GHO. Supported assets include Superstate’s short-term treasury fund, Circle’s Yield Fund, and tokenized products by Centrifuge, such as Janus Henderson bonds.【14】
The launch of Horizon signals Aave’s acceleration into the institutional-grade RWA financing space. By introducing traditional assets like government bonds into DeFi as collateral, Aave expands the use cases for stablecoins while equipping institutions with tools that offer both liquidity and yield management.
This move not only boosts the demand and liquidity for stablecoins and RWAs but also furthers the convergence of DeFi and TradFi.
In summary, Aave not only maintains a leading position in decentralized lending but also showcases clear strategic foresight through continued innovation in institutional services. As regulatory clarity improves and the range of collateral assets expands, Horizon is poised to become a critical entry point for institutions entering DeFi—solidifying Aave’s role as a core pillar in the global financial infrastructure.
Overview of Trending Token Data
$BIO
$BIO is the native token of Bio Protocol, a blockchain project focused on decentralized science (DeSci). It aims to create an open scientific collaboration network involving researchers, patients, and investors through on-chain governance and token incentives.
BIO tokens are used for participation in BioDAO governance, project incubation, intellectual property revenue sharing, and staking to earn voting rights and rewards.
Bio Protocol promotes the on-chain tokenization and commercialization of scientific achievements through IP tokenization, research task incentives, and an incubator framework, making it one of the most representative projects in the DeSci ecosystem.
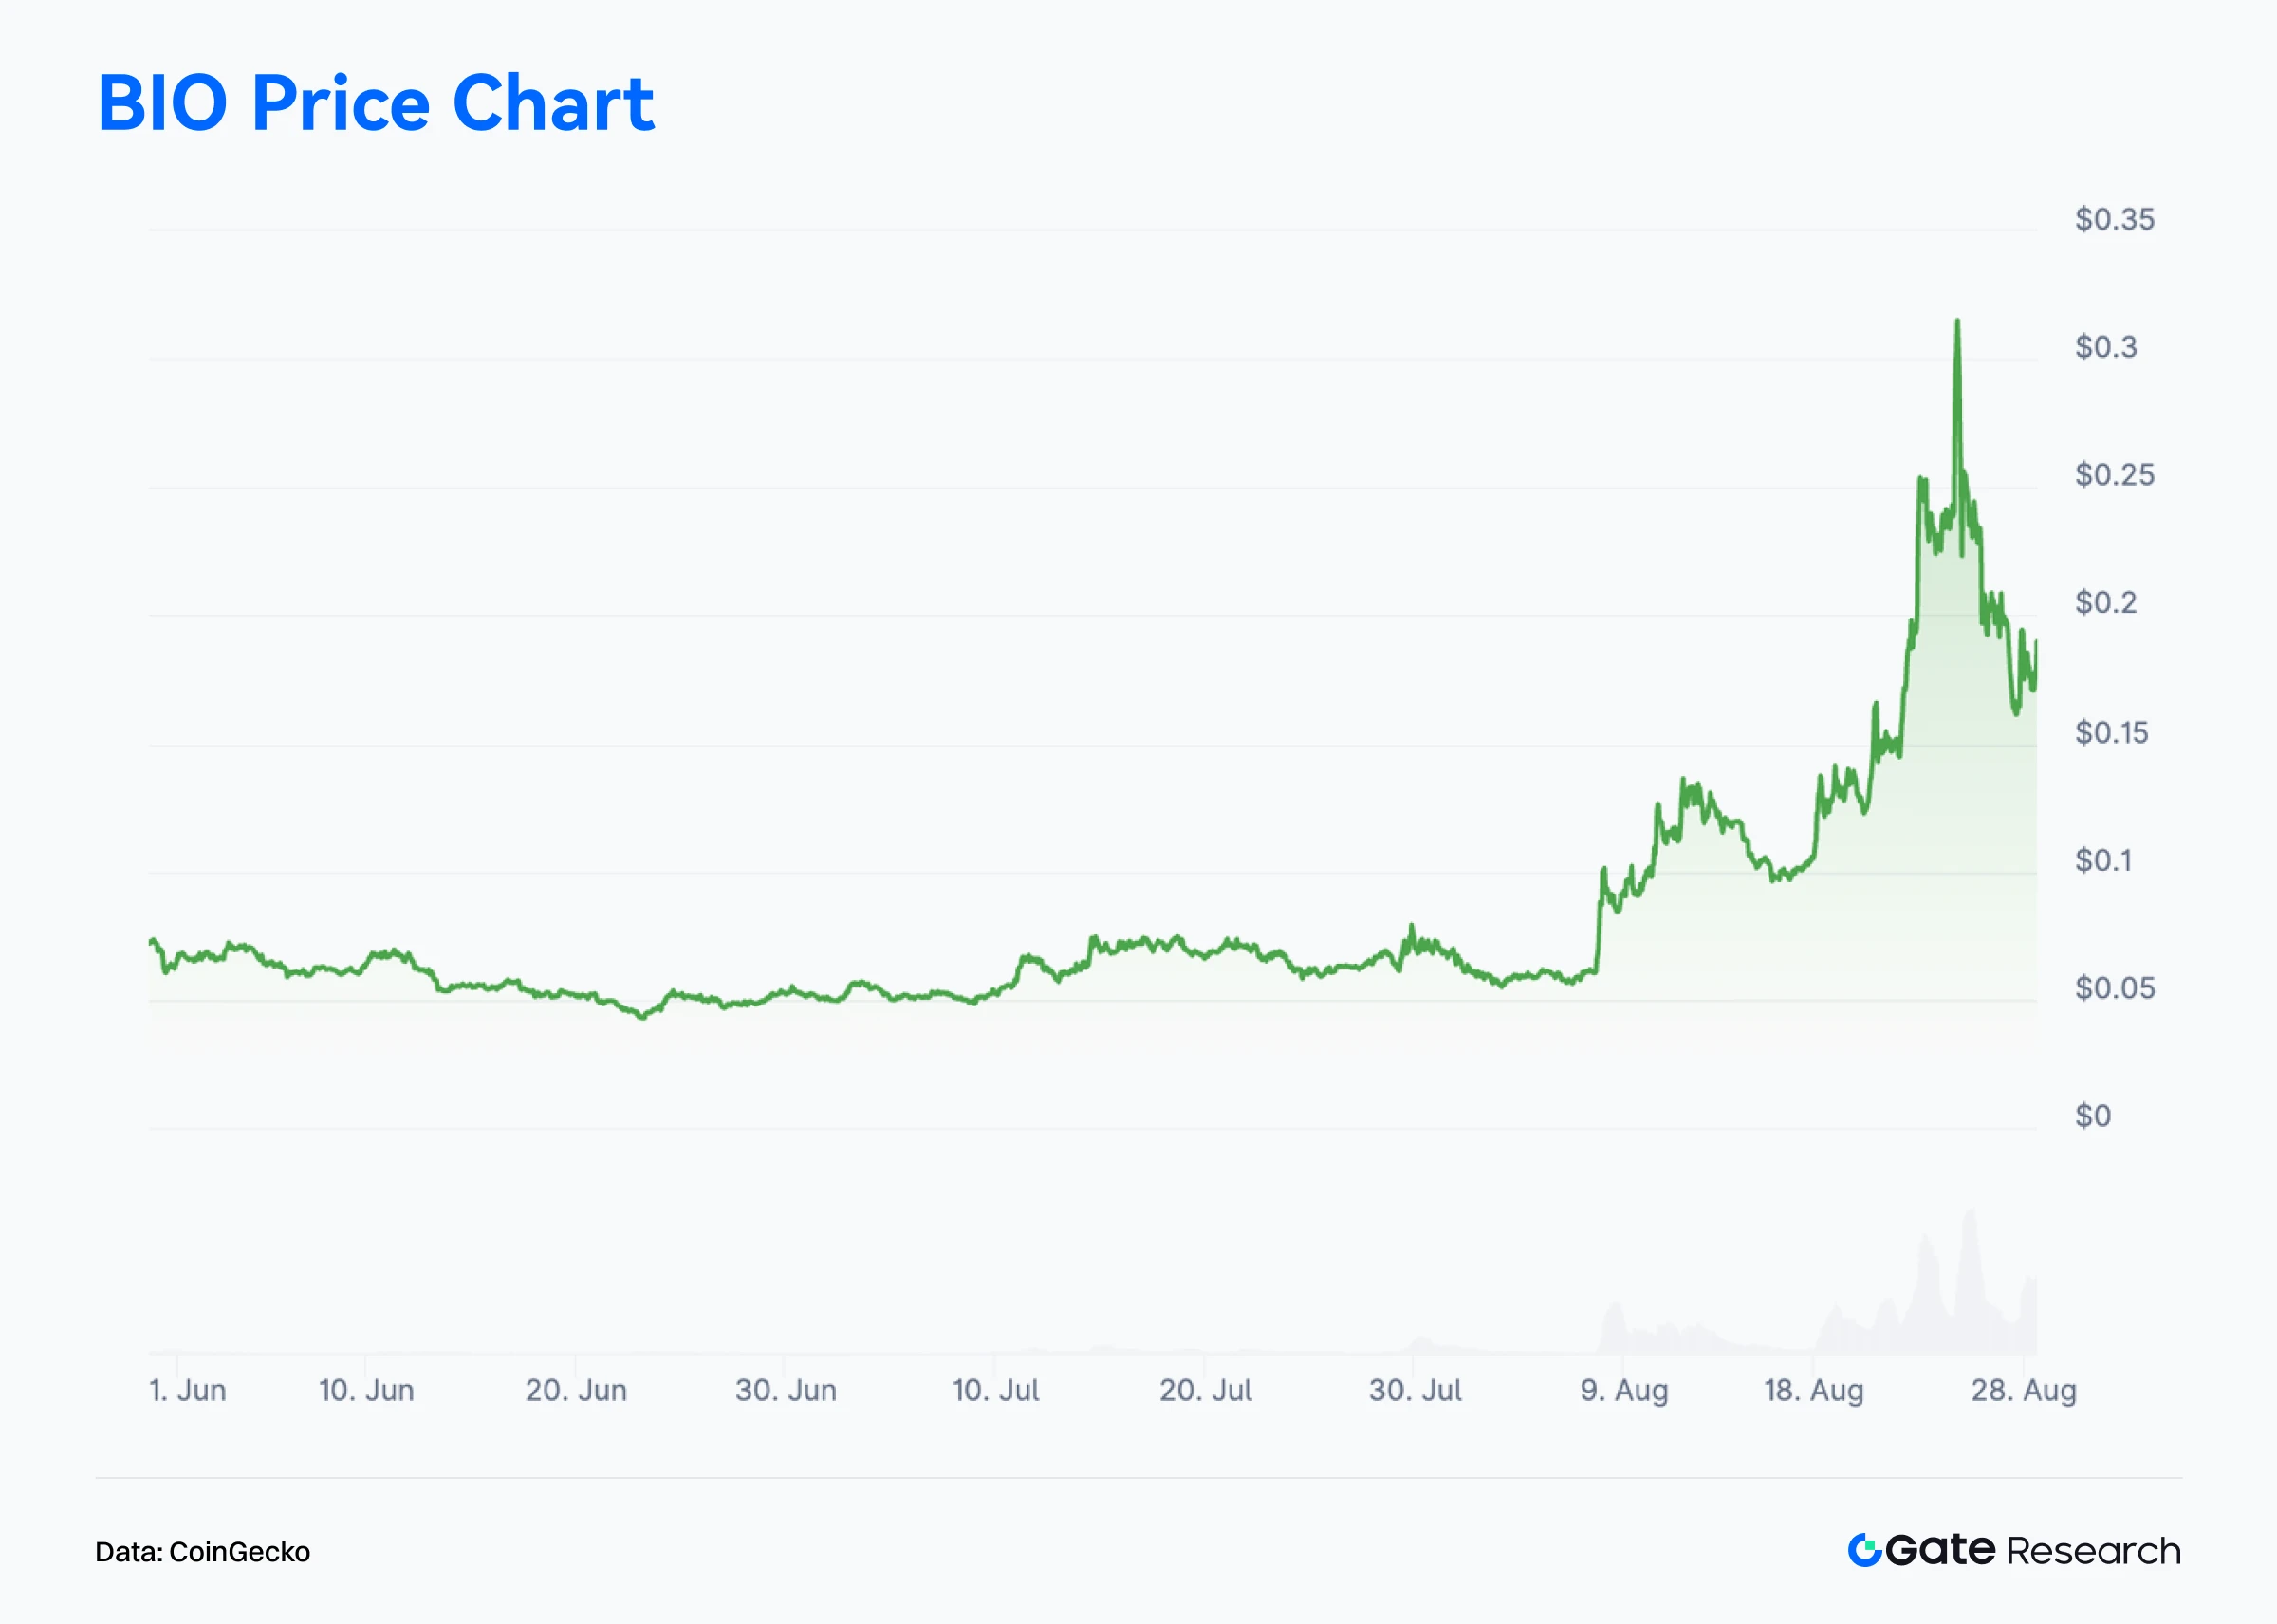
With the launch of Bio Protocol V2, new mechanisms such as a Launchpad, staking point system, and liquidity engine were introduced. Within its first week, total staked BIO exceeded 100 million, and the token’s market cap doubled to $200 million, reigniting market interest in the DeSci sector.【15】The price of BIO surged from $0.10 on August 18 to a high of $0.315 on August 24, achieving a weekly gain of nearly 200%, making it one of the top-performing on-chain assets in August.
On the ecosystem front, Bio Protocol has accumulated over $4 million in liquidity fee revenue and is preparing integrations with major DeFi protocols, including the launch of a dedicated lending market for BIO.
The team is also planning to release Bio Copilot, a decentralized scientific agent aimed at automating stages of scientific research such as drug screening, clinical operations, and fund allocation—driving DeSci toward high-frequency, intelligent iteration.
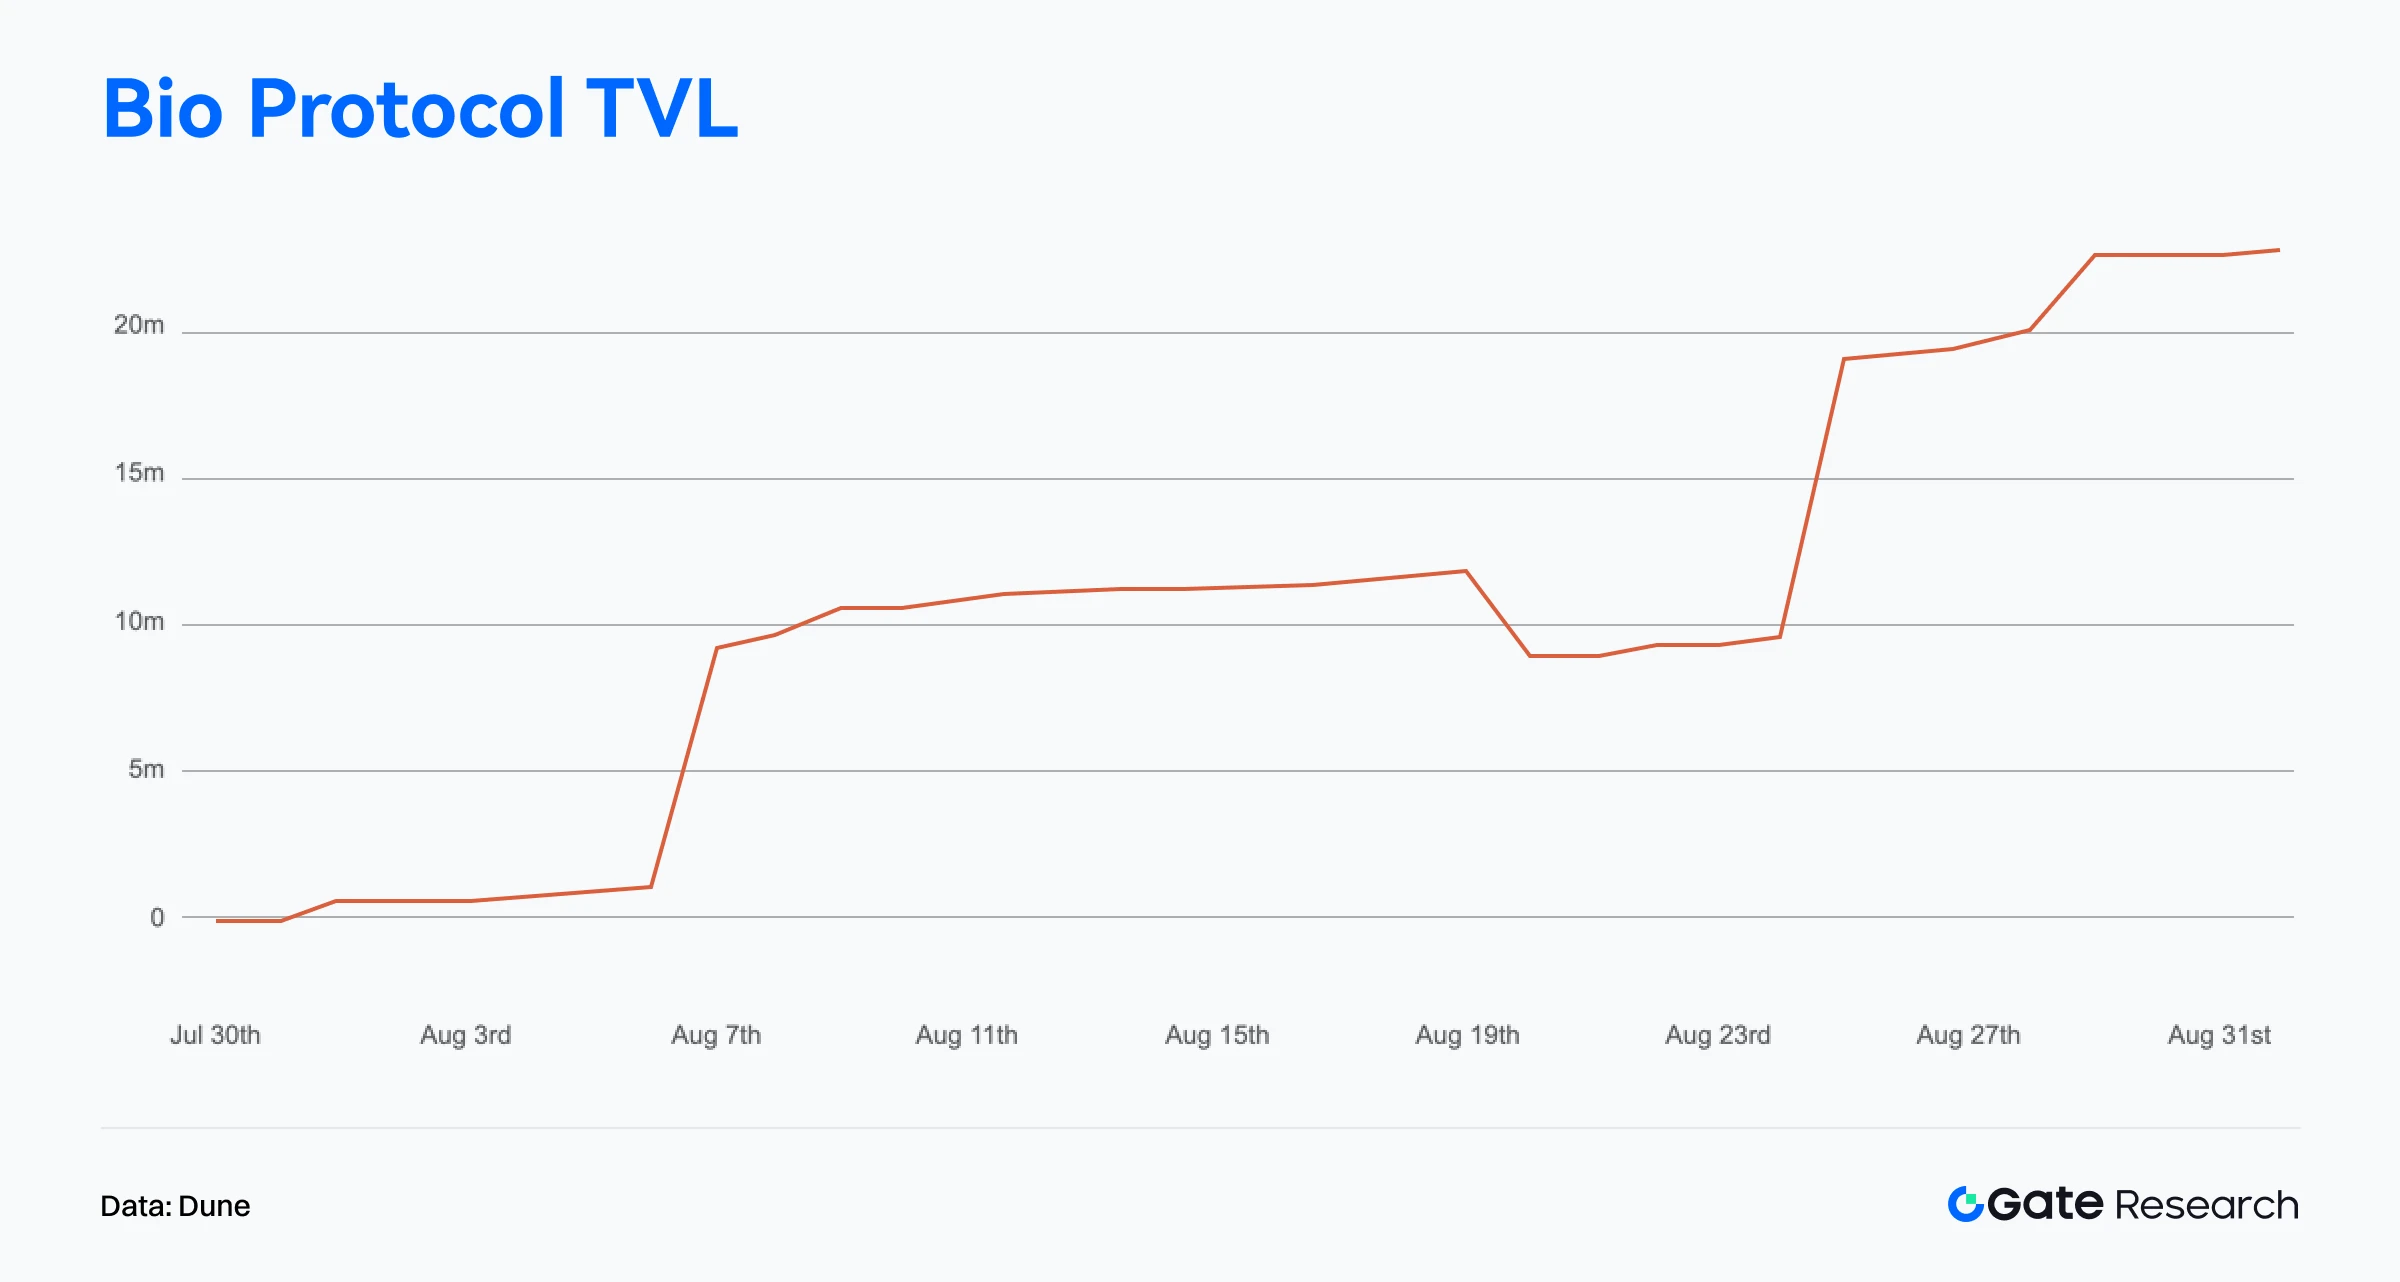
On-chain data also reflects accelerating capital inflow. According to Dune Analytics, Bio Protocol’s TVL has exceeded $22 million, with over 110% growth in the past 7 days.
Analysts believe that the rising ratio of long-term locked positions may provide sustained upward momentum for BIO. However, the high proportion of short-term positions could trigger temporary sell pressure. If long-term capital continues to flow in, BIO may enter a new bullish cycle.【16】
In conclusion, Bio Protocol stands out in the DeSci space due to its precise positioning and ongoing innovation. With strong on-chain performance and market traction driven by V2 upgrades, liquidity enhancements, and ecosystem expansion, the project has attracted deep capital and community participation.
With upcoming products like Bio Copilot, Bio Protocol is poised to make substantial progress in bringing scientific research on-chain and enabling automated, decentralized R&D workflows.
If capital inflows and staking structures continue to optimize, Bio Protocol is likely to remain a DeSci leader, serving as a vital bridge between scientific innovation and on-chain finance.
Conclusion
In August 2025, structural divergence in on-chain activity and capital movement continued to intensify. Solana led the transaction rankings with over 29 billion monthly transactions, showcasing its dominance in high-frequency interactions. Ethereum, meanwhile, set consecutive highs in mainnet transaction volume while maintaining clear leadership in fee revenue and net capital inflows, reinforcing its position as the core network for high-value interactions and institutional deployment. Base continued its steady ascent, surpassing 1 million active addresses and expanding its influence within the Layer 2 ecosystem.
On the capital front, Ethereum recorded over $2 billion in net inflows, pushing both ETH’s price and ETF assets under management (AUM) to new all-time highs. WorldChain and Solana also ranked among the top capital magnets. In contrast, Polygon, Unichain, and several other sidechains and Layer 2 networks faced capital outflow pressures, signaling that the on-chain landscape is evolving further toward a “winner-takes-all” structure.
In terms of project highlights, Aave and Bio Protocol emerged as focal points.
- Aave, the leading DeFi lending protocol, saw its TVL surpass $41.1 billion, with total managed capital exceeding $70 billion. Through Aave V4 and the Horizon platform, it is accelerating its institutional push into RWA-backed lending, solidifying its role at the intersection of DeFi and traditional finance.
- Bio Protocol, on the other hand, doubled its market cap to $200 million following the launch of V2, with its token price surging nearly 200% in one week. The project is also planning to launch Bio Copilot, an AI-powered scientific research assistant, highlighting the strong growth potential of the DeSci (Decentralized Science) sector.
References:
- Artemis, https://app.artemisanalytics.com/chains
- DefiLlama, https://defillama.com/chain/ethereum?activeAddresses=false&tvl=false&groupBy=monthly&dexsVolume=true
- Artemis, https://app.artemisanalytics.com/chains
- Artemis, https://app.artemisanalytics.com/chains
- Artemis, https://app.artemisanalytics.com/flows
- CoinGecko, https://www.coingecko.com/en/treasuries/ethereum
- DefiLlama, https://defillama.com/protocol/pendle
- Glassnode, https://studio.glassnode.com/charts/ba1ec93d-85f4-41fe-5606-798a2f30013a?a=BTC
- Glassnode, https://studio.glassnode.com/charts/22ef95fa-bed1-4a18-5e56-a74093870d1a?a=BTC
- Glassnode, https://studio.glassnode.com/charts/indicators.CostBasisDistributionHeatmap?a=BTC&mScl=log&pScl=log&period=1y&resolution=24h&s=1727519376&u=1756166400&zoom=
- Glassnode, https://studio.glassnode.com/charts/e710c5a0-3f26-4e8b-7fa2-28ef87c92b73
- DefiLlama, https://defillama.com/protocol/aave?events=false&borrowed_tvl=true
- Aaverank, https://aaverank.com/
- X, https://x.com/defisebs/status/1960790694509076811
- CoinGecko, https://www.coingecko.com/en/coins/bio-protocol
- Dune, https://dune.com/tk-research/bio-launchpad
Gate Research is a comprehensive blockchain and cryptocurrency research platform that provides deep content for readers, including technical analysis, market insights, industry research, trend forecasting, and macroeconomic policy analysis.
Disclaimer
Investing in cryptocurrency markets involves high risk. Users are advised to conduct their own research and fully understand the nature of the assets and products before making any investment decisions. Gate is not responsible for any losses or damages arising from such decisions.
Share
Content


Related Articles

Reflections on Ethereum Governance Following the 3074 Saga

Gate Research: 2024 Cryptocurrency Market Review and 2025 Trend Forecast

Gate Research: BTC Breaks $100K Milestone, November Crypto Trading Volume Exceeds $10 Trillion For First Time

NFTs and Memecoins in Last vs Current Bull Markets

Altseason 2025: Narrative Rotation and Capital Restructuring in an Atypical Bull Market