As this post goes live, Amazon Web Services is experiencing a major outage affecting crypto infrastructure yet again. Starting at approximately 8:00 AM UK time today, AWS issues in the US-EAST-1 region (North Virginia data centers) have taken down Coinbase along with dozens of other major crypto platforms including Robinhood, Infura, Base and Solana.
AWS has acknowledged “increased error rates” affecting Amazon DynamoDB and EC2—the core database and computing services that thousands of companies depend on. This real-time outage provides immediate, stark validation of this article’s central thesis: crypto infrastructure’s dependence on centralized cloud providers creates systemic vulnerabilities that manifest repeatedly under stress.
The timing is grimly instructive. Just ten days after the $19.3 billion liquidation cascade exposed exchange-level infrastructure failures, today’s AWS outage demonstrates that the problem extends beyond individual platforms to the foundational cloud infrastructure layer. When AWS fails, the cascading impact affects centralized exchanges, “decentralized” platforms with centralized dependencies, and countless other services simultaneously.
This is not an isolated incident but it’s a pattern. The analysis below documents similar AWS outages in April 2025, December 2021, and March 2017, each time taking down major crypto services. The question is not if the next infrastructure failure will occur, but when and what will be the trigger.
The October 10-11, 2025 Liquidation Cascade: A Case Study
The October 10-11, 2025 liquidation cascade provides an instructive case study in infrastructure failure modes. At 20:00 UTC, a major geopolitical announcement triggered market-wide selling. Within one hour, $6 billion in liquidations occurred. By the time Asian markets opened, $19.3 billion in leveraged positions had evaporated across 1.6 million trader accounts.
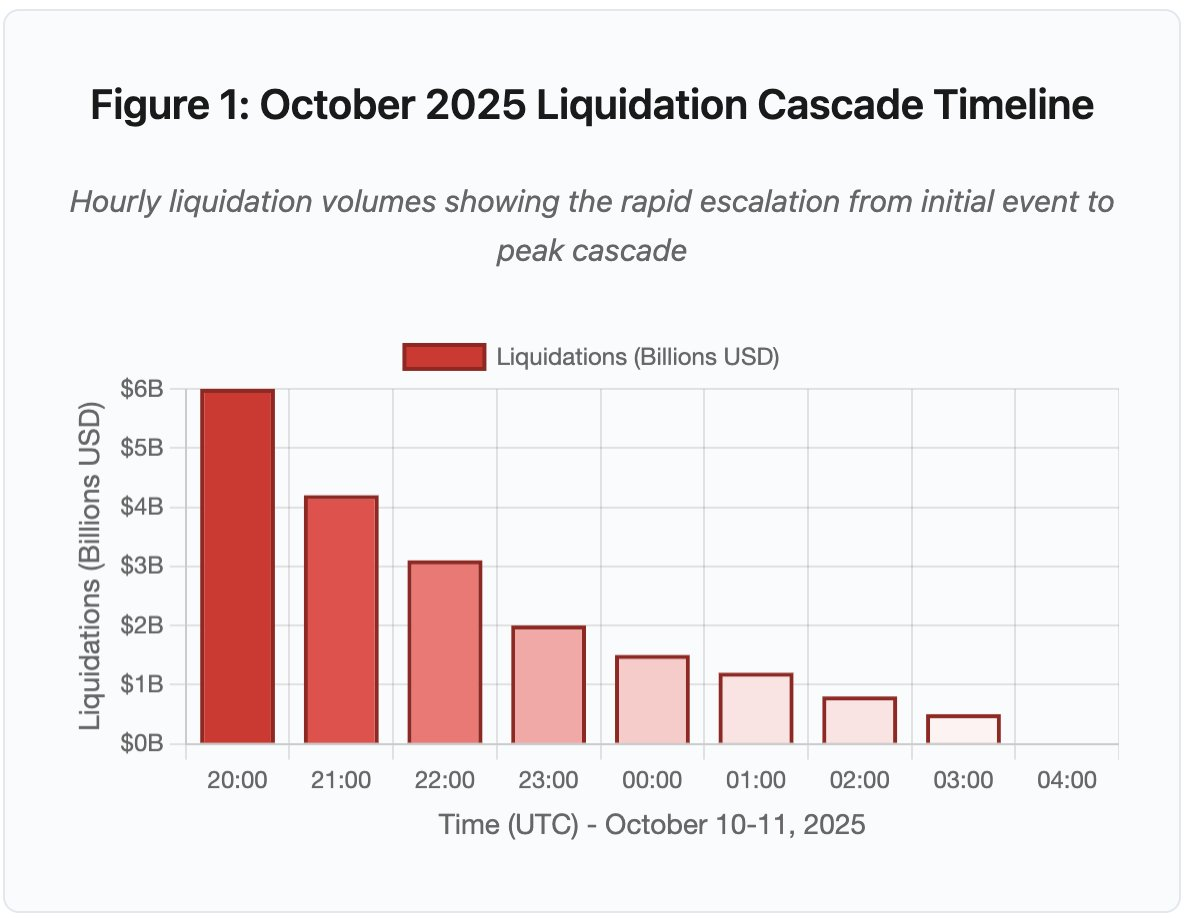
Figure 1: Timeline of October 2025 Liquidation Cascade
The interactive timeline chart shows the dramatic progression of liquidations hour by hour. The first hour alone saw $6 billion evaporate, followed by an even more intense second hour as the cascade accelerated. The visualization reveals:
- 20:00-21:00: Initial shock - $6B liquidated (red zone)
- 21:00-22:00: Peak cascade - $4.2B as API throttling begins
- 22:00-04:00: Extended degradation - $9.1B across thin markets
- Key inflection points: API rate limits, market maker retreat, order book thinning
The scale exceeds any previous crypto market event by at least an order of magnitude. Historical comparison shows the step-function nature of this event:
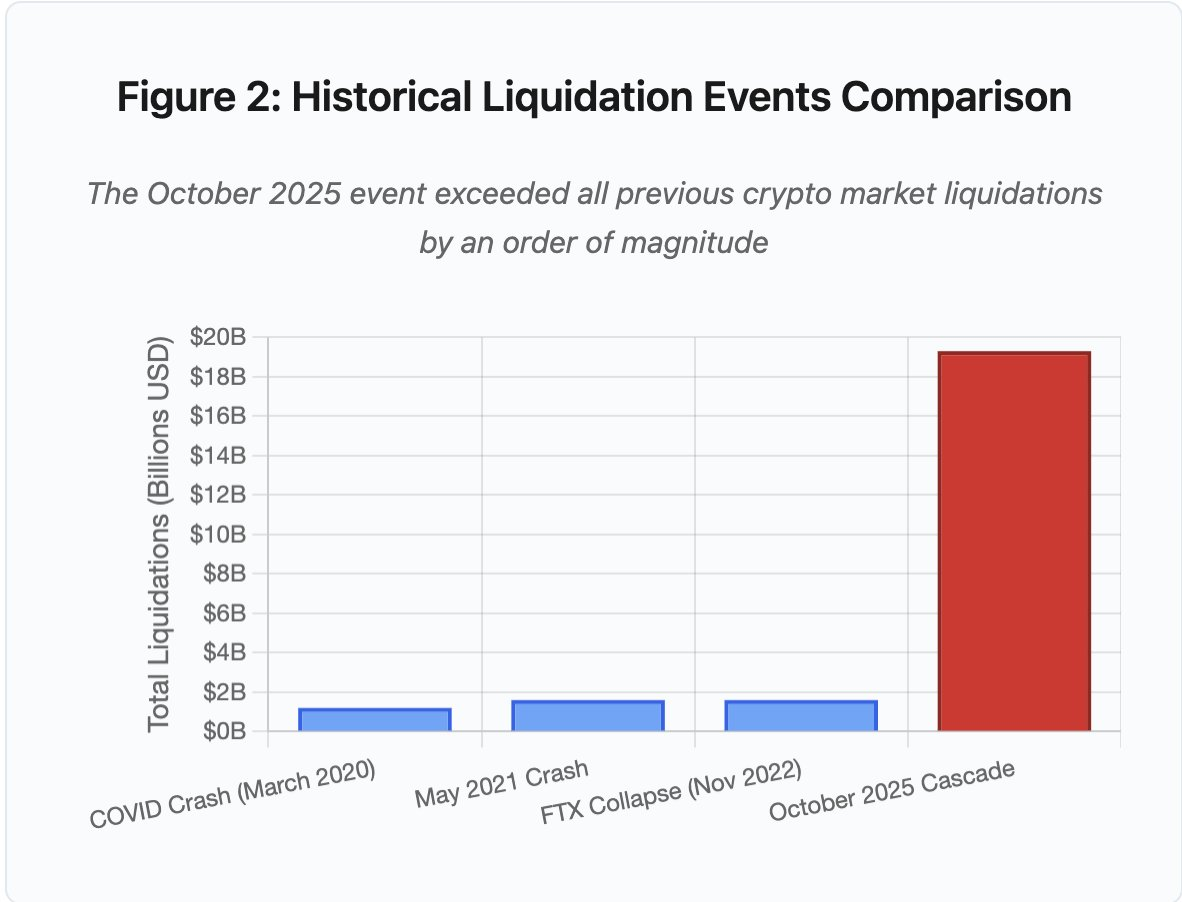
Figure 2: Historical Liquidation Events Comparison
The bar chart comparison dramatically illustrates how October 2025 stands apart:
- March 2020 (COVID): $1.2B
- May 2021 (Crash): $1.6B
- November 2022 (FTX): $1.6B
- October 2025: $19.3B ⚠️ 16x larger than previous record
But the liquidation figures tell only part of the story. The more interesting question concerns mechanism: how did external market events trigger this specific failure mode? The answer reveals systematic weaknesses in both centralized exchange infrastructure and blockchain protocol design.
Off-Chain Failures: Centralized Exchange Architecture
Infrastructure Overload and Rate Limiting
Exchange APIs implement rate limits to prevent abuse and manage server load. During normal operations, these limits allow legitimate trading while blocking potential attacks. During extreme volatility, when thousands of traders simultaneously attempt to adjust positions, these same rate limits become bottlenecks.
CEX throttles liquidation notifications to one order per second, even when processing thousands per second. During the October cascade, this created opacity. Users could not determine real-time cascade severity. Third-party monitoring tools showed hundreds of liquidations per minute while official feeds showed far fewer.
API rate limits prevented traders from modifying positions during the critical first hour. Connection requests timed out. Order submissions failed. Stop-loss orders failed to execute. Position queries returned stale data. This infrastructure bottleneck transformed a market event into an operational crisis.
Traditional exchanges provision infrastructure for normal load plus a safety margin. But normal load differs dramatically from stress load. Average daily trading volume provides poor prediction of peak stress requirements. During cascades, transaction volume spikes 100x or more. Queries to position data increase 1000x as every user simultaneously checks their account.
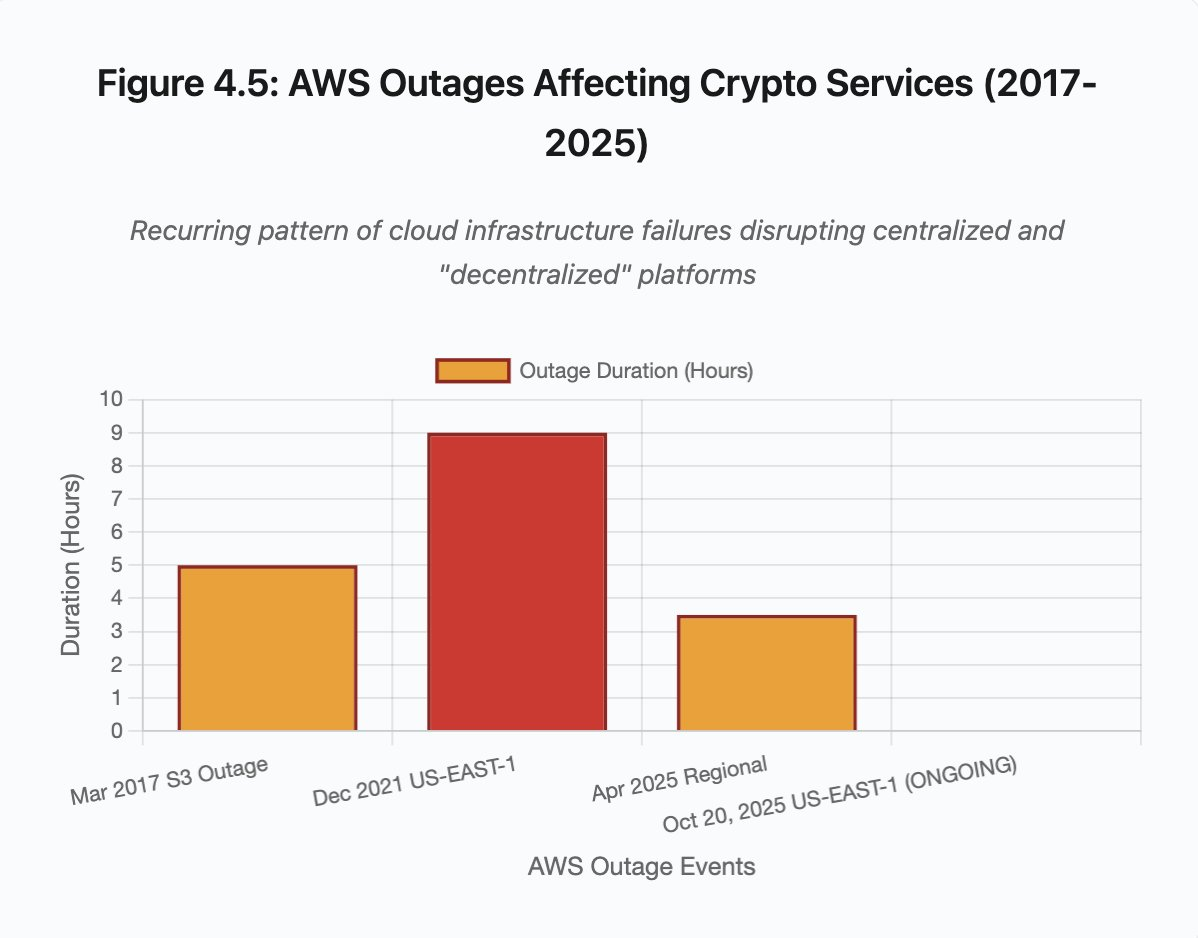
Figure 4.5: AWS Ourtages Affecting Crypto Services
Auto-scaling cloud infrastructure helps but cannot respond instantly. Spinning up additional database read replicas takes minutes. Creating new API gateway instances takes minutes. During those minutes, margin systems continue marking positions based on corrupted price data from overloaded order books.
Oracle Manipulation and Pricing Vulnerabilities
During the October cascade, a critical design choice in margin systems became apparent: some exchanges calculated collateral values based on internal spot market prices rather than external oracle feeds. During normal market conditions, arbitrageurs maintain price alignment across venues. But when infrastructure experiences stress, this coupling breaks down.
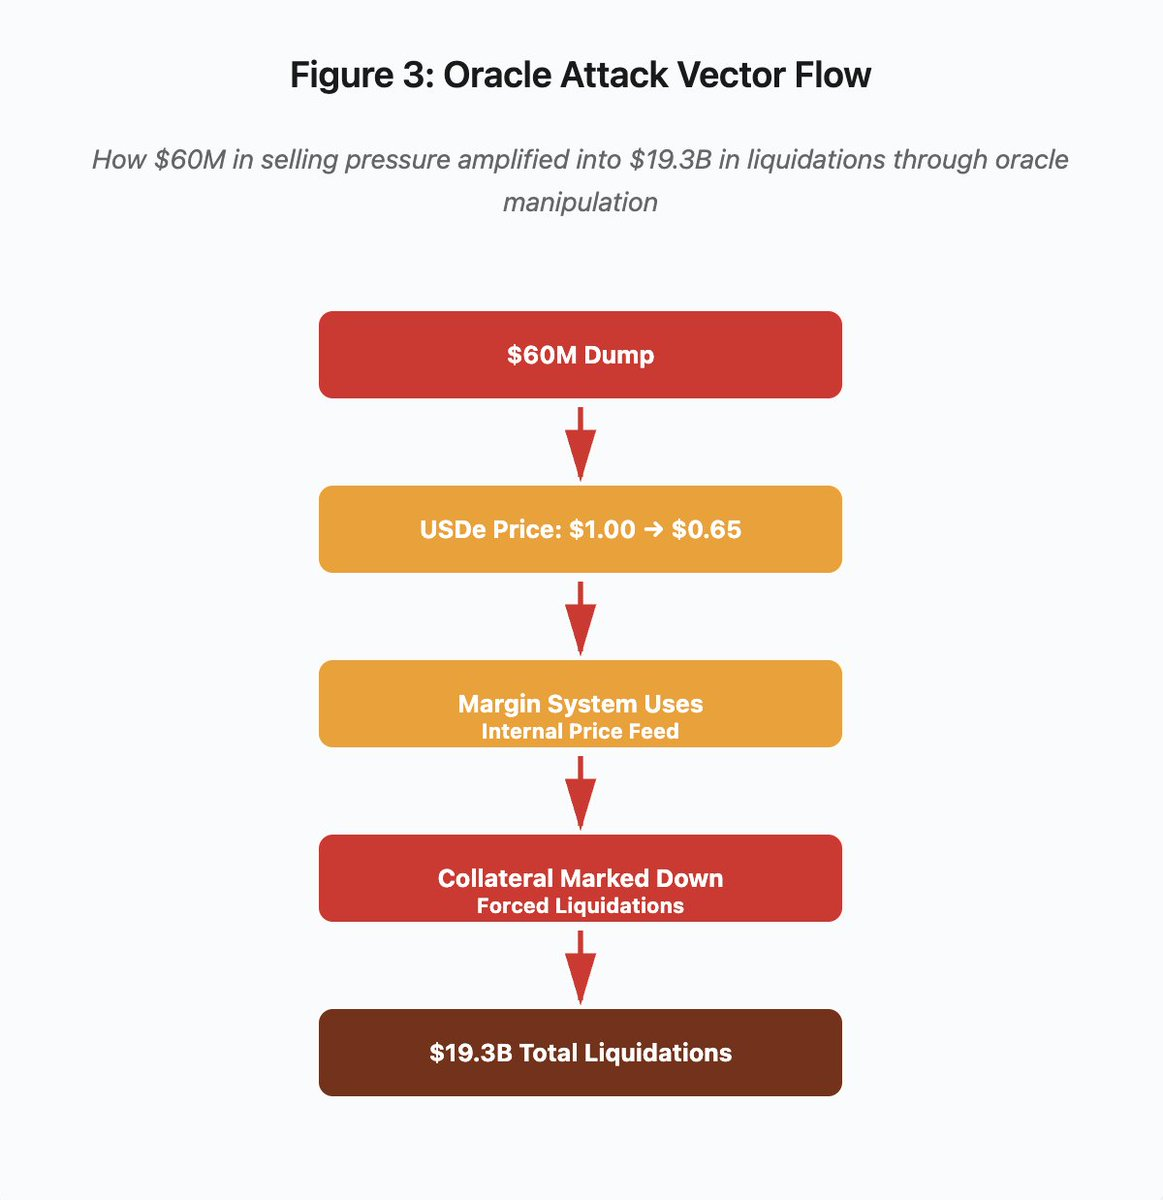
Figure 3: Oracle Manipulation Flow Diagram
The interactive flow diagram visualizes the attack vector in five stages:
- Initial Dump: $60M selling pressure on USDe
- Price Manipulation: USDe crashes from $1.00 → $0.65 on single exchange
- Oracle Failure: Margin system uses corrupted internal price feed
- Cascade Trigger: Collateral marked down, forced liquidations begin
- Amplification: $19.3B total liquidations (322x amplification)
The attack exploited Binance’s use of spot market prices for wrapped synthetic collateral. When an attacker dumped $60 million of USDe into relatively thin order books, the spot price crashed from $1.00 to $0.65. The margin system, configured to mark collateral at spot prices, revalued all USDe-collateralized positions downward by 35%. This triggered margin calls and forced liquidations across thousands of accounts.
Those liquidations forced more selling into the same illiquid market, further depressing prices. The margin system observed these lower prices and marked down even more positions. The feedback loop amplified $60 million in selling pressure into $19.3 billion in forced liquidations.
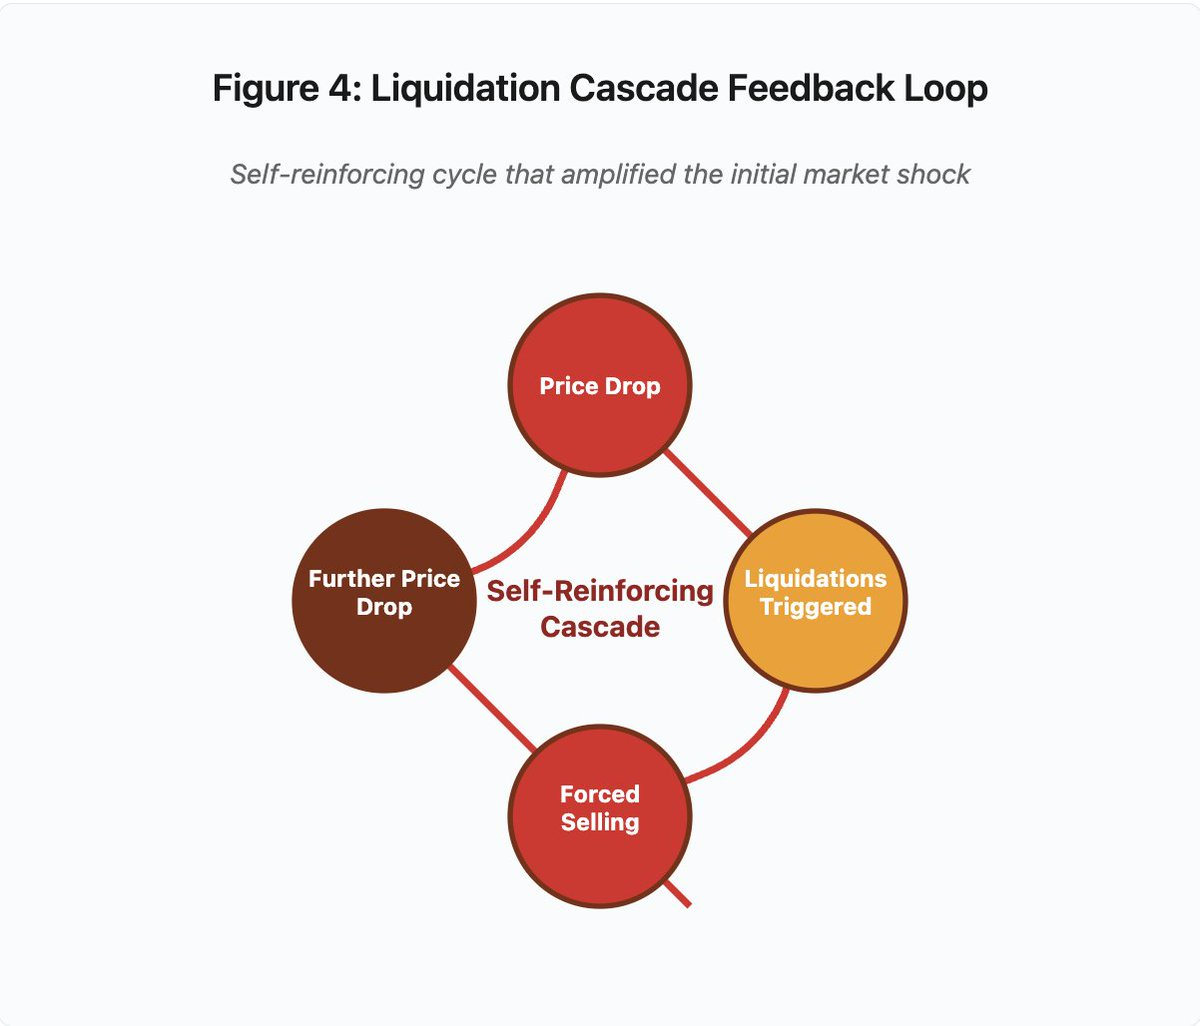
Figure 4: Liquidation Cascade Feedback Loop
The circular feedback diagram illustrates the self-reinforcing nature of the cascade:
Price Drop → Liquidations Triggered → Forced Selling → Further Price Drop → [cycle repeats]
This mechanism would not have worked with a properly designed oracle system. If Binance had used time-weighted average prices (TWAP) across multiple exchanges, the momentary price manipulation would not have affected collateral valuations. If they had used aggregated price feeds from Chainlink or other multi-source oracles, the attack would have failed.
The wBETH incident four days prior demonstrated a similar vulnerability. Wrapped Binance ETH (wBETH) should maintain a 1:1 conversion ratio with ETH. During the cascade, liquidity dried up and the wBETH/ETH spot market showed a 20% discount. The margin system marked down wBETH collateral accordingly, triggering liquidations on positions that were actually fully collateralized by the underlying ETH.
Auto-Deleveraging (ADL) Mechanisms
When liquidations cannot be executed at current market prices, exchanges implement Auto-Deleveraging to socialize losses among profitable traders. ADL forcibly closes profitable positions at current prices to cover the shortfall from liquidated positions.
During the October cascade, Binance executed ADL across multiple trading pairs. Traders with profitable long positions found their trades forcibly closed not due to their own risk management failures, but because other traders’ positions became insolvent.
ADL reflects a fundamental architectural choice in centralized derivatives trading. Exchanges guarantee they will not lose money. This means losses must be absorbed either by:
- Insurance funds (exchange capital reserved for covering liquidation shortfalls)
- ADL (forcing profitable traders to close positions)
- Socialized loss (spreading losses across all users)
The insurance fund size relative to open interest determines ADL frequency. Binance’s insurance fund totaled approximately $2 billion in October 2025. Against $4 billion in open interest across BTC, ETH, and BNB perpetual futures, this provides 50% coverage. But during the October cascade, open interest exceeded $20 billion across all pairs. The insurance fund could not cover the shortfall.
After the October cascade, Binance announced they would guarantee no ADL for BTC, ETH, and BNB USDⓈ-M contracts when total open interest remains below $4 billion. This creates an incentive structure: exchanges could maintain larger insurance funds to avoid ADL, but this ties up capital that could otherwise be deployed profitably.
On-Chain Failures: Blockchain Protocol Limitations
The bar chart compares downtime across different incidents:
- Solana (Feb 2024): 5 hours - Voting throughput bottleneck
- Polygon (Mar 2024): 11 hours - Validator version mismatch
- Optimism (Jun 2024): 2.5 hours - Sequencer overload (airdrop)
- Solana (Sep 2024): 4.5 hours - Transaction spam attack
- Arbitrum (Dec 2024): 1.5 hours - RPC provider failure
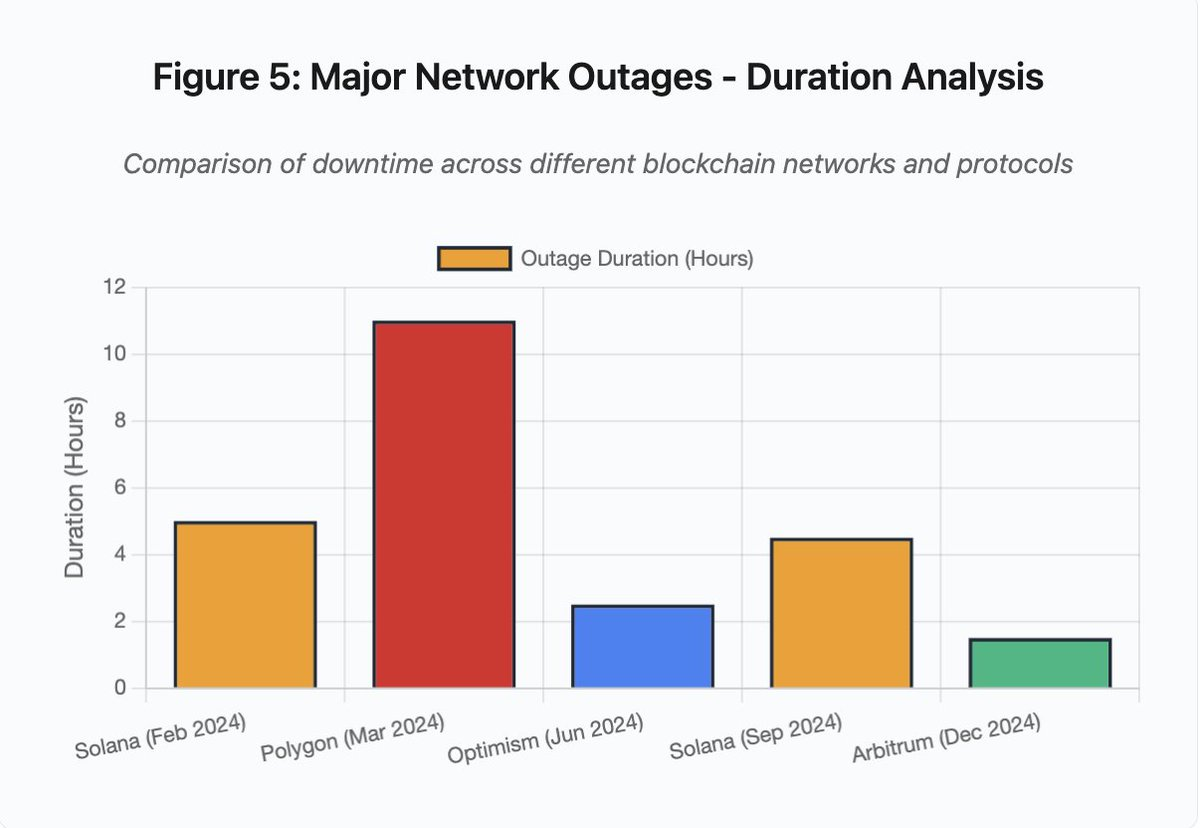
Figure 5: Major Network Outages - Duration Analysis
Solana: The Consensus Bottleneck
Solana experienced multiple outages during 2024-2025. The February 2024 outage lasted approximately 5 hours. A September 2024 outage lasted 4-5 hours. These outages stemmed from similar root causes: the network’s inability to process transaction volume during spam attacks or extreme activity.
Figure 5 Detail: The Solana outages (5 hours in Feb, 4.5 hours in Sep) highlight recurring issues with network resilience under stress.
Solana’s architecture optimizes for throughput. In ideal conditions, the network processes 3,000-5,000 transactions per second with sub-second finality. This performance exceeds Ethereum by orders of magnitude. But during stress events, this optimization creates vulnerabilities.
The September 2024 outage resulted from a flood of spam transactions that overwhelmed validator voting mechanisms. Solana validators must vote on blocks to achieve consensus. During normal operations, validators prioritize vote transactions to ensure consensus progresses. But the protocol previously treated vote transactions like regular transactions for fee market purposes.
When transaction mempool filled with millions of spam transactions, validators struggled to propagate vote transactions. Without sufficient votes, blocks could not finalize. Without finalized blocks, the chain halted. Users with pending transactions saw them stuck in mempool. New transactions failed to submit.
StatusGator documented multiple Solana service disruptions in 2024-2025 that Solana never officially acknowledged. This creates information asymmetry. Users cannot distinguish between local connectivity issues and network-wide problems. Third-party monitoring services provide accountability, but platforms should maintain comprehensive status pages.
Ethereum: The Gas Fee Explosion
Ethereum experienced extreme gas fee spikes during the 2021 DeFi boom. Transaction fees exceeded $100 for simple transfers. Complex smart contract interactions cost $500-1000. These fees made the network unusable for smaller transactions while enabling a different attack vector: MEV extraction.
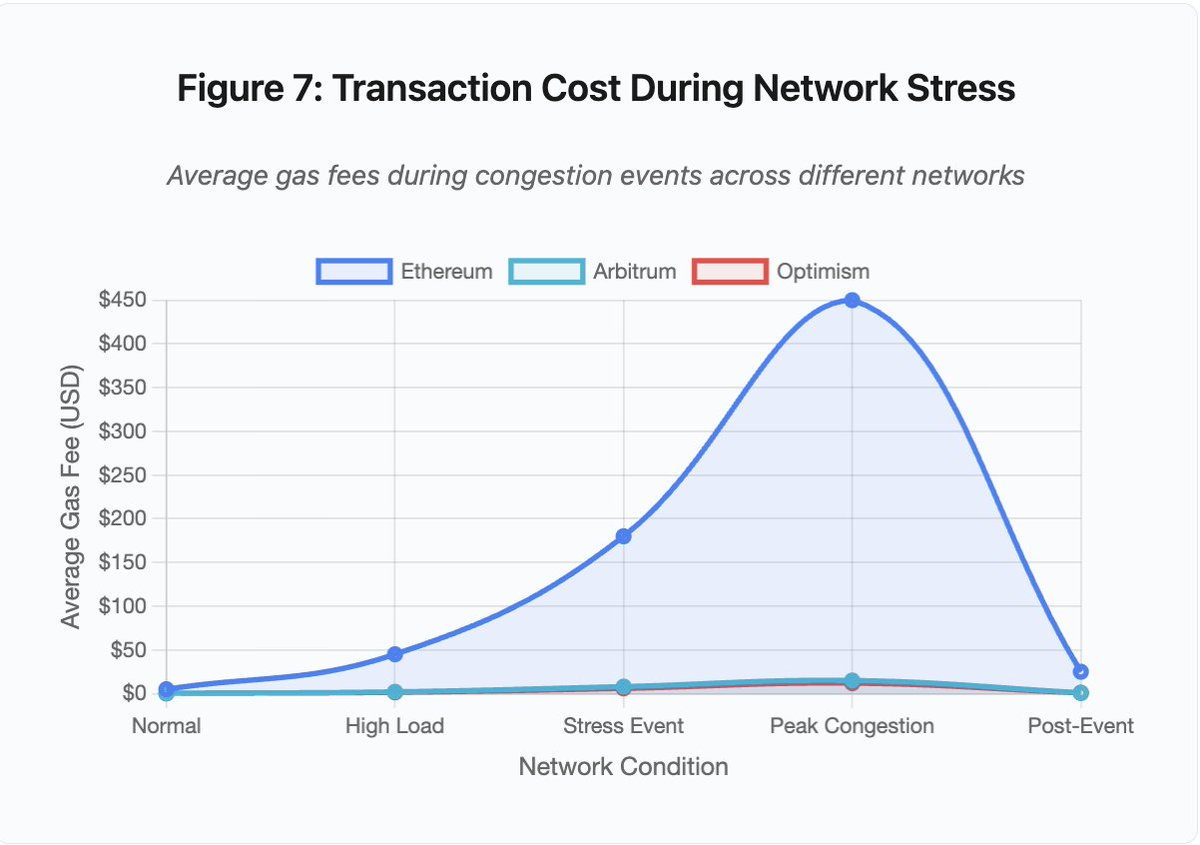
Figure 7: Transaction Cost During Network Stress
This line chart dramatically shows gas fee escalation across networks during stress events:
- Ethereum: $5 (normal) → $450 (peak congestion) - 90x increase
- Arbitrum: $0.50 → $15 - 30x increase
- Optimism: $0.30 → $12 - 40x increase
The visualization demonstrates that even Layer 2 solutions experience significant fee escalation, though starting from a much lower base.
Maximal Extractable Value (MEV) describes profits validators can extract by reordering, including, or excluding transactions. During high gas fee environments, MEV becomes particularly lucrative. Arbitrageurs compete to front-run large DEX trades. Liquidation bots compete to liquidate undercollateralized positions first. This competition manifests as gas fee bidding wars.
Users wanting to ensure transaction inclusion during congestion must outbid MEV bots. This creates scenarios where the transaction fee exceeds the transaction value. Want to claim your $100 airdrop? Pay $150 in gas fees. Need to add collateral to avoid liquidation? Compete with bots paying $500 for priority.
Ethereum’s gas limit caps total computation per block. During congestion, users bid for scarce block space. The fee market works as designed: higher bids get priority. But this design makes the network increasingly expensive during high usage, which occurs precisely when users most need access.
Layer 2 solutions attempted to solve this problem by moving computation off-chain while inheriting Ethereum’s security through periodic settlement. Optimism, Arbitrum, and other rollups process thousands of transactions off-chain, then submit compressed proofs to Ethereum. This architecture successfully reduces per-transaction costs during normal operations.
Layer 2: The Sequencer Bottleneck
But Layer 2 solutions introduce new bottlenecks. Optimism experienced an outage when 250,000 addresses simultaneously claimed airdrops in June 2024. The sequencer—the component that orders transactions before submitting them to Ethereum—became overwhelmed. Users could not submit transactions for several hours.
This outage revealed that moving computation off-chain does not eliminate infrastructure requirements. Sequencers must process incoming transactions, order them, execute them, and generate fraud proofs or ZK proofs for Ethereum settlement. During extreme traffic, sequencers face the same scaling challenges as standalone blockchains.
Multiple RPC providers must remain available. If the primary provider fails, users should seamlessly failover to alternatives. During the Optimism outage, some RPC providers remained functional while others failed. Users whose wallets defaulted to failed providers could not interact with the chain even though the chain itself remained live.
AWS outages have repeatedly demonstrated concentrated infrastructure risk across the crypto ecosystem:
- October 20, 2025 (Today): US-EAST-1 region outage affecting Coinbase, along with Venmo, Robinhood, and Chime. AWS acknowledged increased error rates in DynamoDB and EC2 services.
- April 2025: Regional outage affecting Binance, KuCoin, and MEXC simultaneously. Multiple major exchanges became unavailable when their AWS-hosted components failed.
- December 2021: US-EAST-1 outage took down Coinbase, Binance.US, and the “decentralized” exchange dYdX for 8-9 hours, affecting Amazon’s own warehouses and major streaming services.
- March 2017: S3 outage prevented users from signing into Coinbase and GDAX for five hours, alongside widespread internet disruption.
The pattern is clear: these exchanges host critical components on AWS infrastructure. When AWS experiences regional outages, multiple major exchanges and services simultaneously become unavailable. Users cannot access funds, execute trades, or modify positions during outages—precisely when market volatility might require immediate action.
Polygon: The Consensus Version Mismatch
Polygon (previously Matic) experienced an 11-hour outage in March 2024. The root cause involved validator version mismatches. Some validators ran older software versions while others ran upgraded versions. These versions computed state transitions differently.
Figure 5 Detail: The Polygon outage (11 hours) was the longest among major incidents analyzed, highlighting the severity of consensus failures.
When validators reached different conclusions about correct state, consensus failed. The chain could not produce new blocks because validators could not agree on block validity. This created a deadlock: validators running old software rejected blocks from validators running new software, while validators running new software rejected blocks from old software.
Resolution required coordinated validator upgrades. But coordinating validator upgrades during an outage takes time. Each validator operator must be contacted, must deploy the correct software version, and must restart their validator. In a decentralized network with hundreds of independent validators, this coordination spans hours or days.
Hard forks typically use block height triggers. All validators upgrade by a specific block height, ensuring simultaneous activation. But this requires advance coordination. Incremental upgrades, where validators gradually adopt new versions, risk creating the precise version mismatch that caused Polygon’s outage.
Architectural Tradeoffs
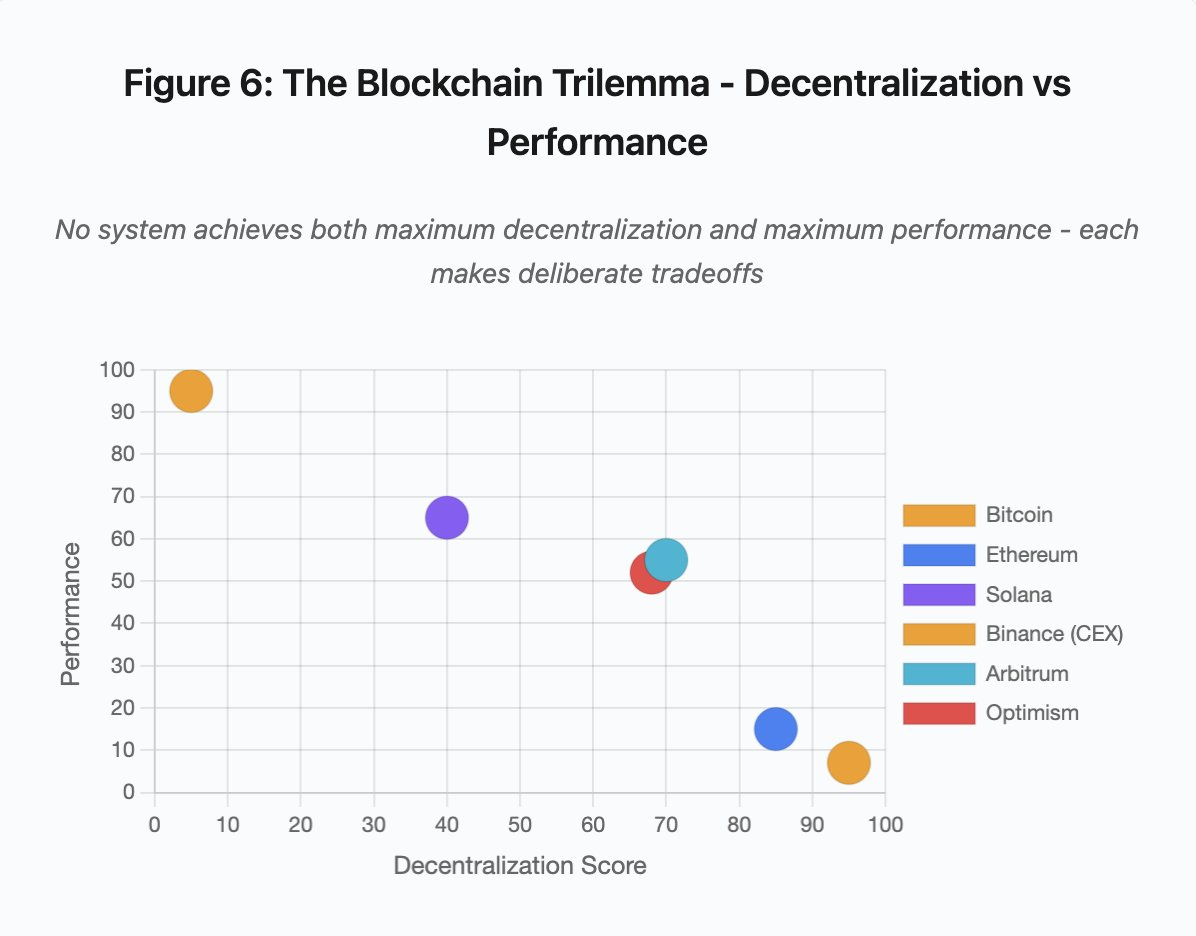
Figure 6: The Blockchain Trilemma - Decentralization vs Performance
This scatter plot visualization maps different systems across two critical dimensions:
- Bitcoin: High decentralization, Low performance
- Ethereum: High decentralization, Moderate performance
- Solana: Medium decentralization, High performance
- Binance (CEX): Minimal decentralization, Maximum performance
- Arbitrum/Optimism: Medium-high decentralization, Medium performance
Key Insight: No system achieves both maximum decentralization and maximum performance. Each design makes deliberate tradeoffs for different use cases.
Centralized exchanges achieve low latency through architectural simplicity. Matching engines process orders in microseconds. State lives in central databases. No consensus protocol introduces overhead. But this simplicity creates single points of failure. When infrastructure experiences stress, cascading failures propagate through tightly coupled systems.
Decentralized protocols distribute state across validators, eliminating single points of failure. High-throughput chains maintain this property during outages (no funds lost, only liveness temporarily compromised). But achieving consensus across distributed validators introduces computational overhead. Validators must reach agreement before state transitions finalize. When validators run incompatible versions or face overwhelming traffic, consensus processes may temporarily halt.
Adding replicas improves fault tolerance but increases coordination costs. Each additional validator in a Byzantine fault-tolerant system adds communication overhead. High-throughput architectures minimize this overhead through optimized validator communication, enabling superior performance but creating vulnerability to certain attack patterns. Security-focused architectures prioritize validator diversity and consensus robustness, limiting base layer throughput while maximizing resilience.
Layer 2 solutions attempt to provide both properties through hierarchical design. They inherit Ethereum’s security properties through L1 settlement while providing high throughput through off-chain computation. However, they introduce new bottlenecks at sequencer and RPC layers, demonstrating that architectural complexity creates new failure modes even while solving others.
Scaling Remains the Fundamental Problem
These incidents reveal a consistent pattern: systems provision for normal load, then fail catastrophically under stress. Solana handled routine traffic effectively but collapsed when transaction volume increased 10,000%. Ethereum gas fees remained reasonable until DeFi adoption triggered congestion. Optimism’s infrastructure worked fine until 250,000 addresses simultaneously claimed airdrops. Binance’s APIs functioned during normal trading but throttled during liquidation cascades.
The October 2025 event demonstrated this dynamic at exchange level. During normal operations, Binance’s API rate limits and database connections suffice. Under liquidation cascades, when every trader simultaneously attempts to adjust positions, these limits become bottlenecks. The margin system, designed to protect the exchange through forced liquidations, amplified the crisis by creating forced sellers at the worst moment.
Auto-scaling provides insufficient protection against step-function load increases. Spinning up additional servers takes minutes. During those minutes, margin systems mark positions based on corrupted price data from thin order books. By the time new capacity comes online, the cascade has propagated.
Over-provisioning for rare stress events costs money during normal operations. Exchange operators optimize for typical load, accepting occasional failures as economically rational. The costs of downtime externalize to users who experience liquidations, stuck transactions, or inability to access funds during critical market movements.
Infrastructure Improvements
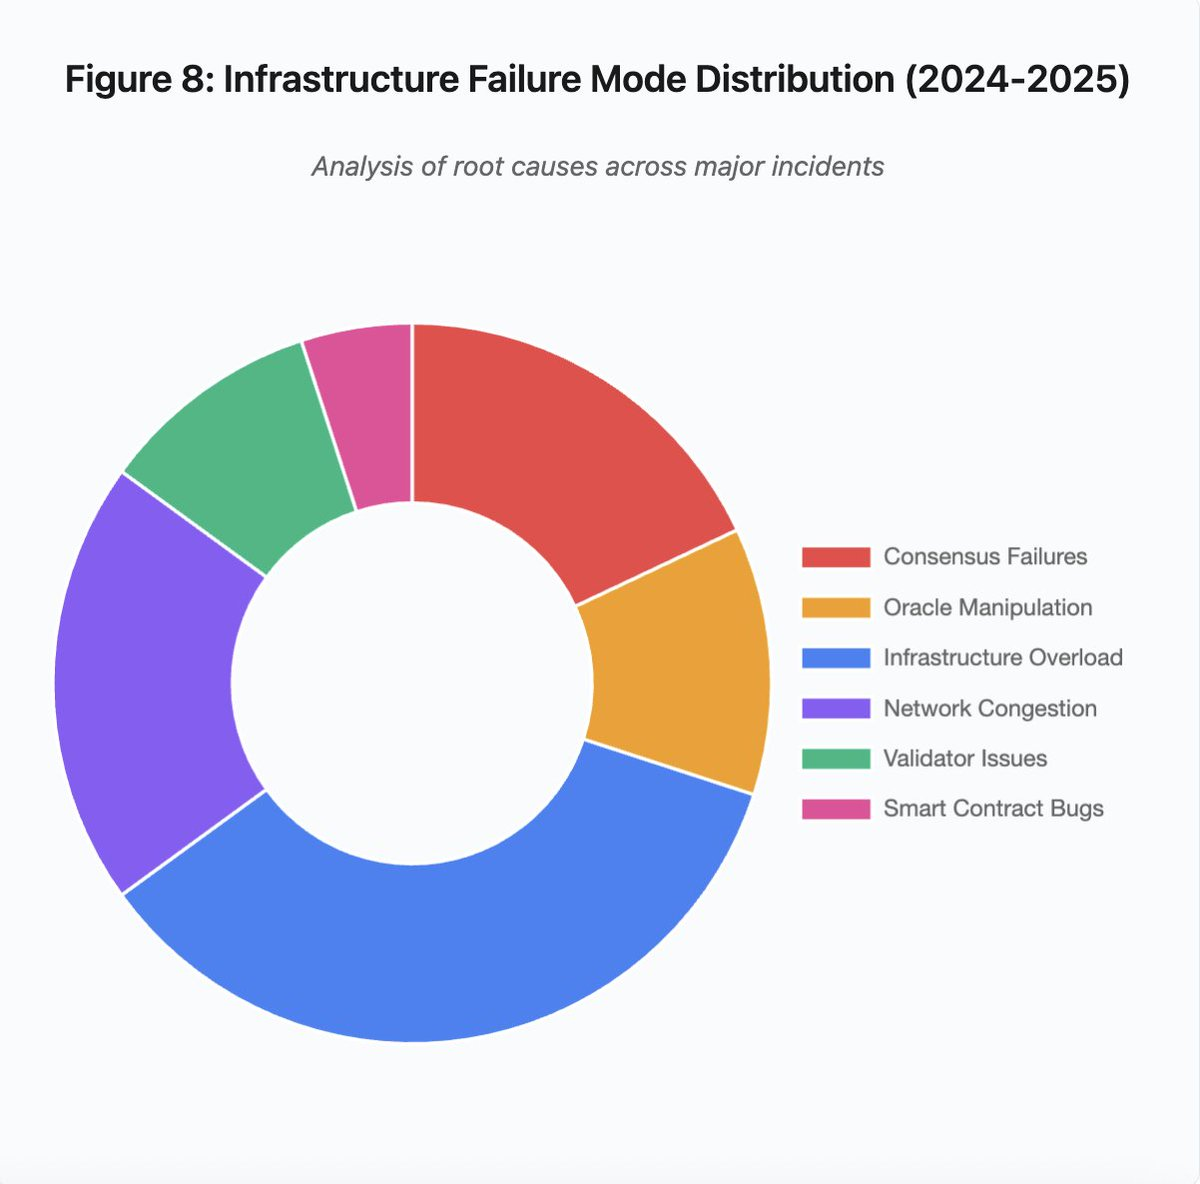
Figure 8: Infrastructure Failure Mode Distribution (2024-2025)
The pie chart breakdown of root causes reveals:
- Infrastructure Overload: 35% (most common)
- Network Congestion: 20%
- Consensus Failures: 18%
- Oracle Manipulation: 12%
- Validator Issues: 10%
- Smart Contract Bugs: 5%
Several architectural changes could reduce failure frequency and severity, though each involves tradeoffs:
1. Separation of Pricing and Liquidation Systems
October issue stemmed partly from coupling margin calculations to spot market prices. Using conversion ratios for wrapped assets instead of spot prices would have prevented wBETH mispricing. More generally, critical risk management systems should not depend on potentially manipulated market data. Independent oracle systems with multi-source aggregation and TWAP calculations provide more robust price feeds.
2. Over-Provisioning and Redundant Infrastructure
The April 2025 AWS outage affecting Binance, KuCoin, and MEXC demonstrated risks of concentrated infrastructure dependencies. Running critical components across multiple cloud providers increases operational complexity and cost but eliminates correlated failures. Layer 2 networks could maintain multiple RPC providers with automatic failover. The additional expense seems wasteful during normal operations but prevents multi-hour downtimes during peak demand.
3. Enhanced Stress Testing and Capacity Planning
The pattern of systems working fine until they fail suggests insufficient testing under stress. Simulating 100x normal load should be standard practice. Identifying bottlenecks in development costs less than discovering them during actual outages. However, realistic load testing remains challenging. Production traffic exhibits patterns that synthetic testing cannot fully capture. Users behave differently during actual crashes than during tests.
The Path Forward
Over-provisioning provides the most reliable solution but conflicts with economic incentives. Maintaining 10x excess capacity for rare events costs money every day to prevent problems occurring once annually. Until catastrophic failures impose sufficient costs to justify over-provisioning, systems will continue failing under stress.
Regulatory pressure may force change. If regulations mandate 99.9% uptime or limit acceptable downtime, exchanges would need to over-provision. But regulations typically follow disasters rather than preventing them. Mt. Gox’s 2014 collapse led Japan to create formal cryptocurrency exchange regulations. The October 2025 cascade will likely trigger similar regulatory responses. Whether those responses specify outcomes (maximum acceptable downtime, maximum slippage during liquidations) or implementations (specific oracle providers, circuit breaker thresholds) remains uncertain.
The fundamental challenge is that these systems operate continuously in global markets but rely on infrastructure designed for traditional business hours. When stress occurs at 02:00, teams scramble to deploy fixes while users face mounting losses. Traditional markets halt trading during stress; crypto markets just melt down. Whether this represents feature or bug depends on perspective and position.
Blockchain systems have achieved remarkable technical sophistication in short timeframes. Maintaining distributed consensus across thousands of nodes represents genuine engineering achievement. But achieving reliability under stress requires moving beyond prototype architectures to production-grade infrastructure. That transition costs money and requires prioritizing robustness over feature velocity.
The challenge lies in prioritizing robustness over growth during bull markets when everyone makes money and downtime seems like someone else’s problem. By the time the next cycle stress-tests the system, new weaknesses will have emerged. Whether the industry learns from October 2025 or repeats similar patterns remains an open question. History suggests we will discover the next critical vulnerability through another multi-billion dollar failure under stress.
Analysis based on public market data and platform statements. The views expressed are mine alone, informed by but not representing any entity.
Disclaimer:
- This article is reprinted from [yq_acc]. All copyrights belong to the original author [yq_acc]. If there are objections to this reprint, please contact the Gate Learn team, and they will handle it promptly.
- Liability Disclaimer: The views and opinions expressed in this article are solely those of the author and do not constitute any investment advice.
- Translations of the article into other languages are done by the Gate Learn team. Unless mentioned, copying, distributing, or plagiarizing the translated articles is prohibited.