2025 QNT Price Prediction: Analyzing Market Trends and Potential Growth Factors for Quant Network
Introduction: QNT's Market Position and Investment Value
Quant (QNT), as a technology provider enabling trusted digital interaction, has been making significant strides since its inception in 2018. As of 2025, Quant's market capitalization has reached $1.49 billion, with a circulating supply of approximately 14.54 million coins, and a price hovering around $102.54. This asset, often referred to as the "interoperability solution," is playing an increasingly crucial role in blockchain innovation and enterprise adoption.
This article will comprehensively analyze Quant's price trends from 2025 to 2030, combining historical patterns, market supply and demand, ecosystem development, and macroeconomic factors to provide investors with professional price predictions and practical investment strategies.
I. QNT Price History Review and Current Market Status
QNT Historical Price Evolution
- 2018: Initial launch, price started at $1.6
- 2021: Reached all-time high of $427.42 on September 11
- 2022-2023: Market downturn, price dropped to lower levels
QNT Current Market Situation
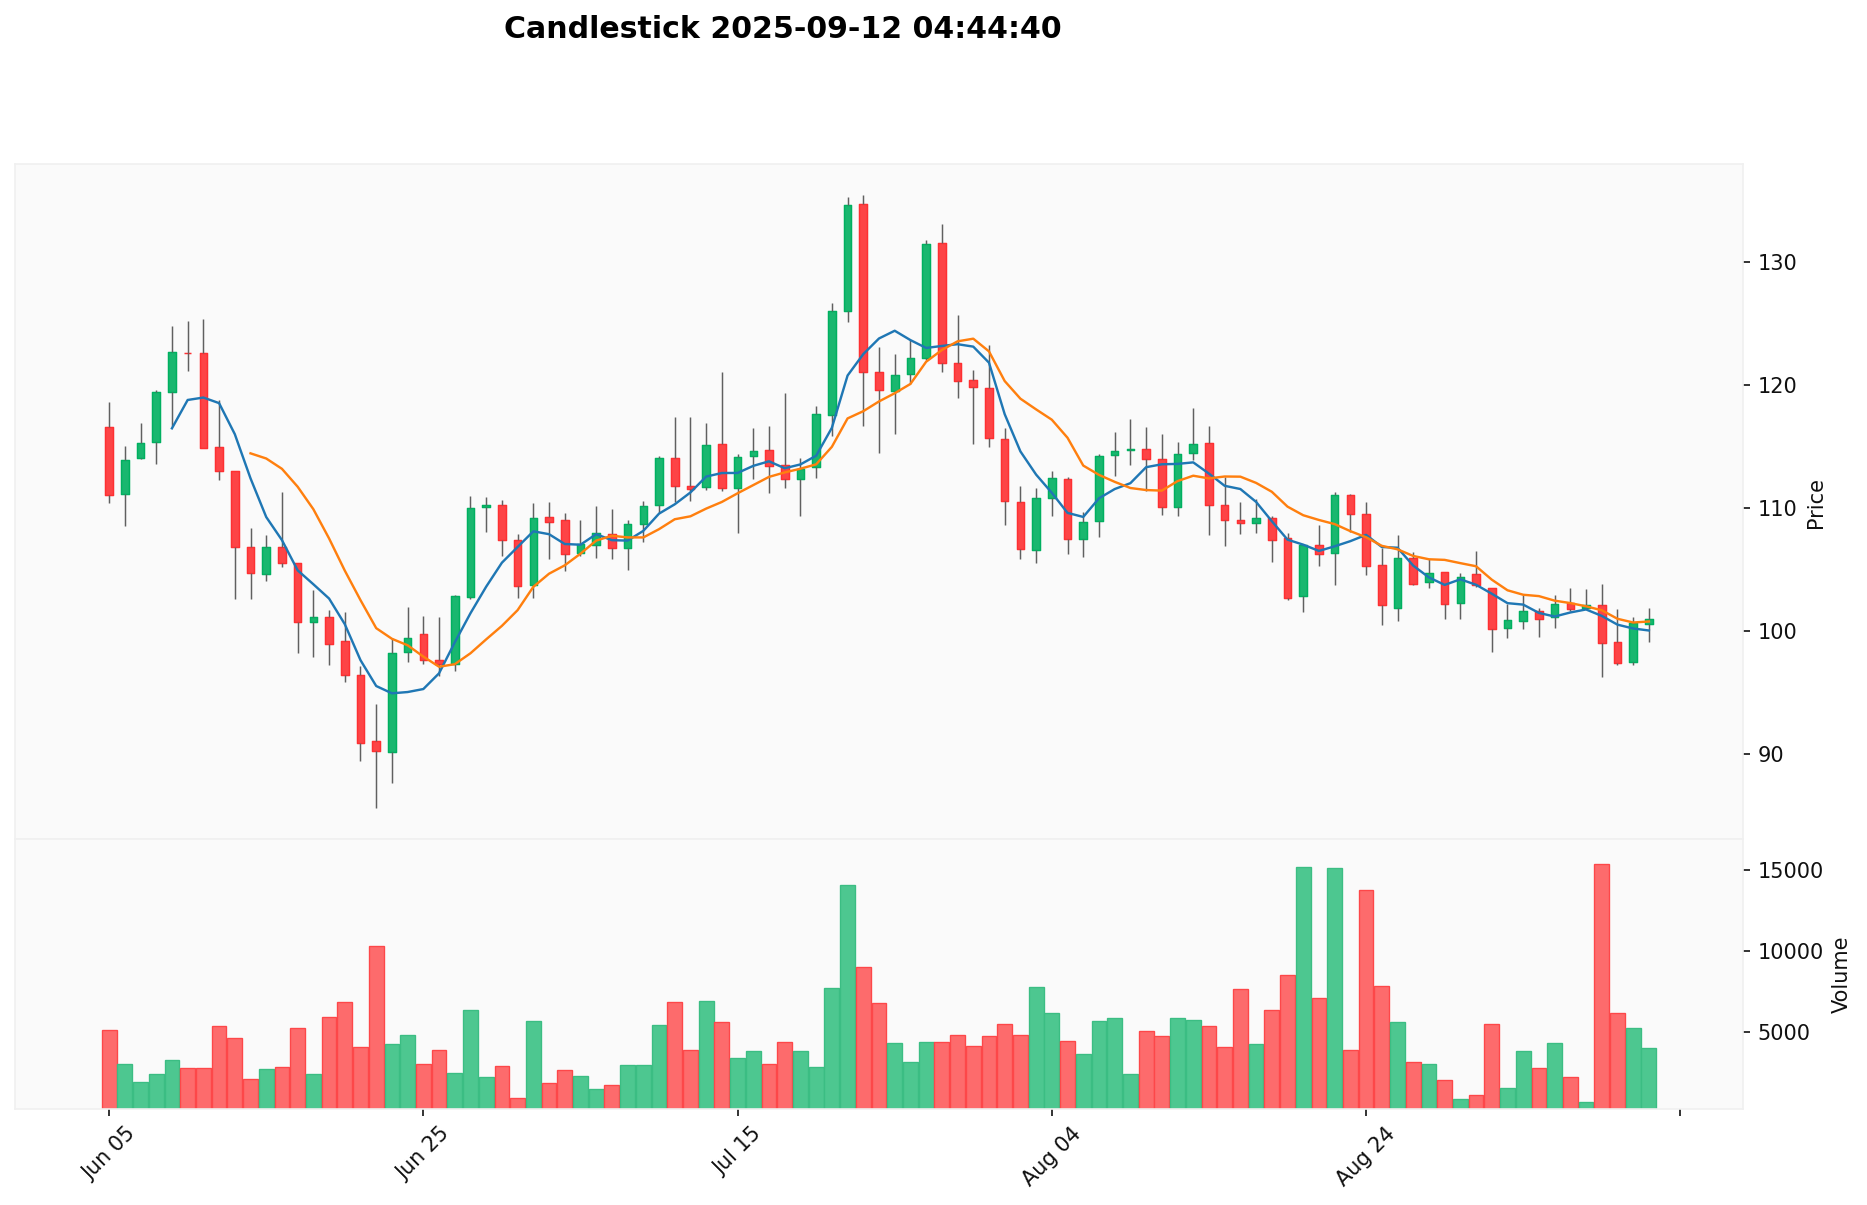
As of September 12, 2025, QNT is trading at $102.54. The token has shown a positive 1.01% change in the last 24 hours and a 1.88% increase over the past week. However, it has experienced a decline of 11.19% in the last 30 days. The current price is still significantly below its all-time high, but it has maintained a strong 45.06% growth over the past year.
QNT's market capitalization stands at $1,491,359,823, ranking it 87th in the global cryptocurrency market. The circulating supply is 14,544,176 QNT tokens, with a total supply of 14,881,364 and a maximum supply cap of 45,467,000 tokens.
The 24-hour trading volume for QNT is $426,147, indicating moderate market activity. The token's current price is well above its all-time low of $0.215773, recorded on August 23, 2018, showcasing significant long-term growth despite recent market fluctuations.
Click to view the current QNT market price
QNT Market Sentiment Indicator
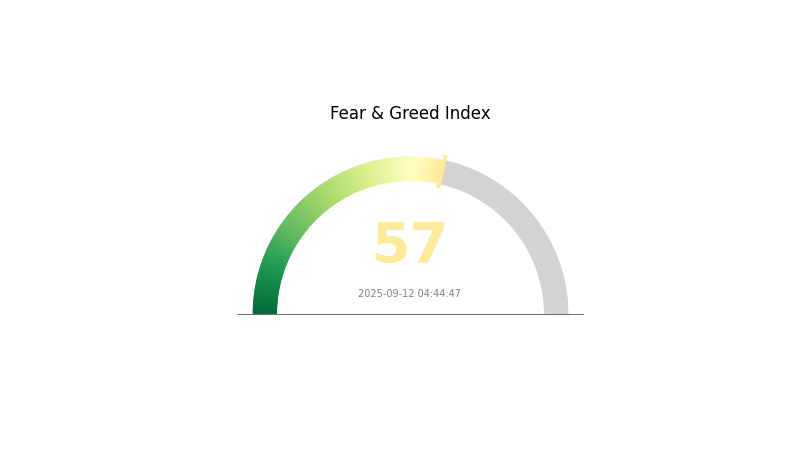
2025-09-12 Fear and Greed Index: 57 (Greed)
Click to view the current Fear & Greed Index
The crypto market is currently experiencing a period of greed, with the Fear and Greed Index sitting at 57. This indicates growing optimism among investors, potentially driving up QNT prices. However, traders should remain cautious as excessive greed can lead to market corrections. It's crucial to maintain a balanced approach, conducting thorough research and risk assessment before making any investment decisions. Keep an eye on market trends and use Gate.com's tools to stay informed about QNT's performance in this greedy market climate.
QNT Holdings Distribution
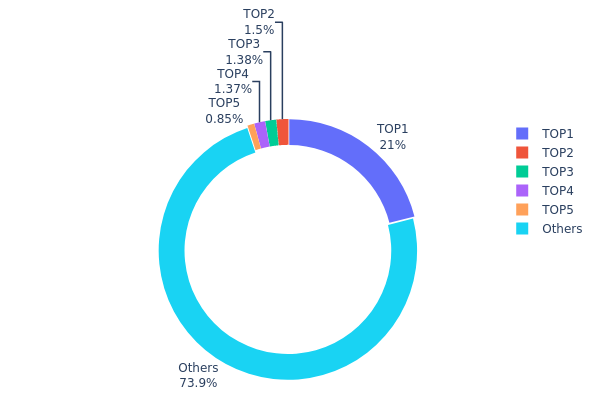
The address holdings distribution data for QNT reveals a relatively concentrated ownership structure. The top address holds a significant 21% of the total supply, with 9.55 million QNT tokens. This concentration is notable, as it represents a substantial influence on the token's circulating supply. The subsequent top four addresses hold considerably smaller portions, ranging from 1.49% to 0.85% of the total supply.
Despite the dominance of the top address, the overall distribution shows signs of decentralization. Approximately 73.93% of QNT tokens are held by addresses outside the top five, indicating a wide distribution among smaller holders. This distribution pattern suggests a balance between major stakeholders and a broader community of token holders, which could contribute to market stability and resistance to manipulation by any single entity.
The current holdings distribution reflects a market structure with a significant anchor holder, potentially a foundation or major institutional investor, balanced by a diverse base of smaller holders. This structure may lead to reduced volatility in normal market conditions but could also present risks of price swings if the top holder decides to make substantial moves. The relatively wide distribution among other holders could serve as a buffer against extreme market manipulations.
Click to view the current QNT Holdings Distribution
| Top | Address | Holding Qty | Holding (%) |
|---|---|---|---|
| 1 | 0x4a22...254675 | 9550.59K | 21.00% |
| 2 | 0xf977...41acec | 679.76K | 1.49% |
| 3 | 0x48e9...04a170 | 625.78K | 1.37% |
| 4 | 0x8266...22d78b | 622.81K | 1.36% |
| 5 | 0x7e8b...8e594c | 386.67K | 0.85% |
| - | Others | 33601.40K | 73.93% |
II. Key Factors Affecting QNT's Future Price
Supply Mechanism
- Total Supply: The total supply of QNT is capped at 14,881,364 tokens.
- Circulating Supply: Currently, there are 12,072,738 QNT tokens in circulation.
- Current Impact: The limited supply and high percentage of tokens already in circulation may create scarcity, potentially supporting the price.
Institutional and Whale Dynamics
- Whale Activity: In the past 24 hours, whale-level transaction volume for QNT increased by nearly 1000%, indicating significant activity from large investors.
- Current Impact: The surge in whale activity could lead to increased price volatility and potentially influence market trends.
Macroeconomic Environment
- Inflation Hedging Properties: As a cryptocurrency, QNT may be viewed as a potential hedge against inflation, similar to other digital assets.
Technological Development and Ecosystem Building
- Interoperability: QNT is designed to facilitate interoperability between different blockchain networks, which could be a key factor in its future adoption and value.
- Ecosystem Applications: Quant Network, the platform behind QNT, focuses on enterprise blockchain solutions, which may drive its utility and demand in the business sector.
III. QNT Price Prediction for 2025-2030
2025 Outlook
- Conservative prediction: $60.50 - $90.00
- Neutral prediction: $90.00 - $102.54
- Optimistic prediction: $102.54 - $114.84 (requires favorable market conditions and increased adoption)
2027-2028 Outlook
- Market stage expectation: Potential consolidation phase followed by steady growth
- Price range forecast:
- 2027: $80.47 - $147.73
- 2028: $91.06 - $151.33
- Key catalysts: Technological advancements, expanded use cases, and broader market acceptance
2029-2030 Long-term Outlook
- Base scenario: $142.62 - $152.61 (assuming continued adoption and market stability)
- Optimistic scenario: $162.59 - $202.97 (assuming accelerated growth and favorable regulatory environment)
- Transformative scenario: $202.97 - $250.00 (assuming breakthrough applications and mainstream integration)
- 2030-12-31: QNT $152.61 (potential year-end target based on average predictions)
| 年份 | 预测最高价 | 预测平均价格 | 预测最低价 | 涨跌幅 |
|---|---|---|---|---|
| 2025 | 114.84 | 102.54 | 60.4986 | 0 |
| 2026 | 131.52 | 108.69 | 98.91008 | 6 |
| 2027 | 147.73 | 120.11 | 80.47042 | 17 |
| 2028 | 151.33 | 133.92 | 91.06369 | 30 |
| 2029 | 162.59 | 142.62 | 108.39 | 39 |
| 2030 | 202.97 | 152.61 | 80.88083 | 48 |
IV. Professional QNT Investment Strategies and Risk Management
QNT Investment Methodology
(1) Long-term Holding Strategy
- Suitable for: Investors with a high risk tolerance and long-term vision
- Operation suggestions:
- Accumulate QNT during market dips
- Hold for at least 3-5 years to ride out market volatility
- Store in a secure hardware wallet or reputable custodial service
(2) Active Trading Strategy
- Technical analysis tools:
- Moving Averages: Use to identify trends and potential reversal points
- RSI (Relative Strength Index): Monitor overbought/oversold conditions
- Key points for swing trading:
- Set clear entry and exit points based on technical indicators
- Use stop-loss orders to limit potential losses
QNT Risk Management Framework
(1) Asset Allocation Principles
- Conservative investors: 1-3% of crypto portfolio
- Aggressive investors: 5-10% of crypto portfolio
- Professional investors: Up to 15% of crypto portfolio
(2) Risk Hedging Solutions
- Diversification: Spread investments across multiple cryptocurrencies
- Options trading: Use put options to protect against downside risk
(3) Secure Storage Solutions
- Hardware wallet recommendation: Gate Web3 Wallet
- Cold storage solution: Paper wallet for long-term holdings
- Security precautions: Enable two-factor authentication, use strong passwords
V. Potential Risks and Challenges for QNT
QNT Market Risks
- High volatility: QNT price can experience significant fluctuations
- Limited liquidity: May face challenges in large-scale trading
- Competition: Other blockchain interoperability projects may emerge
QNT Regulatory Risks
- Uncertain regulatory environment: Potential for stricter regulations on cryptocurrencies
- Cross-border compliance: Challenges in adhering to various international regulations
- Securities classification: Risk of being classified as a security in some jurisdictions
QNT Technical Risks
- Smart contract vulnerabilities: Potential for exploits in the underlying code
- Scalability challenges: May face issues as network usage increases
- Interoperability failures: Risk of incompatibility with certain blockchain networks
VI. Conclusion and Action Recommendations
QNT Investment Value Assessment
QNT presents a compelling long-term value proposition due to its focus on blockchain interoperability. However, short-term volatility and regulatory uncertainties pose significant risks.
QNT Investment Recommendations
✅ Beginners: Start with small, regular investments to build a position over time
✅ Experienced investors: Consider a mix of long-term holding and strategic trading
✅ Institutional investors: Explore partnerships with Quant Network for enterprise blockchain solutions
QNT Trading Participation Methods
- Spot trading: Buy and hold QNT on reputable exchanges like Gate.com
- Futures trading: Engage in leveraged trading for short-term price movements
- Staking: Participate in Staking programs if available to earn passive income
Cryptocurrency investments carry extremely high risks, and this article does not constitute investment advice. Investors should make decisions carefully based on their own risk tolerance and are advised to consult professional financial advisors. Never invest more than you can afford to lose.
FAQ
Can QNT reach $1000?
Yes, QNT could potentially reach $1000 by 2035, given its growing importance in the global financial ecosystem and current market trends.
How much will 1 QNT be worth in 2030?
Based on current projections, 1 QNT is expected to be worth approximately $540 by the end of 2030.
How high can quant go in 2025?
Based on predictions, Quant (QNT) could reach between $198 and $212 in 2025. However, cryptocurrency prices are highly volatile and subject to market conditions.
Does QNT crypto have a future?
Yes, QNT has a promising future. Its blockchain-agnostic design, scarcity, and patented technology position it well for long-term growth. Predictions suggest significant price increases by 2035.
Share
Content