2025 MPrice Prediction: Analyzing Macroeconomic Factors and Market Trends Influencing Future Digital Asset Valuations
Introduction: M's Market Position and Investment Value
MemeCore (M), as the first Layer 1 blockchain built for the Meme 2.0 era, has revolutionized the meme coin landscape since its inception. As of 2025, MemeCore's market capitalization has reached $3.31 billion, with a circulating supply of approximately 1.68 billion tokens, and a price hovering around $1.97. This asset, hailed as the "Viral Economy Pioneer," is playing an increasingly crucial role in transforming meme coins from short-term speculative tools into long-term cultural and economic forces.
This article will provide a comprehensive analysis of MemeCore's price trends from 2025 to 2030, combining historical patterns, market supply and demand, ecosystem development, and macroeconomic factors to offer professional price predictions and practical investment strategies for investors.
I. M Price History Review and Current Market Status
M Historical Price Evolution Trajectory
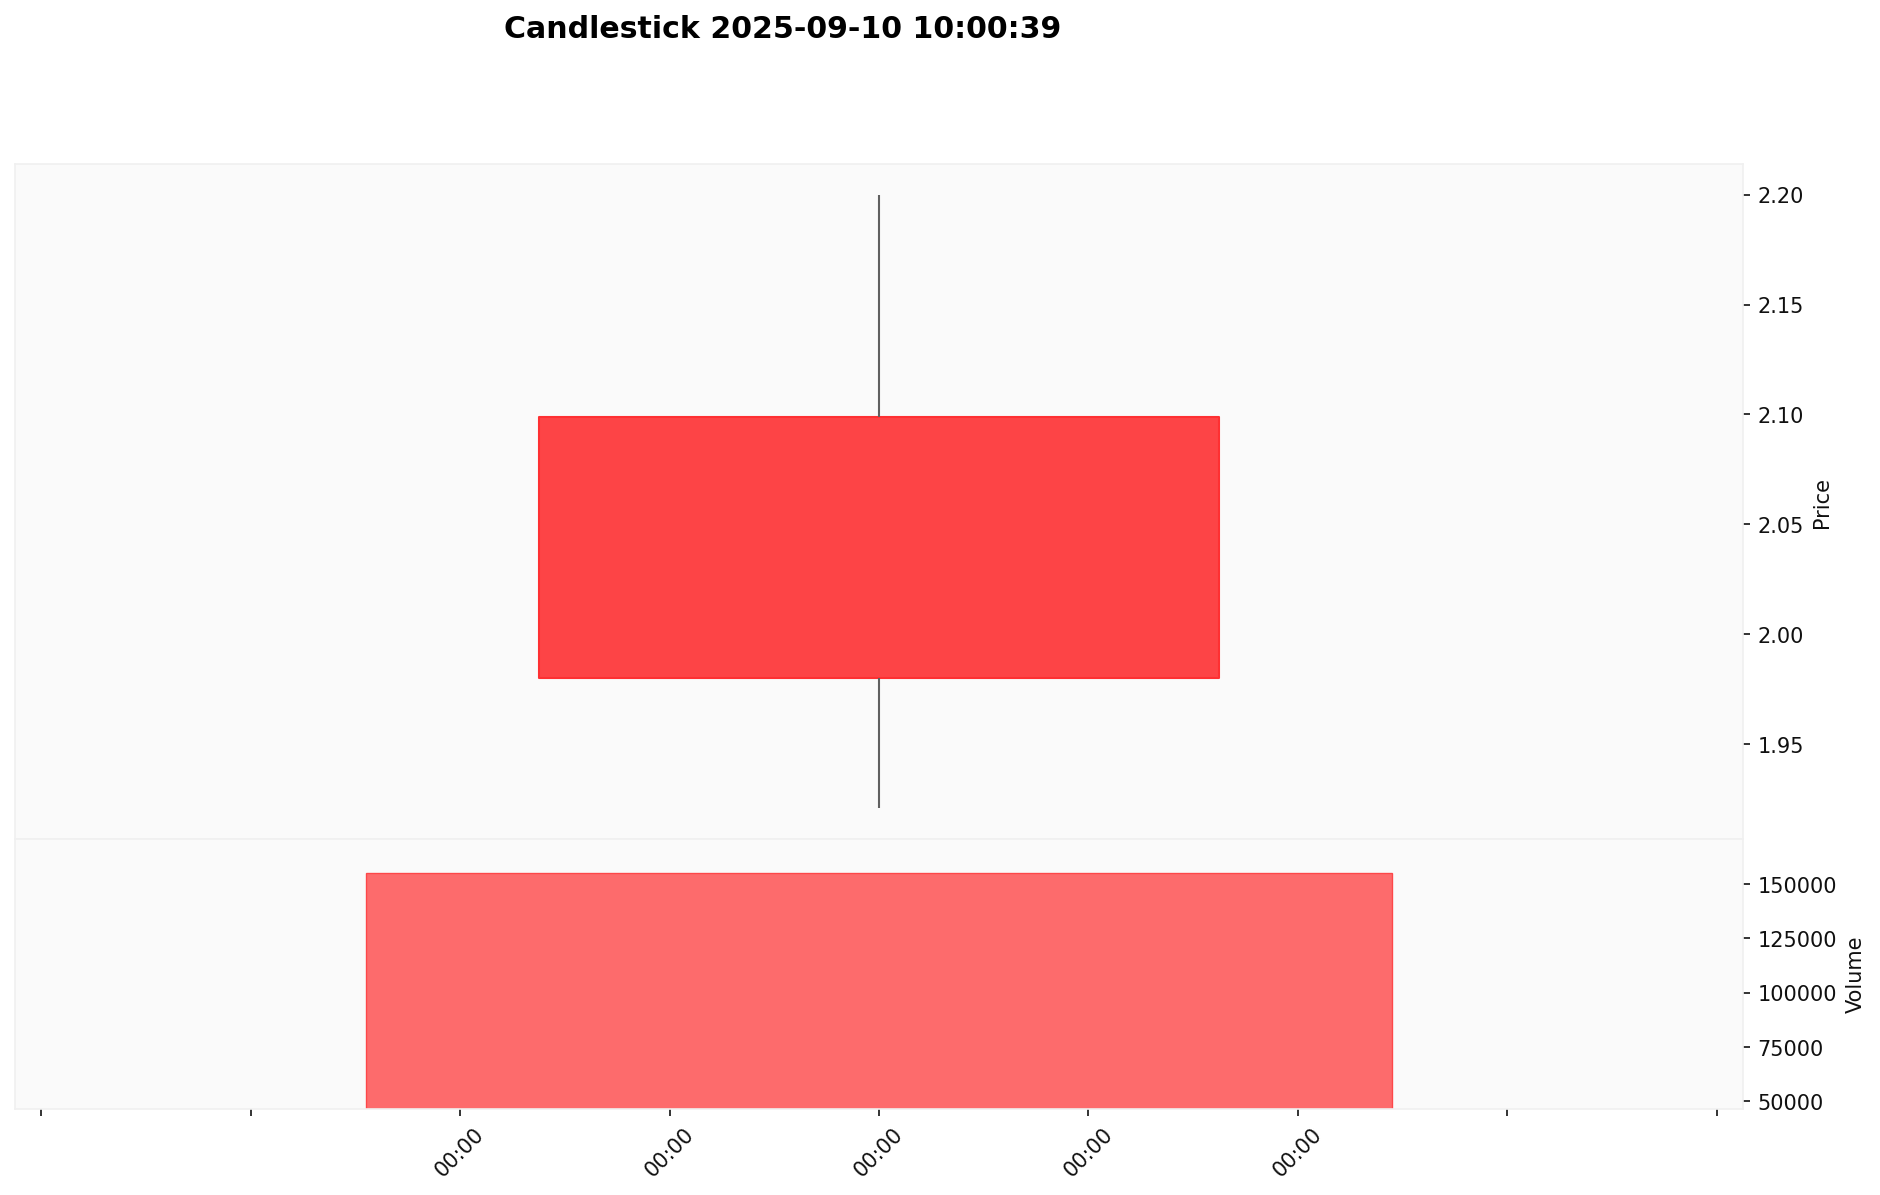
- 2025: MemeCore launched as the first Layer 1 blockchain for Meme 2.0, price surged to $2.2 (ATH)
- 2025: Market correction, price dropped to $1.9053 (ATL)
M Current Market Situation
As of September 10, 2025, MemeCore (M) is trading at $1.9749. The token has experienced significant volatility in recent periods. Over the past 24 hours, M has seen a 6.04% decrease in value. However, looking at longer timeframes, M has shown remarkable growth. In the past 7 days, it has surged by 129.30%, and over the last 30 days, it has skyrocketed by 331.20%. The yearly performance is even more impressive, with a staggering 2786.94% increase.
M's market capitalization currently stands at $3,312,452,798, ranking it 47th in the overall cryptocurrency market. The token has a circulating supply of 1,677,276,215 M, which represents 33.55% of its total supply of 5,000,000,000 M. The fully diluted valuation of MemeCore is $9,874,500,000.
Trading volume in the last 24 hours reached $481,501, indicating active market participation. The token's all-time high of $2.2 was achieved just yesterday, on September 9, 2025, while its all-time low of $1.9053 was recorded earlier today.
Click to view the current M market price
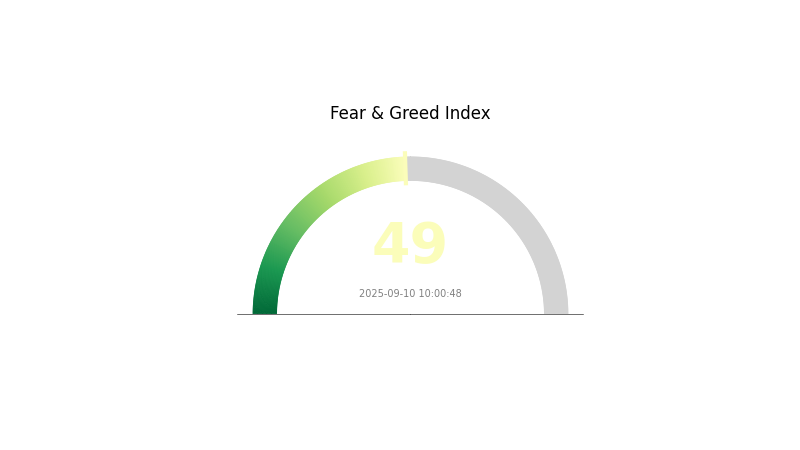
Market Sentiment Indicator
2025-09-10 Fear and Greed Index: 49 (Neutral)
Click to view the current Fear & Greed Index
The cryptocurrency market sentiment remains balanced today, with the Fear and Greed Index at 49, indicating a neutral stance. This suggests that investors are neither overly fearful nor excessively greedy. Such equilibrium often presents opportunities for calculated moves. Traders may consider this a time to reassess their strategies, conduct thorough research, and prepare for potential market shifts. While the current sentiment is stable, it's crucial to stay informed and vigilant, as market conditions can change rapidly in the crypto space.
M Holdings Distribution
The address holdings distribution chart provides insights into the concentration of M tokens across different wallet addresses. Based on the provided data, we observe an unusual situation where no specific address holdings are listed. This could indicate either a highly decentralized distribution or a lack of available data.
In the absence of concentration data, it's challenging to assess the level of centralization or decentralization of M token holdings. Typically, a well-distributed token would show a range of addresses with varying percentages of the total supply. The current lack of information makes it difficult to evaluate potential market impacts or vulnerabilities to price manipulation.
This unusual data scenario underscores the importance of transparent blockchain data for market analysis. It highlights the need for further investigation into M's on-chain structure and distribution mechanisms to better understand its market dynamics and stability.
Click to view the current M Holdings Distribution

| Top | Address | Holding Qty | Holding (%) |
|---|
II. Key Factors Affecting M's Future Price
Supply Mechanism
- Maximum Supply: The maximum supply of MemeCore (M) is capped at 10,000,000,000 tokens.
- Current Impact: With a circulating supply of 1,039,501,066 tokens out of a total supply of 5,264,317,858.42, the controlled release of tokens may help maintain price stability and potentially drive future value.
Institutional and Whale Dynamics
- Enterprise Adoption: MemeCore's focus on meme culture capitalization may attract businesses looking to leverage cultural assets in the digital space.
Macroeconomic Environment
- Inflation Hedging Properties: As a cryptocurrency, M may be viewed as a potential hedge against inflation, similar to other digital assets.
Technological Development and Ecosystem Building
- PoM Consensus Mechanism: The implementation of the Proof of Meme (PoM) consensus mechanism could drive technological adoption and ecosystem growth.
- Ecosystem Applications: MemeCore is developing a platform for meme-based cultural assets, potentially including DApps and ecosystem projects centered around meme culture and its capitalization.
III. M Price Prediction for 2025-2030
2025 Outlook
- Conservative prediction: $1.29 - $1.60
- Neutral prediction: $1.60 - $1.95
- Optimistic prediction: $1.95 - $2.17 (requires positive market sentiment and increased adoption)
2027-2028 Outlook
- Market phase expectation: Potential growth phase with increased volatility
- Price range forecast:
- 2027: $2.02 - $3.60
- 2028: $1.62 - $3.25
- Key catalysts: Technological advancements, wider institutional adoption, and favorable regulatory developments
2030 Long-term Outlook
- Base scenario: $3.00 - $3.58 (assuming steady market growth and adoption)
- Optimistic scenario: $3.58 - $4.51 (assuming strong market performance and widespread integration)
- Transformative scenario: $4.51+ (extreme favorable conditions such as major institutional backing and breakthrough use cases)
- 2030-12-31: M $3.582 (potential year-end average price)
| 年份 | 预测最高价 | 预测平均价格 | 预测最低价 | 涨跌幅 |
|---|---|---|---|---|
| 2025 | 2.17271 | 1.9574 | 1.29188 | 0 |
| 2026 | 2.76718 | 2.06506 | 1.28034 | 4 |
| 2027 | 3.60001 | 2.41612 | 2.02954 | 22 |
| 2028 | 3.24871 | 3.00807 | 1.62436 | 52 |
| 2029 | 4.03562 | 3.12839 | 2.59656 | 58 |
| 2030 | 4.51333 | 3.582 | 2.36412 | 81 |
IV. Professional Investment Strategies and Risk Management for M
M Investment Methodology
(1) Long-term Holding Strategy
- Suitable for: Value investors and believers in the Meme 2.0 paradigm
- Operational suggestions:
- Accumulate M tokens during market dips
- Participate in MemeCore ecosystem activities to earn rewards
- Store tokens in secure, non-custodial wallets
(2) Active Trading Strategy
- Technical analysis tools:
- Moving Averages: Use to identify trends and potential reversal points
- RSI (Relative Strength Index): Monitor overbought/oversold conditions
- Key points for swing trading:
- Monitor social media trends and community engagement metrics
- Set stop-loss orders to manage downside risk
M Risk Management Framework
(1) Asset Allocation Principles
- Conservative investors: 1-3% of crypto portfolio
- Aggressive investors: 5-10% of crypto portfolio
- Professional investors: Up to 15% of crypto portfolio
(2) Risk Hedging Solutions
- Diversification: Balance M holdings with other crypto assets
- Stop-loss orders: Implement to limit potential losses
(3) Secure Storage Solutions
- Hot wallet recommendation: Gate Web3 Wallet
- Cold storage solution: Hardware wallets for large holdings
- Security precautions: Enable two-factor authentication, use unique passwords
V. Potential Risks and Challenges for M
M Market Risks
- High volatility: Meme coins are subject to rapid price swings
- Speculative nature: Market sentiment can change quickly
- Competition: Other meme coins may dilute market share
M Regulatory Risks
- Uncertain regulatory environment: Potential for stricter regulations on meme coins
- Cross-border restrictions: Varying legal status in different jurisdictions
- Tax implications: Evolving tax laws may impact investments
M Technical Risks
- Smart contract vulnerabilities: Potential for exploits or bugs
- Scalability challenges: High transaction volumes may stress the network
- Ecosystem development: Dependence on continuous innovation and adoption
VI. Conclusion and Action Recommendations
M Investment Value Assessment
MemeCore (M) presents a unique value proposition in the evolving Meme 2.0 landscape, offering potential long-term growth through its innovative viral economy model. However, short-term volatility and regulatory uncertainties pose significant risks.
M Investment Recommendations
✅ Newcomers: Start with small, affordable investments to understand the ecosystem ✅ Experienced investors: Consider a balanced approach, allocating based on risk tolerance ✅ Institutional investors: Conduct thorough due diligence and consider M as part of a diversified crypto portfolio
M Trading Participation Methods
- Spot trading: Buy and hold M tokens on Gate.com
- Futures trading: Engage in leveraged trading with caution on Gate.com
- Ecosystem participation: Contribute to the MemeCore network to earn rewards
Cryptocurrency investments carry extremely high risks, and this article does not constitute investment advice. Investors should make decisions carefully based on their own risk tolerance and are advised to consult professional financial advisors. Never invest more than you can afford to lose.
FAQ
What is the forecast for M stock?
Analysts predict M stock to reach $13.5 on average, with a range of $6.06 to $24.27 within a year.
What is the 12 month forecast for Moderna stock?
Based on analyst ratings, Moderna's 12-month average price target is $46.00, with an upside potential of 85.26%.
Why did Macy's stock just surge 20%?
Macy's stock surged due to an improved outlook and positive earnings report, exceeding market expectations.
How much is Meta worth in 2025?
Meta's worth is $1.89 trillion as of September 2025, reflecting its market capitalization.
Share
Content