Trade
Basic
Futures
Futures
Hundreds of contracts settled in USDT or BTC
TradFi
Gold
Trade global traditional assets with USDT in one place
Options
Hot
Trade European-style vanilla options
Unified Account
Maximize your capital efficiency
Demo Trading
Futures Kickoff
Get prepared for your futures trading
Futures Events
Participate in events to win generous rewards
Demo Trading
Use virtual funds to experience risk-free trading
Earn
Launch
CandyDrop
Collect candies to earn airdrops
Launchpool
Quick staking, earn potential new tokens
HODLer Airdrop
Hold GT and get massive airdrops for free
Launchpad
Be early to the next big token project
Alpha Points
Trade on-chain assets and enjoy airdrop rewards!
Futures Points
Earn futures points and claim airdrop rewards
Investment
Simple Earn
Earn interests with idle tokens
Auto-Invest
Auto-invest on a regular basis
Dual Investment
Buy low and sell high to take profits from price fluctuations
Soft Staking
Earn rewards with flexible staking
Crypto Loan
0 Fees
Pledge one crypto to borrow another
Lending Center
One-stop lending hub
VIP Wealth Hub
Customized wealth management empowers your assets growth
Private Wealth Management
Customized asset management to grow your digital assets
Quant Fund
Top asset management team helps you profit without hassle
Staking
Stake cryptos to earn in PoS products
Smart Leverage
New
No forced liquidation before maturity, worry-free leveraged gains
GUSD Minting
Use USDT/USDC to mint GUSD for treasury-level yields
More
NaveedContrarian
Contrarian by Mindset | Crypto Analyst & Researcher | Insights | Investor
Pin
NaveedContrarian
So guyz, are you ready?

- Reward
- 2
- Comment
- Repost
- Share
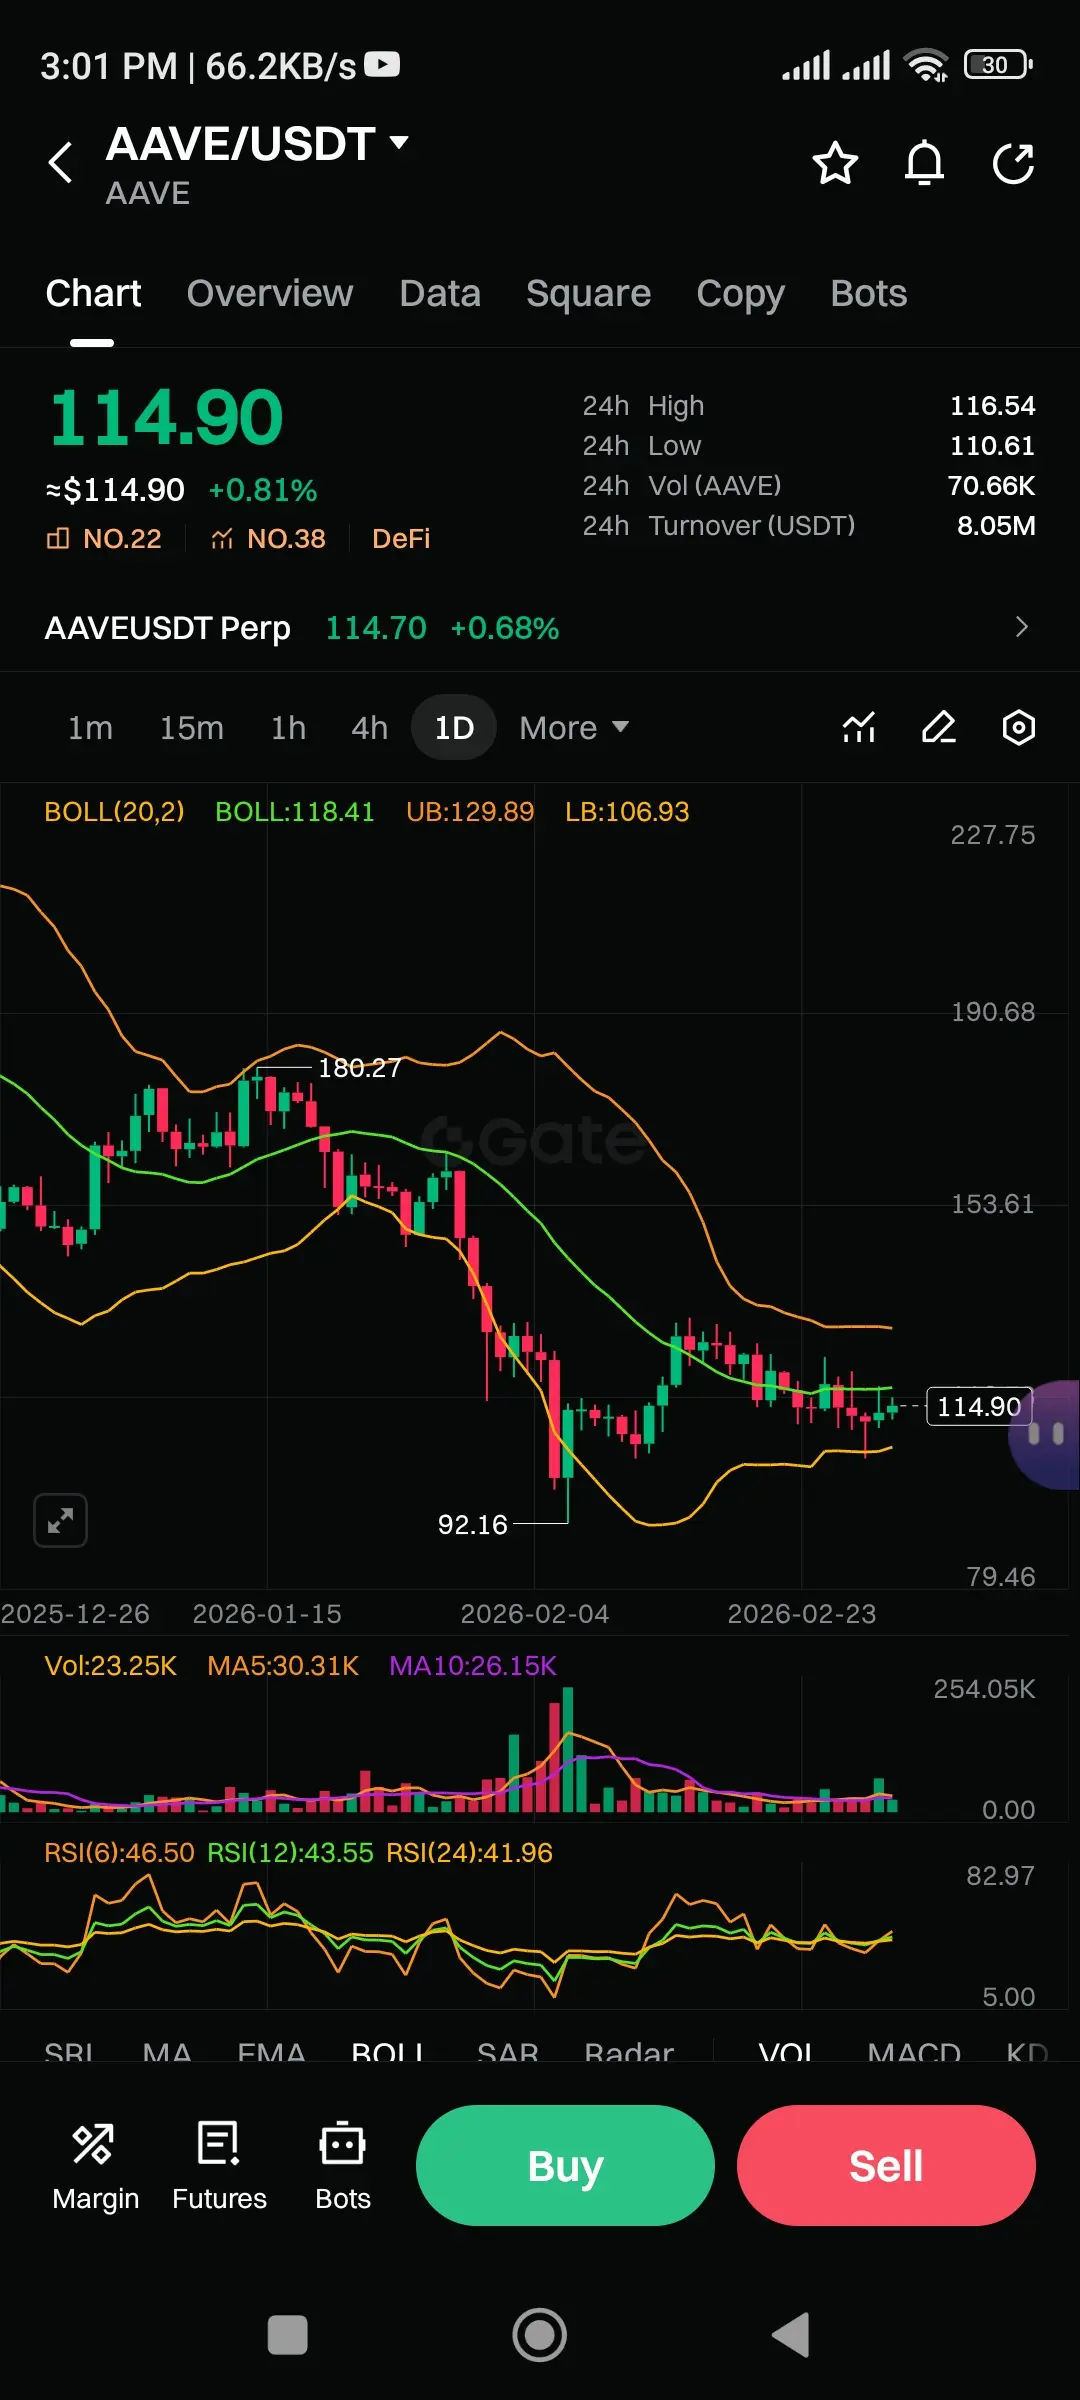
$AAVE /USDT 1D Chart Analysis 🔥
$AAVE is holding at $114.90 (+0.81%), attempting a meaningful recovery after bottoming at $92.16 a level that shook out weak hands beautifully.
📊 Technical Breakdown:
BOLL(20,2): Price is reclaiming toward Middle Band ($118.41). A daily close above this flips momentum bullish, targeting Upper Band ($129.89).
RSI(6/12/24) 46.50 | 43.55 | 41.96: All three timeframes recovering simultaneously from deeply oversold conditions a historically powerful reversal signal.
Volume: MA5 crossing above MA10 on volume confirms quiet accumulation building beneath the surface
AAVE3.11%
- Reward
- 3
- Comment
- Repost
- Share
⚡️ People are talking about WW3 more than ever in crypto spaces!
According to Santiment, chatter about World War 3 on crypto social media has reached its highest point since June 2025 as tensions between the US, Israel, and Iran keep rising.
When fear spikes, markets move. 👀 Stay alert and trade carefully! 🚨$BTC
#IranTensionsEscalate #PreciousMetalsAndOilPricesSurge #BuyTheDipOrWaitNow? #CryptoSurvivalGuide #iranisraelconflict
BTC0.4%

- Reward
- 2
- Comment
- Repost
- Share
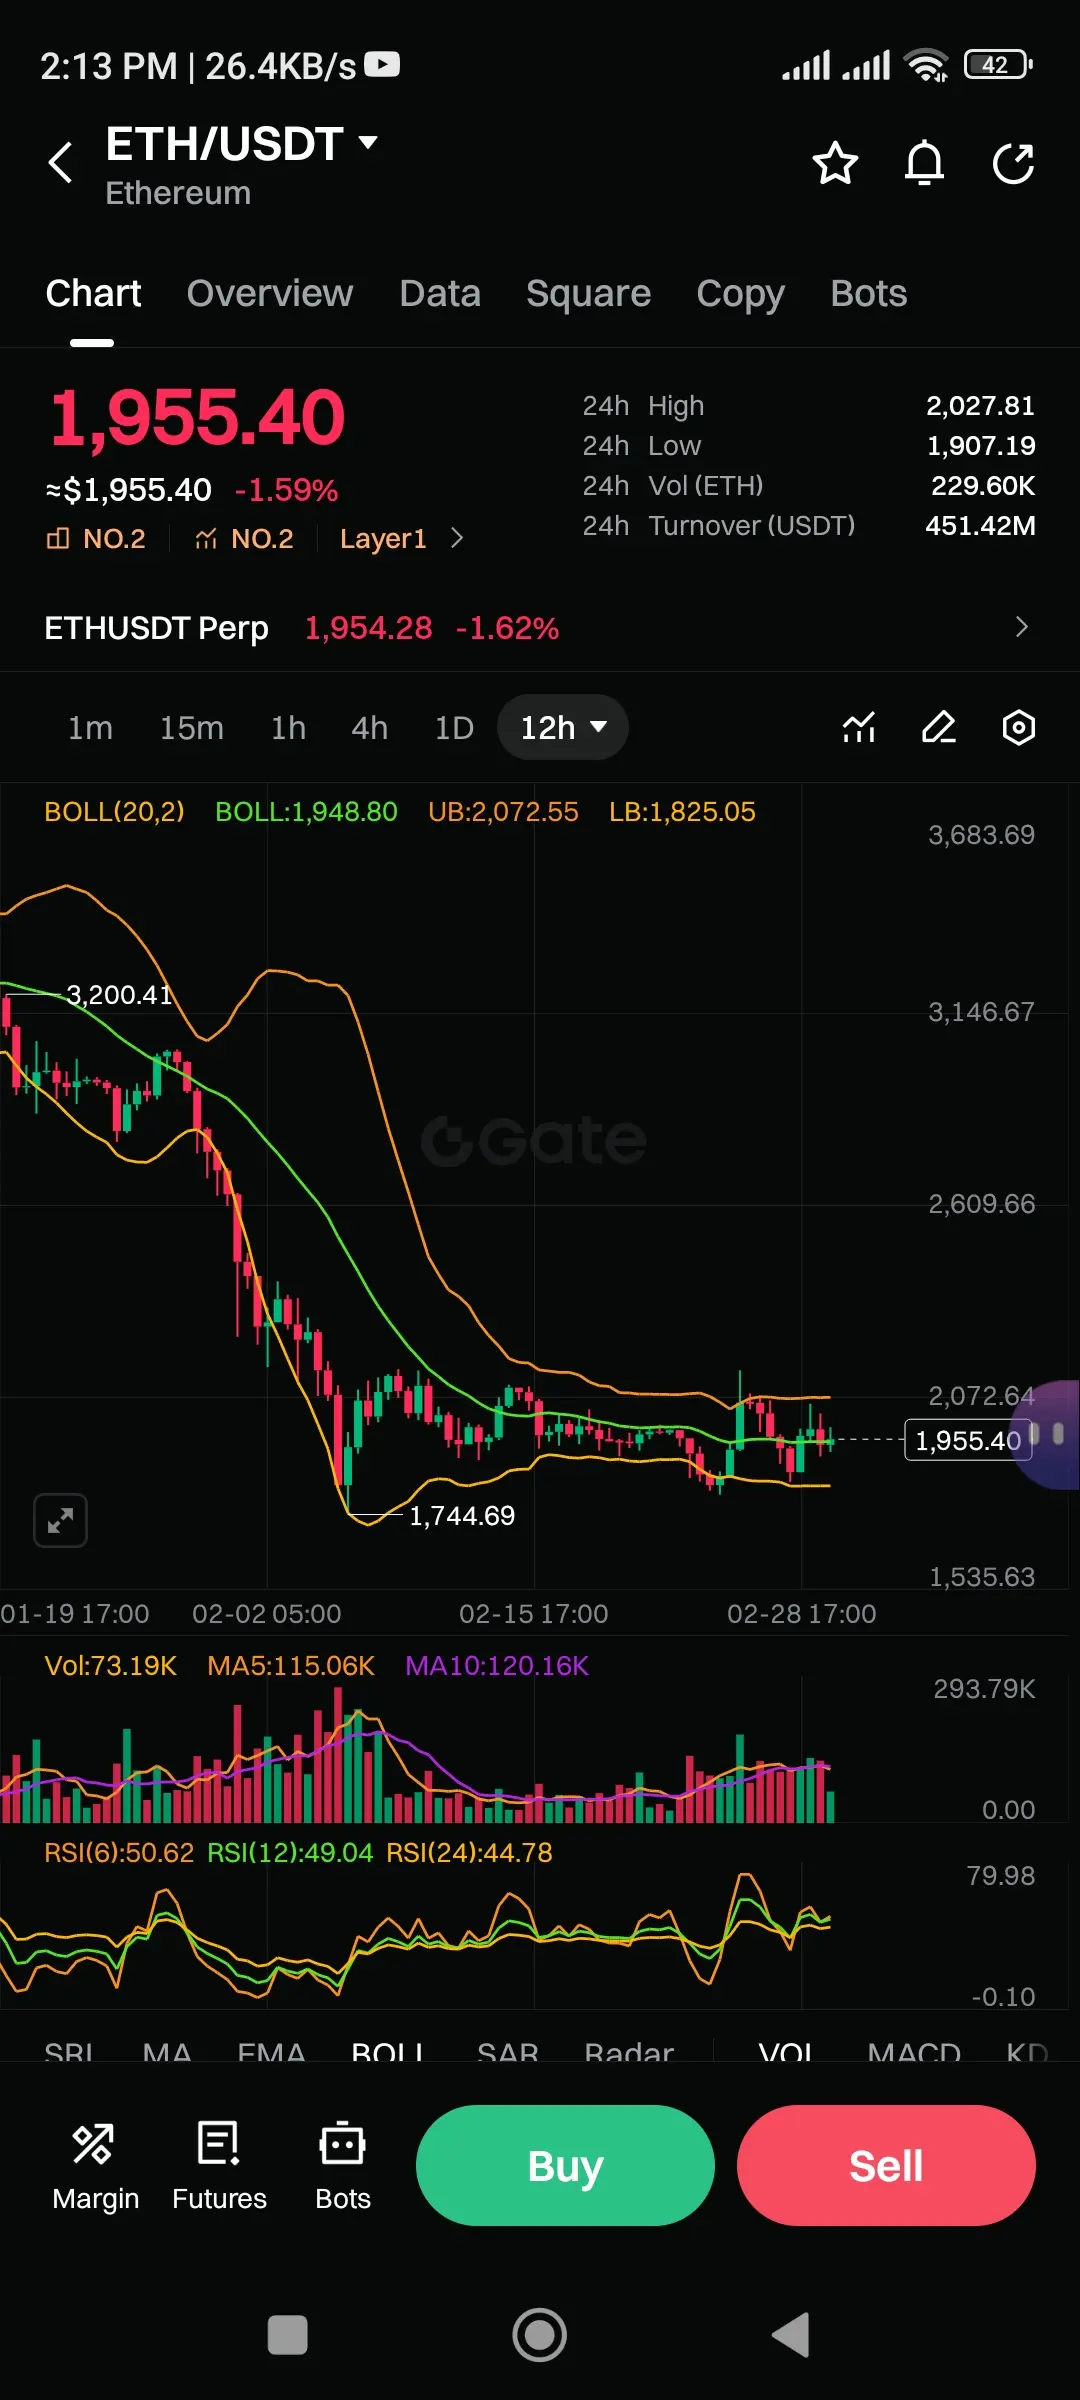
$ETH /USDT 12H Technical Analysis
$ETH is whispering something the charts rarely show pay attention! 👇
Price stabilizing at $1,955 after bouncing sharply from the $1,744 bottom. Bollinger Bands confirm the narrative price is reclaiming the Middle Band ($1,948), with the Upper Band at $2,072 acting as the next magnet 🎯
RSI(6) at 50.62, RSI(12) at 49.04, RSI(24) at 44.78 all three aligning and curling upward simultaneously. This multi-RSI convergence near neutral zone signals bears losing grip 🐻❌
Volume MA5 vs MA10 compression suggests accumulation is quietly happening beneath the surface.
ETH-0.92%
- Reward
- 3
- Comment
- Repost
- Share
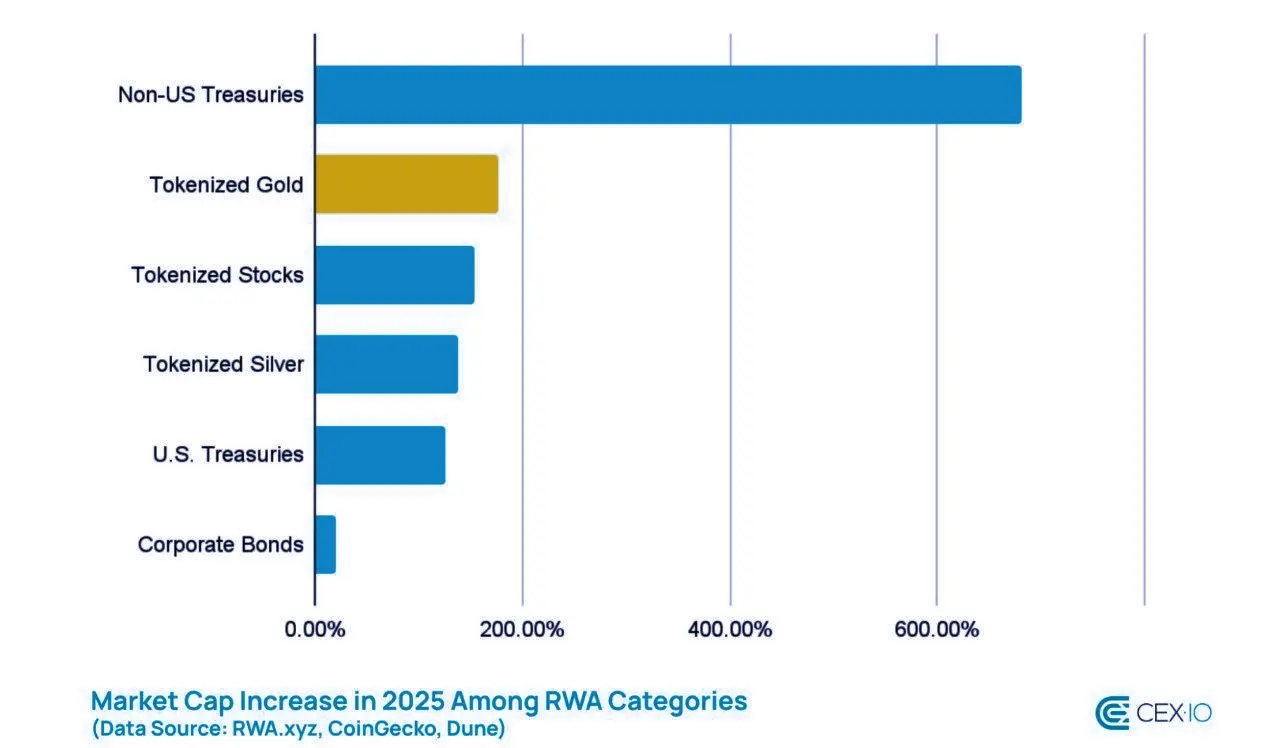
🚨 Big News for Gold Lovers!
Did you know that tokenized gold like $PAXG and XAUt are now setting the gold price every weekend when traditional markets like CME are closed? 🥇
That means crypto is literally deciding what gold is worth during off-hours!
And the numbers speak for themselves the total market cap of tokenized gold has jumped to a massive $4.4 Billion!📈
Real-world assets are moving on-chain, and gold is leading the way. Are you holding any tokenized gold?
#GOLD #PAXG #BuyTheDipOrWaitNow? #CME #RWA
PAXG-0.96%

- Reward
- 2
- 2
- Repost
- Share
repanzal :
:
thanks for sharing the best informationView More
🚨 Let's evaluate the $SYRUP /USDT 12H chart. After bottoming near $0.1939, SYRUP is confirming a strong bullish reversal, currently up over 10% at $0.2412. This price surge is fueled by a technical bounce from oversold levels, supported by a distinct influx of buying volume.
The indicators are decidedly bullish. We've seen a confident breakout above the Bollinger Band mid-line ($0.2250), signaling a definitive shift in momentum. Additionally, the RSI(6) is climbing healthily at 61.16 showing gathering strength with plenty of room before hitting overbought territory.
These converging signals p
SYRUP-1.84%
- Reward
- 3
- Comment
- Repost
- Share
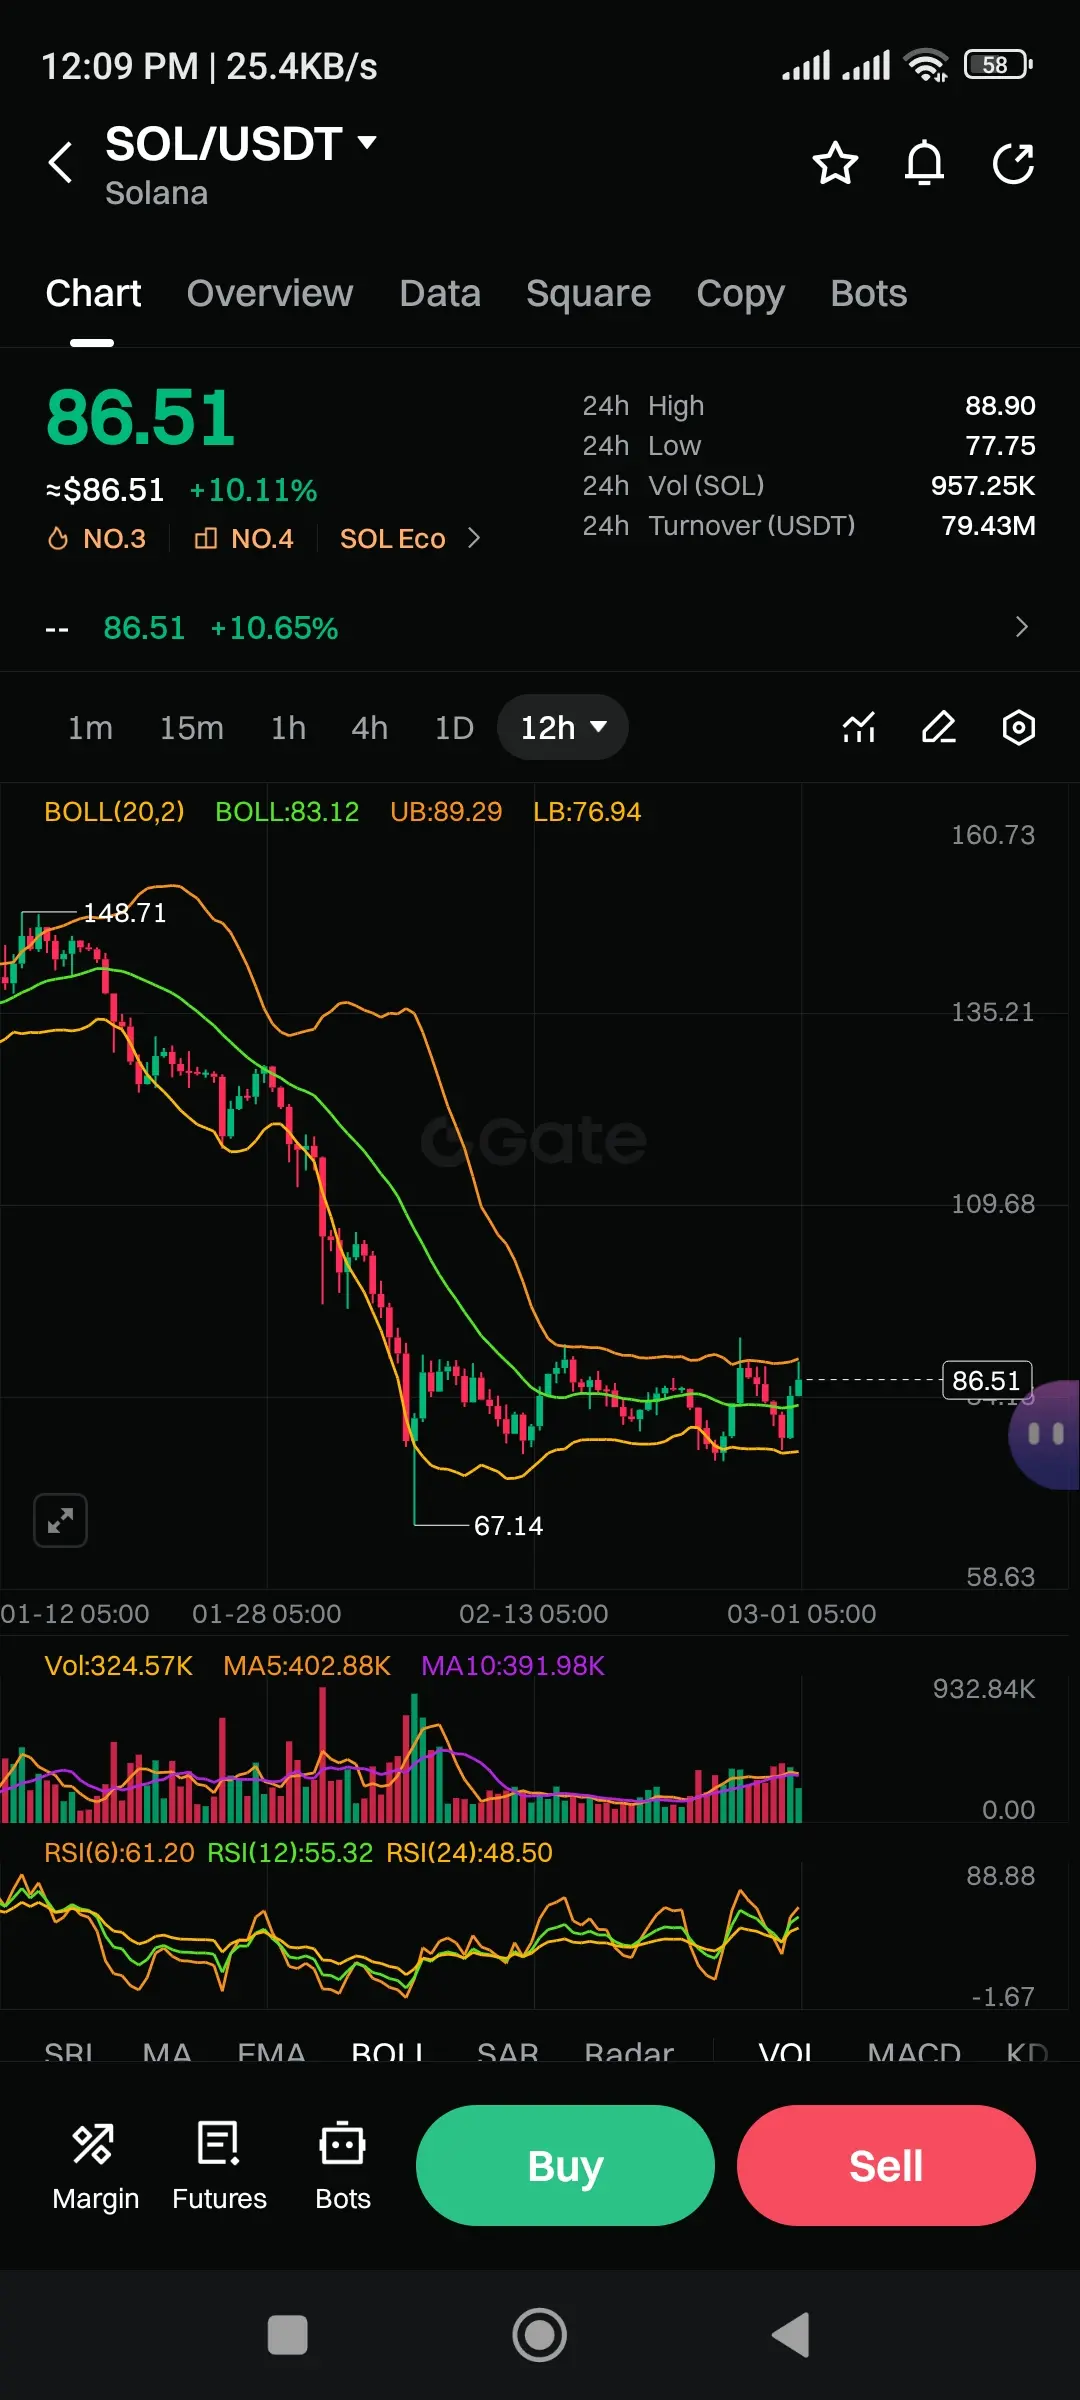
🚨$SOL /USDT 12H ANALYSIS#
From $148.71 peak to a crushing low of $67.14 Solana tested everyone's patience. But the chart is now telling a different story! 👀
📊 Technical Breakdown:
Price is reclaiming BOLL Mid-Band ($83.12) and pressing toward Upper Band $89.29. RSI(6) at 61.20 confirms building momentum, while RSI(24) at 48.50 shows the longer-term trend is just waking up plenty of room to run!
📉 Drop Reason? Sustained distribution pressure with volume confirming sellers in control for weeks.
📈 Recovery Reason? Buyers absorbed the $67 demand zone aggressively classic accumulation pattern
SOL0.01%
- Reward
- 2
- Comment
- Repost
- Share
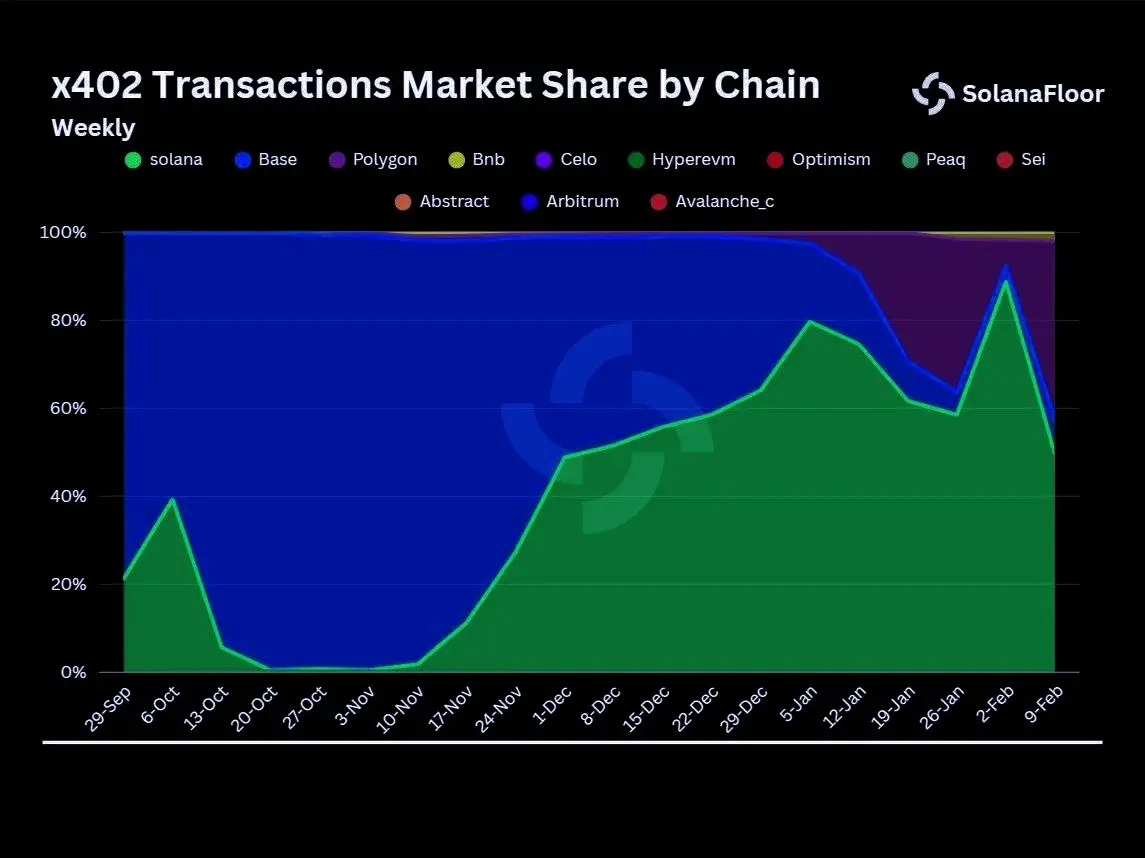
🚨 HUGE NEWS for $SOL holders!
Solana now controls 49% of ALL Agent-to-Agent payments 🤖➡️🤖
Nearly HALF of AI agents paying each other are using SOL!
The future of AI payments is being built on Solana. Are you paying attention? 👀
#solana #USIsraelStrikesIranBTCPlunges #TrumpordersfederalbanonAnthropicAI #solnews #BuyTheDipOrWaitNow?
SOL0.01%

- Reward
- 4
- Comment
- Repost
- Share
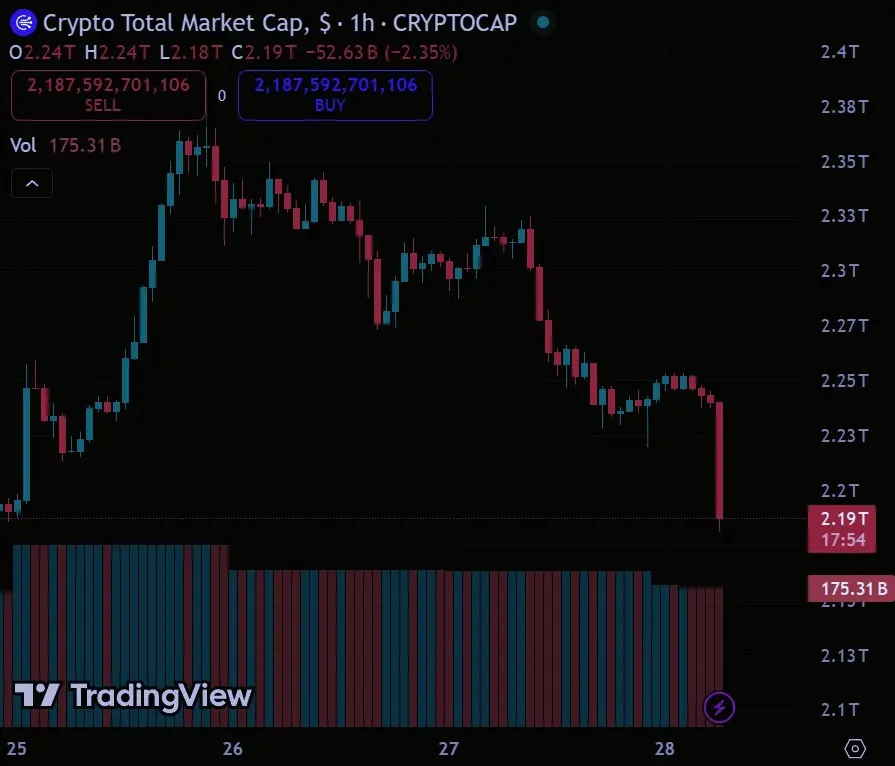
📊 WHOA! $50,000,000,000 wiped out from the crypto market in just 60 minutes! 🔴 Is this a dip to buy or a sign of more pain ahead? Drop your thoughts below! 👇
$BTC
#IsraelStrikesIranBTCPlunges #TrumpordersfederalbanonAnthropicAI #95%ofAltsBelow200-daySMA #BuyTheDipOrWaitNow? #liquidations
$BTC
#IsraelStrikesIranBTCPlunges #TrumpordersfederalbanonAnthropicAI #95%ofAltsBelow200-daySMA #BuyTheDipOrWaitNow? #liquidations
BTC0.4%

- Reward
- 2
- Comment
- Repost
- Share
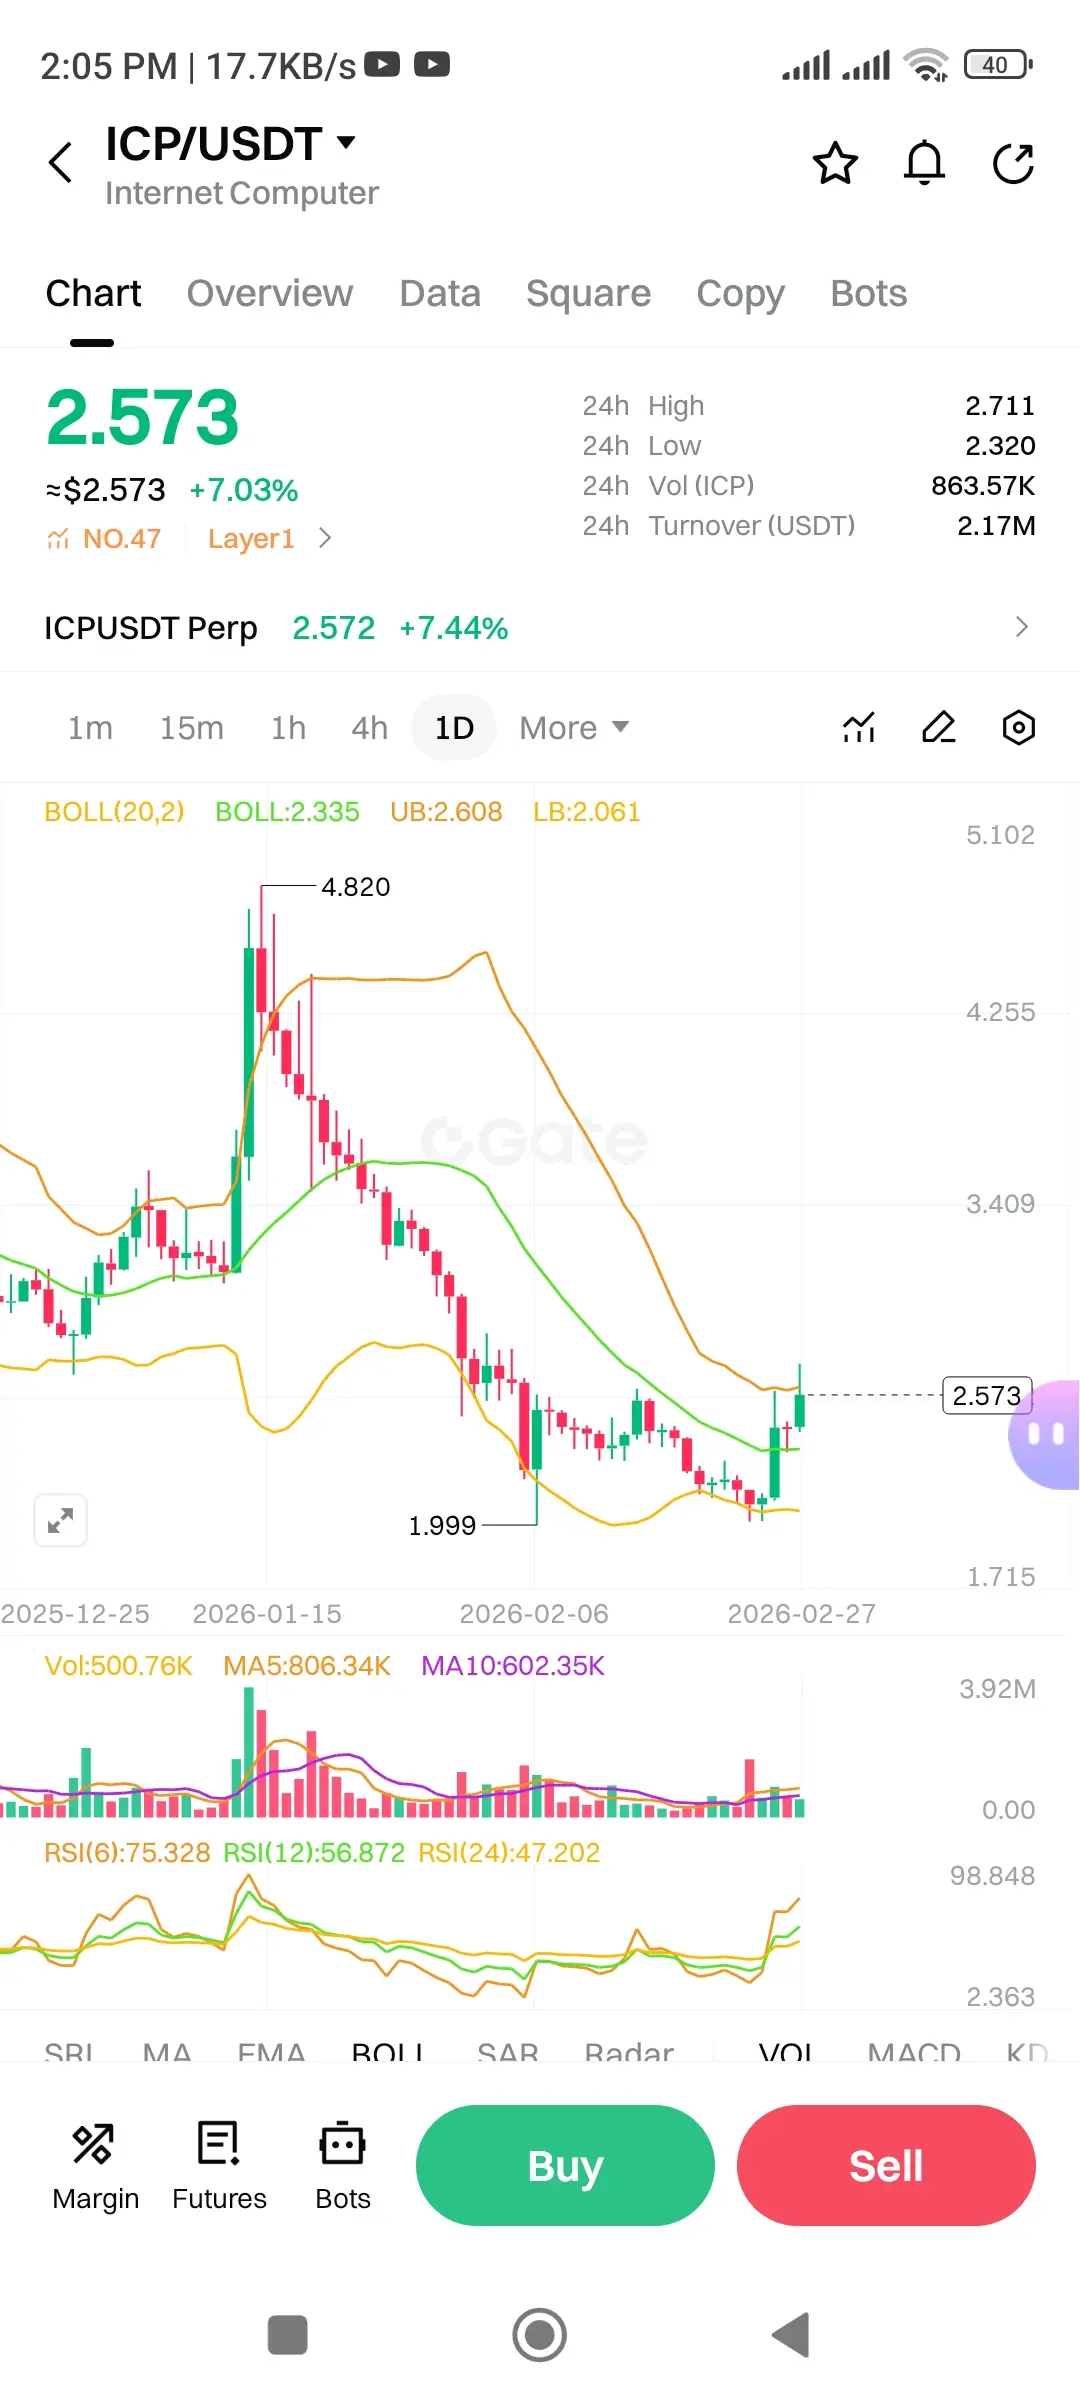
$ICP /USDT Technical Analysis | 1D Chart
Price: $2.573 | +7.03% 📈
After a brutal sell-off from $4.820, ICP finally found its footing near the $1.999 support zone where patient hands were clearly waiting.
📊 Indicators Breakdown:
🔵 BOLL(20,2): Price is now breaking above the Middle Band (2.335) and challenging the Upper Band at 2.608 a textbook bullish band expansion signal.
🟡 RSI(6): 75.328 | RSI(12): 56.872 | RSI(24): 47.202 Short-term momentum is blazing while mid & long-term RSI still has plenty of room to run no divergence yet!
📦 Volume: MA5 volume surpassing MA10 confirms fresh buying
ICP1.11%
- Reward
- 2
- Comment
- Repost
- Share
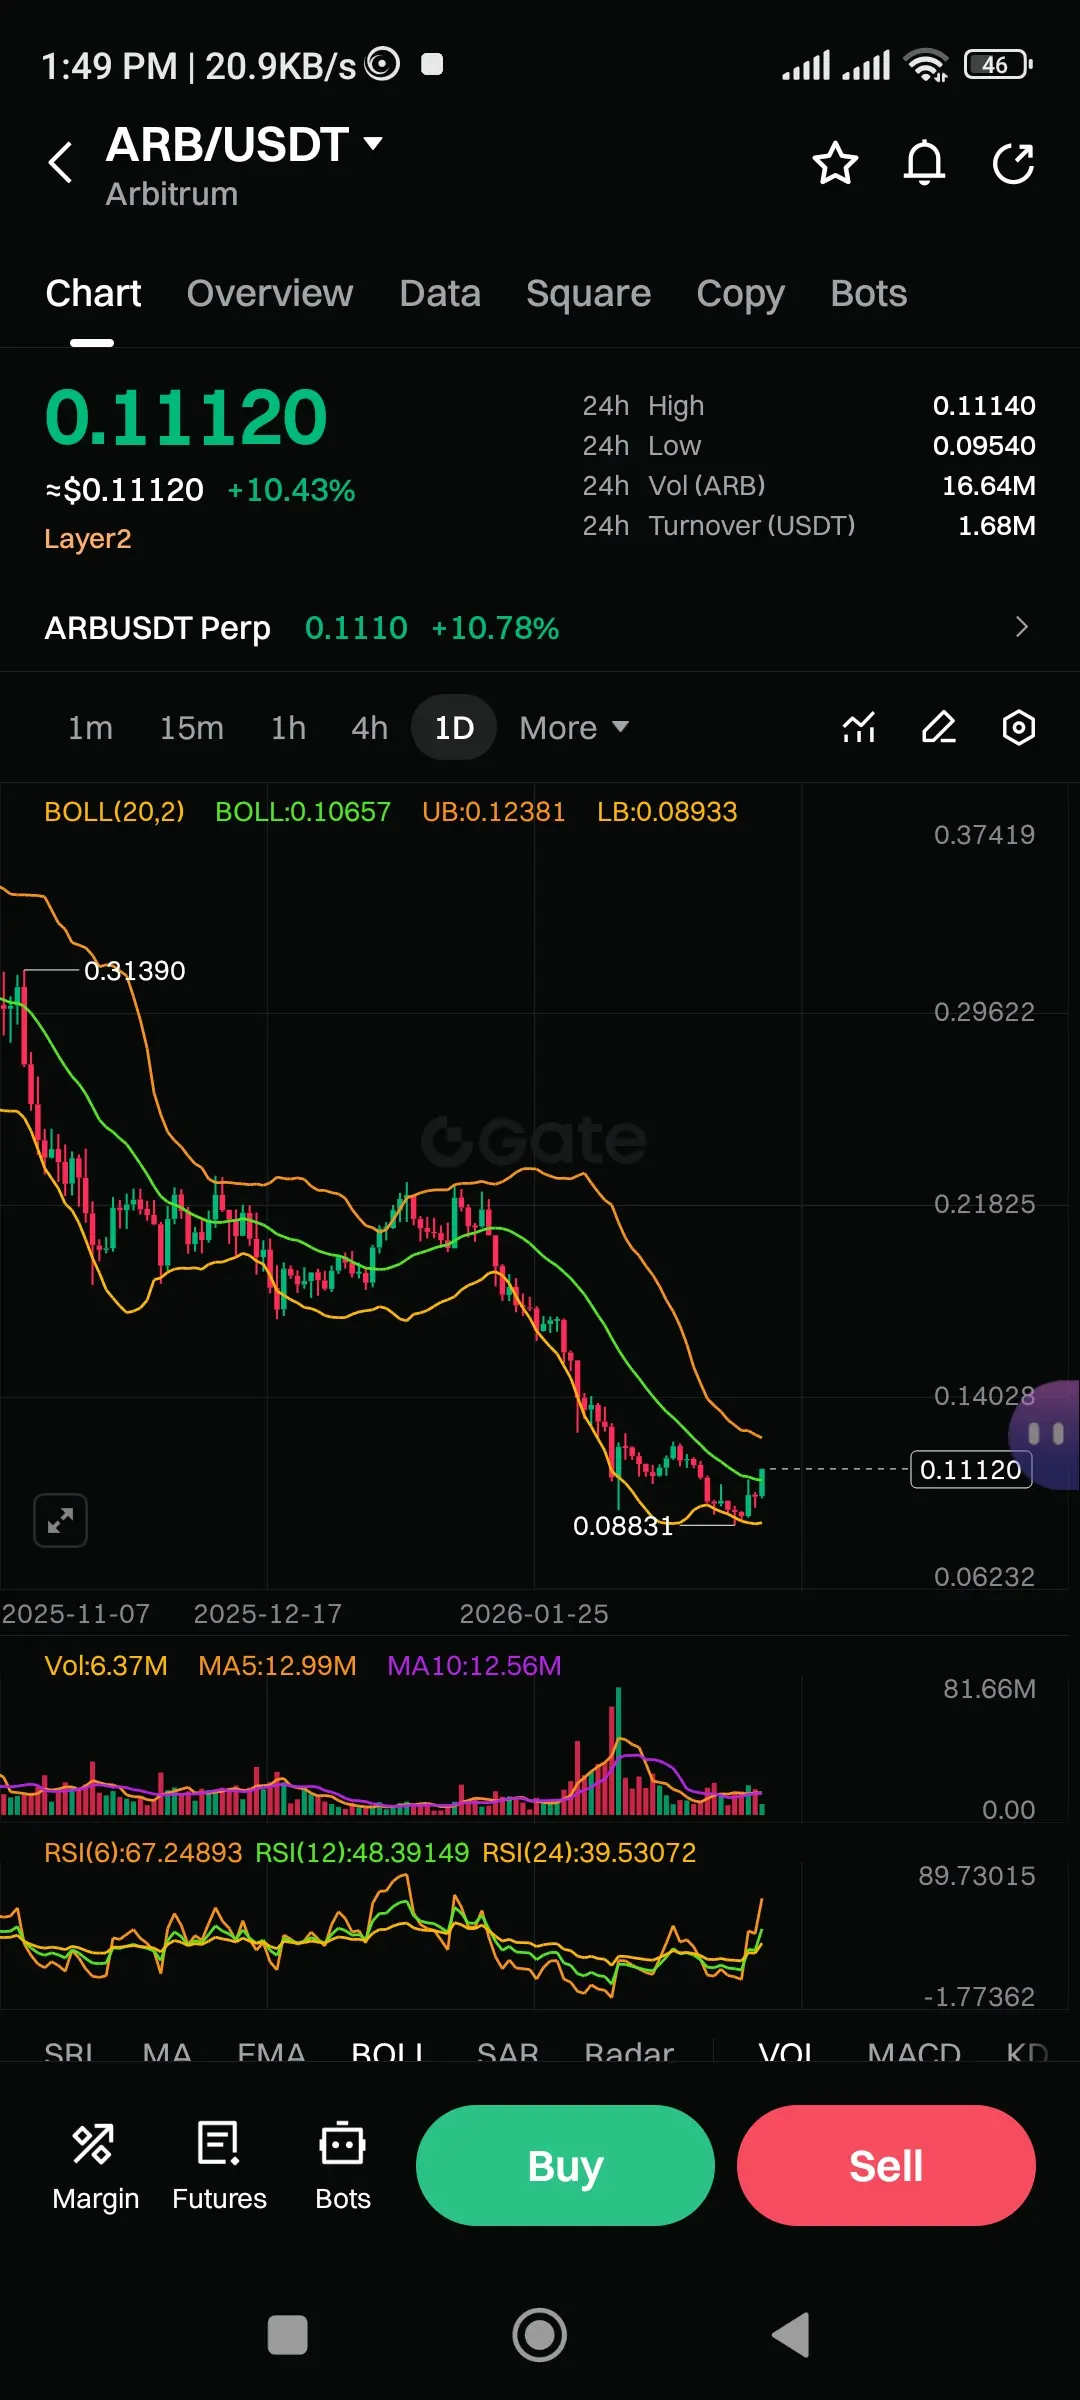
$ARB ARB/USDT Daily Chart Analysis | Reversal Loading?
Current Price: $0.11120 | +10.43% 📈
ARB has been bleeding from $0.31390 for months
but the tide may finally be turning. Price recently carved a low at $0.08831, hovering near the Bollinger Lower Band (LB: 0.08933) a textbook capitulation zone where panic sellers exhaust themselves.
📊 RSI(6) surging at 67.24 while RSI(24) sits at 39.53 this divergence signals early-stage momentum shift with room to run before overbought territory.
📉 BOLL Middle Band at $0.10657 is being reclaimed, with Upper Band at $0.12381 as the next key target.
ARB4.31%
- Reward
- 1
- Comment
- Repost
- Share
$ACX /USDT 1D Chart Analysis
Current Price: $0.03488 | +4.78% 📈
ACX has endured a brutal journey from $0.08053, shedding nearly 86% over the year but historically, maximum pain zones birth maximum opportunity for patient accumulation. 🎯
📊 Indicators Breakdown:
- BOLL(20,2): Price hugging Lower Band (0.03251) — squeeze forming, breakout toward MB (0.03598) likely next
- RSI(6): 49.28 | RSI(12): 41.51 | RSI(24): 39.18 multi-timeframe RSI curling upward from deep oversold bullish divergence forming
- Volume: Declining sell volume signals seller exhaustion at 0.03167 support
📉 Why it fell? P
ACX-0.17%
- Reward
- 1
- Comment
- Repost
- Share
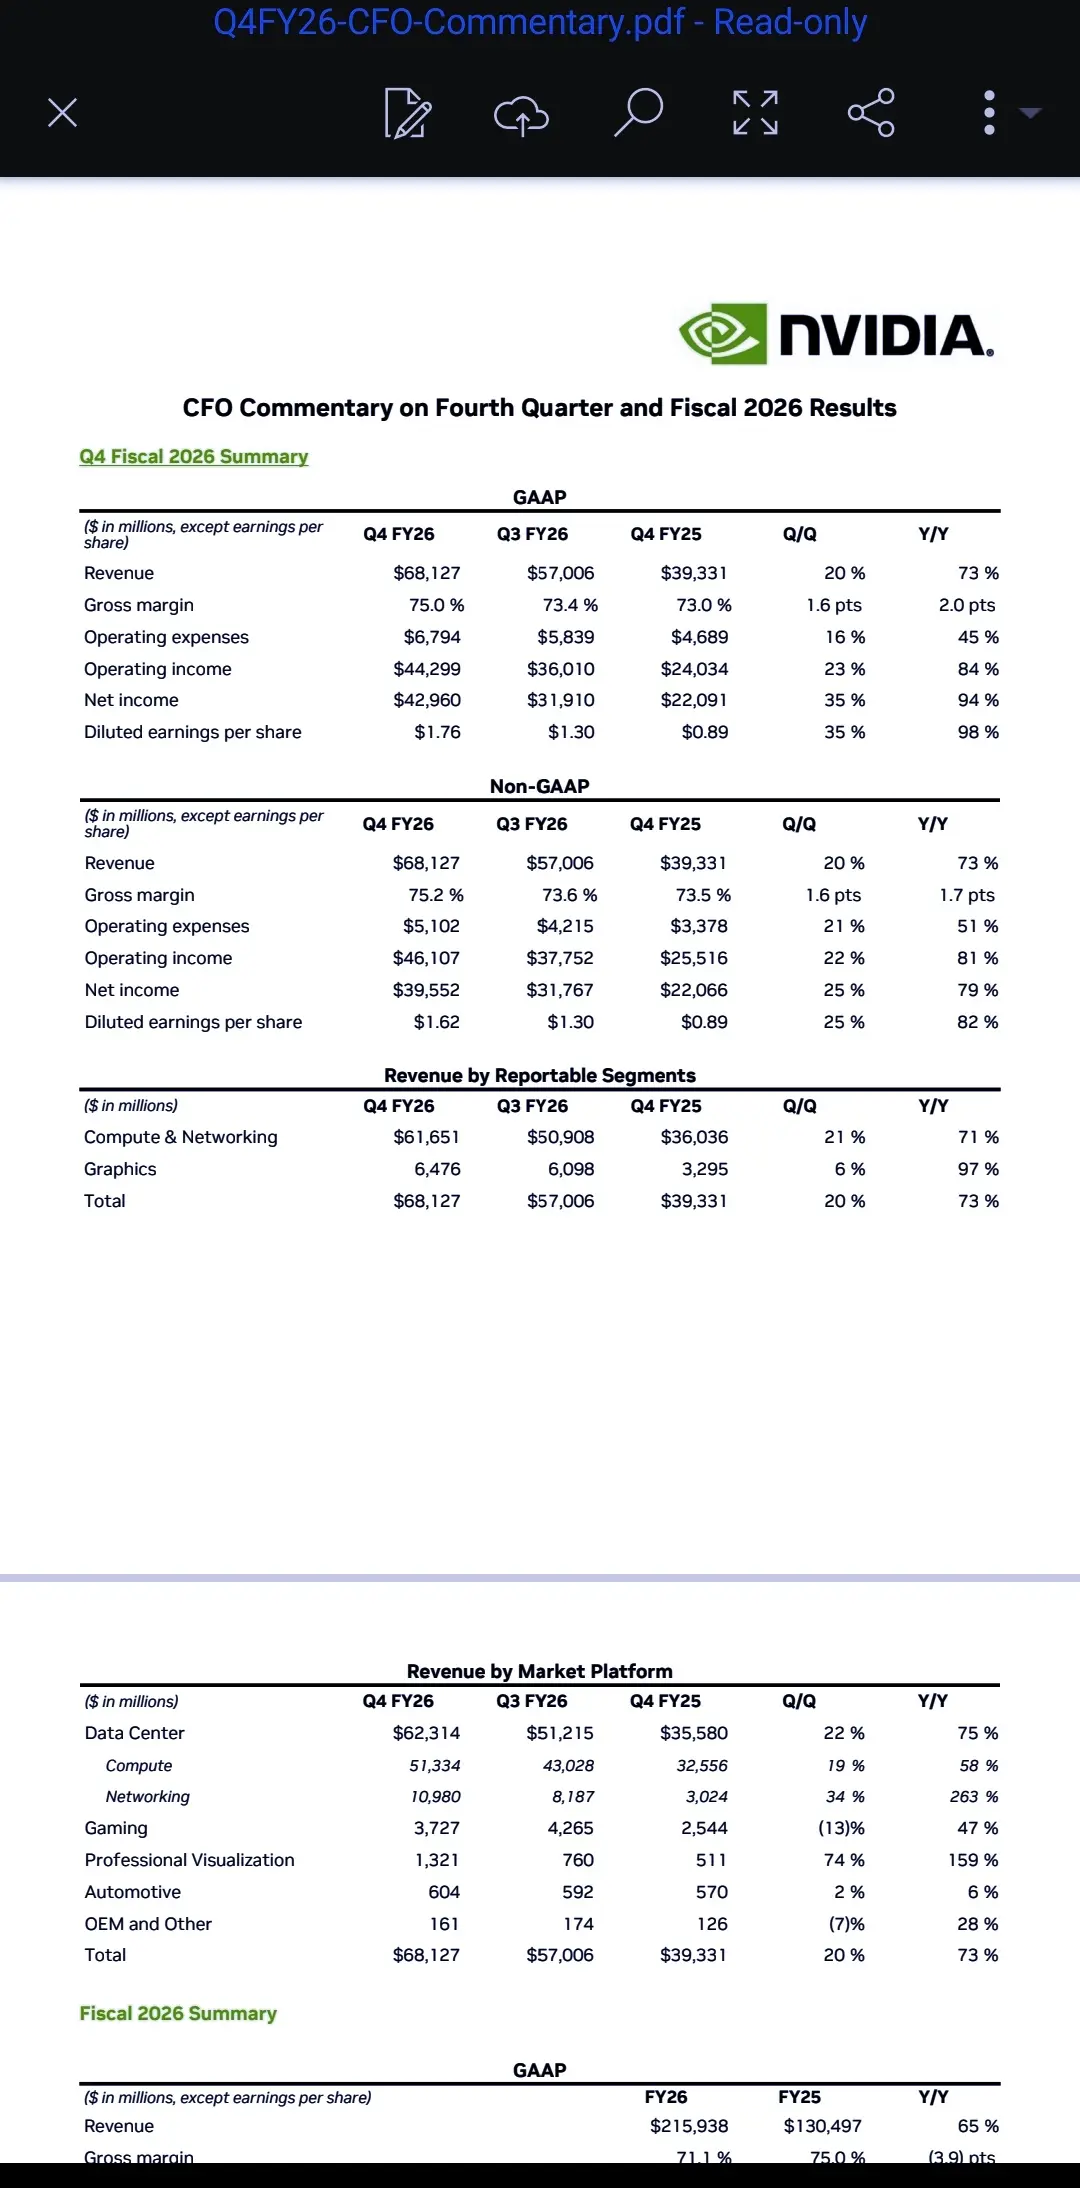
NVIDIA had a strong end to its 2026 fiscal year. In the last quarter alone, it made $68.1 billion in revenue — nearly double what it made in the same quarter the year before. Its profit for that quarter was $42.96 billion. The biggest chunk of its money came from data centers, which brought in $62.31 billion.
For the full year, NVIDIA made $215.9 billion in total revenue, a 65% jump from the previous year.
Looking ahead, the company expects to make around $78 billion in the next quarter, continuing its impressive growth streak.
$BTC
#NVIDIA #CryptoMarketRebounds #NvidiaQ4RevenueSurges73% #Bit
For the full year, NVIDIA made $215.9 billion in total revenue, a 65% jump from the previous year.
Looking ahead, the company expects to make around $78 billion in the next quarter, continuing its impressive growth streak.
$BTC
#NVIDIA #CryptoMarketRebounds #NvidiaQ4RevenueSurges73% #Bit
BTC0.4%

- Reward
- 1
- Comment
- Repost
- Share
🔥 NEW: Travala now lets you rent cars in 150+ countries worldwide, thanks to a partnership with CarTrawler. You can pay with crypto like $BTC , $ETH , $USDT, $USDC, $SOL , or regular money.
#Travala #buywithcrypto #BuyTheDipOrWaitNow? #btc #GateTradFiExperience
#Travala #buywithcrypto #BuyTheDipOrWaitNow? #btc #GateTradFiExperience


- Reward
- 1
- Comment
- Repost
- Share
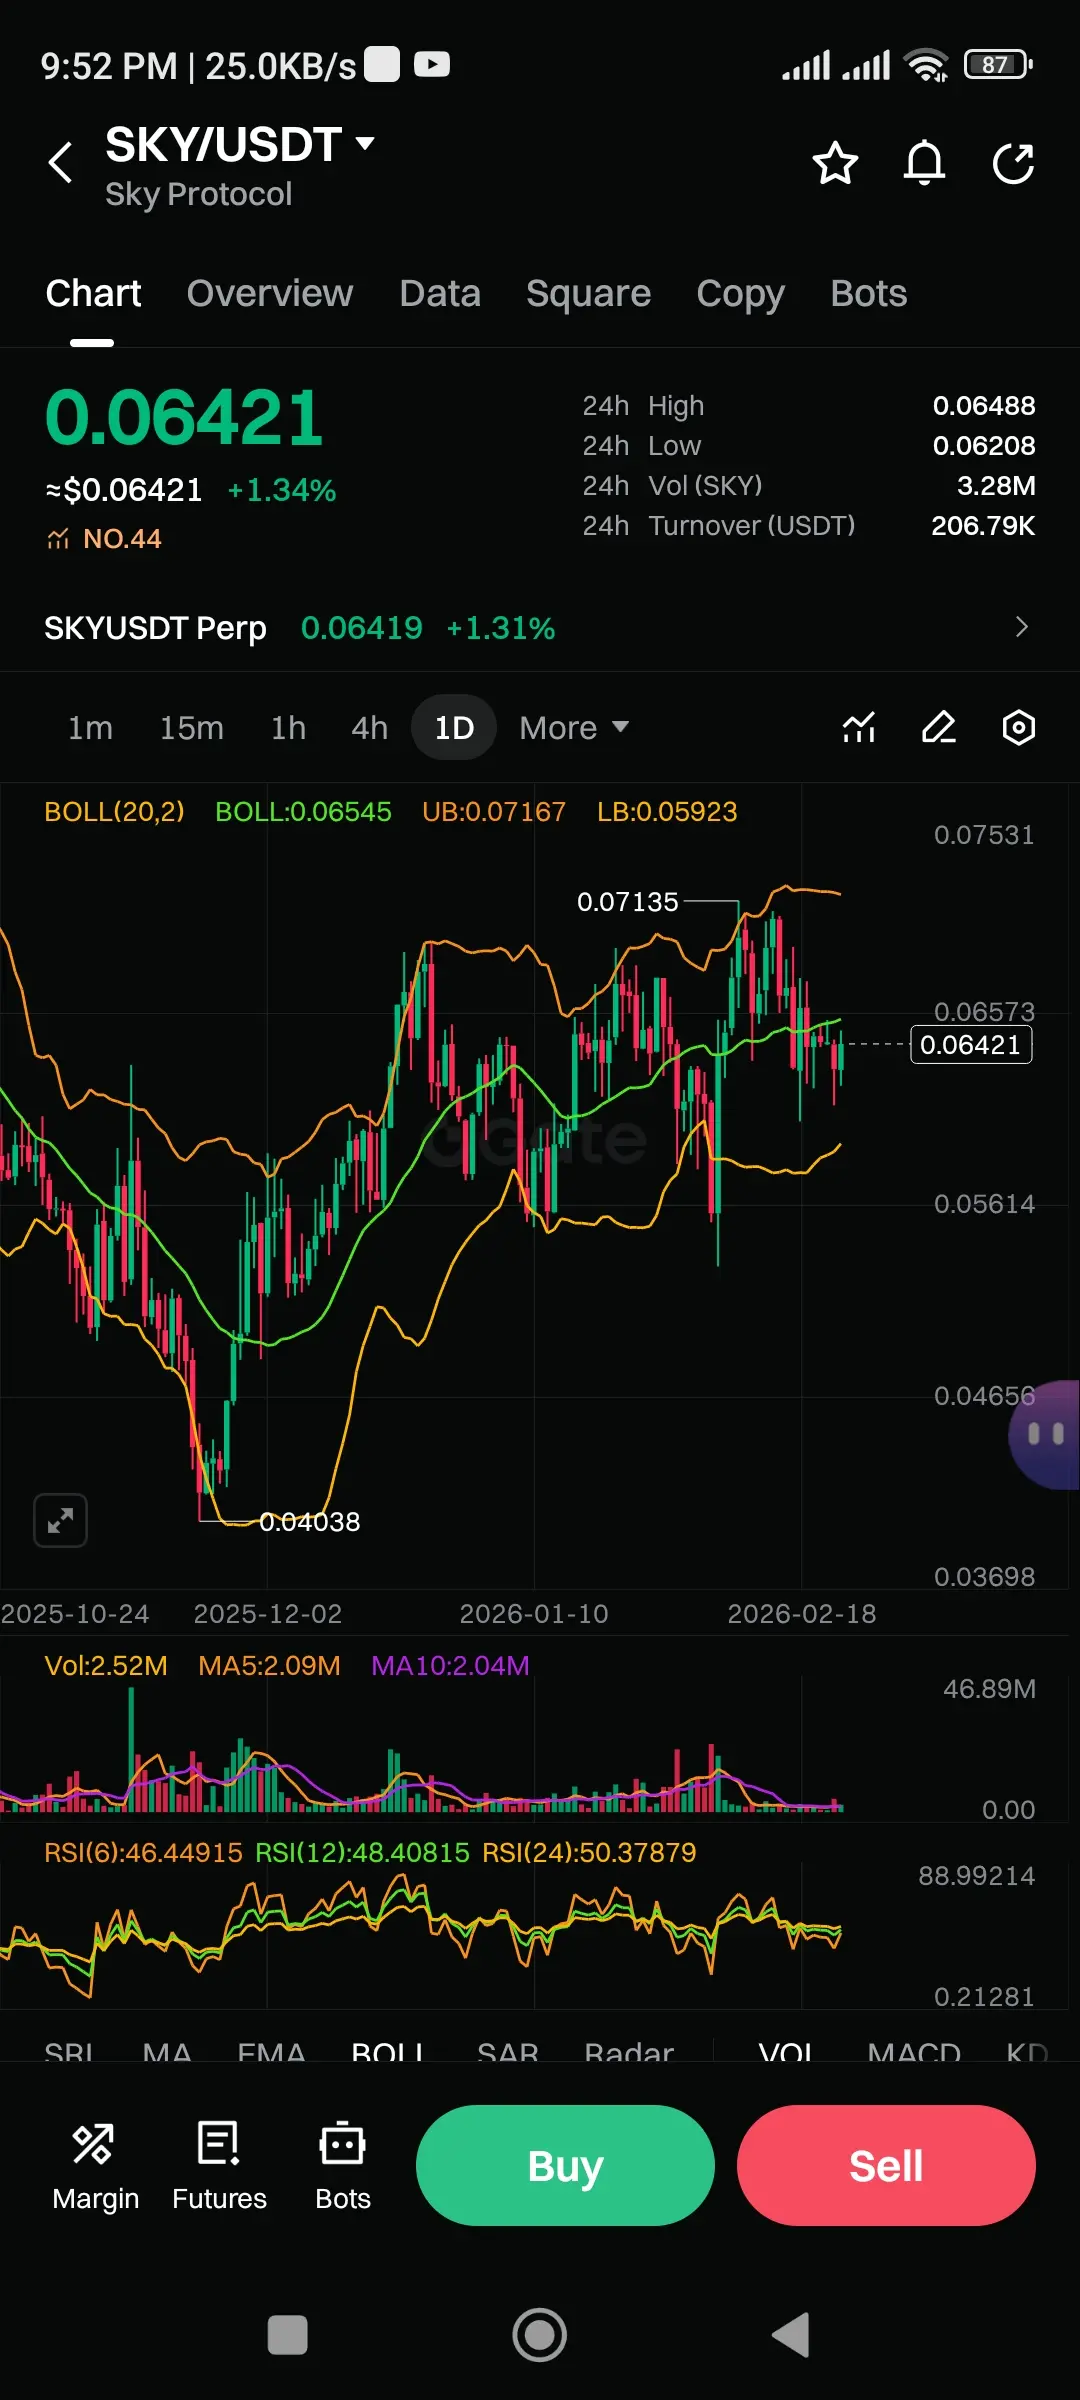
📈 $SKY /USDT Daily Chart: Is a Big Move Coming?
Hey traders! After a recent price drop caused by market-wide sell-offs and profit-taking, the$SKY /USDT daily chart is setting up something interesting. The RSI has dropped into the 40s, which is a quiet sign that buyers may be stepping back in. The price is also sitting near the bottom of the Bollinger Bands a zone where bounces commonly happen. On top of that, selling volume is fading, meaning sellers are running out of steam.
What's most exciting? SKY is holding its key support levels while most other altcoins are still falling. That's a sig
SKY2.12%
- Reward
- 1
- Comment
- Repost
- Share
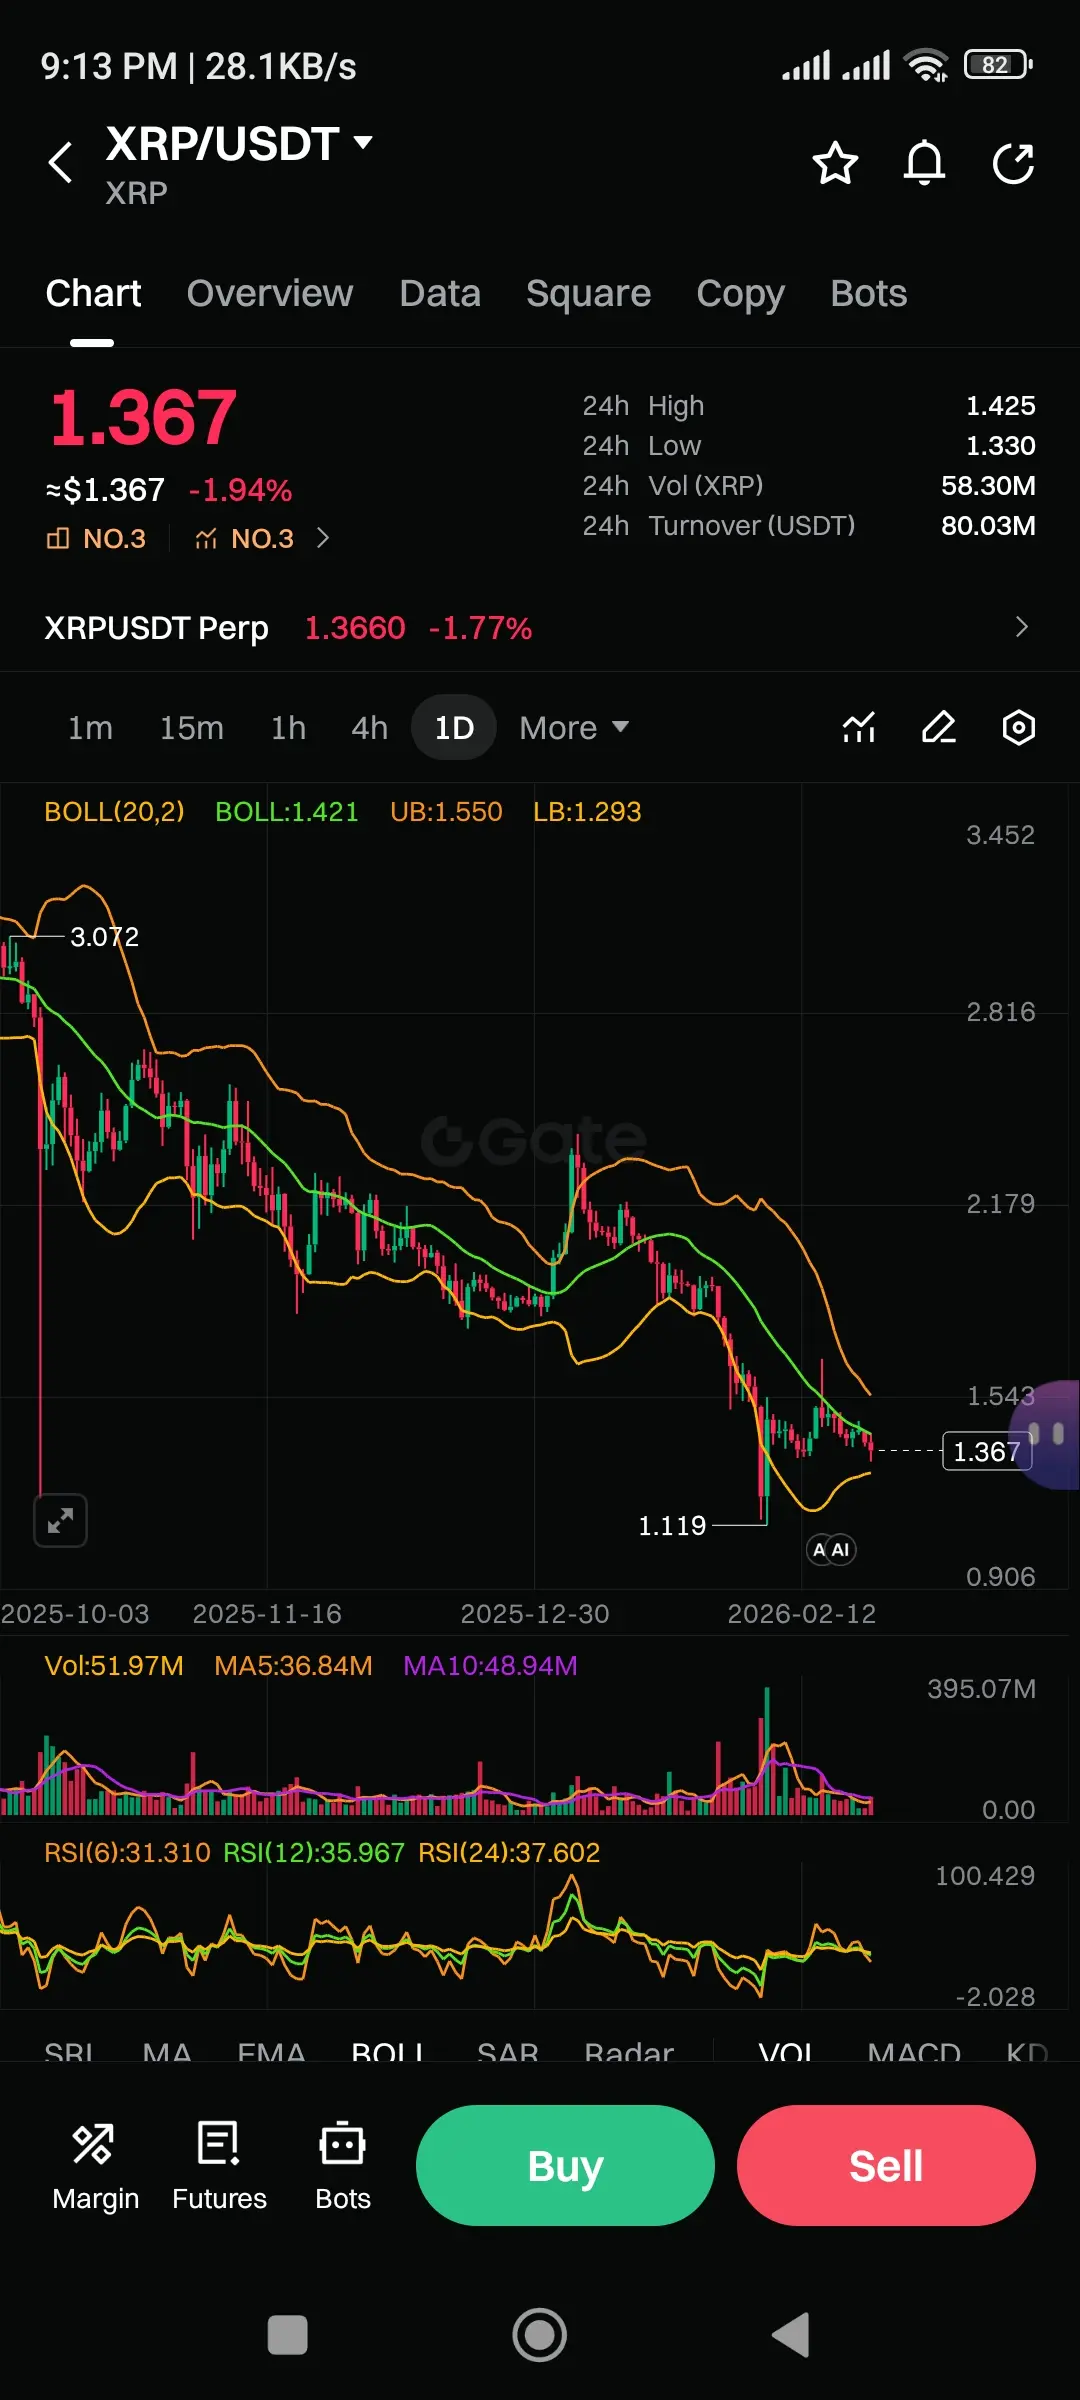
🚨$XRP /USDT 1D Analysis — Is A Reversal Loading?
Current Price: $1.367 | -1.94%
XRP has bled heavily from its $3.072 peak, pressured by sustained bearish momentum, mass profit-taking, and weakening altcoin sentiment. Declining volume MAs and macro uncertainty accelerated the downtrend through early 2026.
📊 Technical Snapshot:
🔴 BOLL(20,2) Price trading below middle band (1.421), squeezing near lower band (LB: 1.293). Classic compression before explosive moves.
🟡 RSI(6): 31.31 | RSI(12): 35.97 | RSI(24): 37.60 All RSI timeframes screaming oversold. Multi-timeframe confluence rarely lies.
📦
XRP-0.07%
- Reward
- 1
- Comment
- Repost
- Share
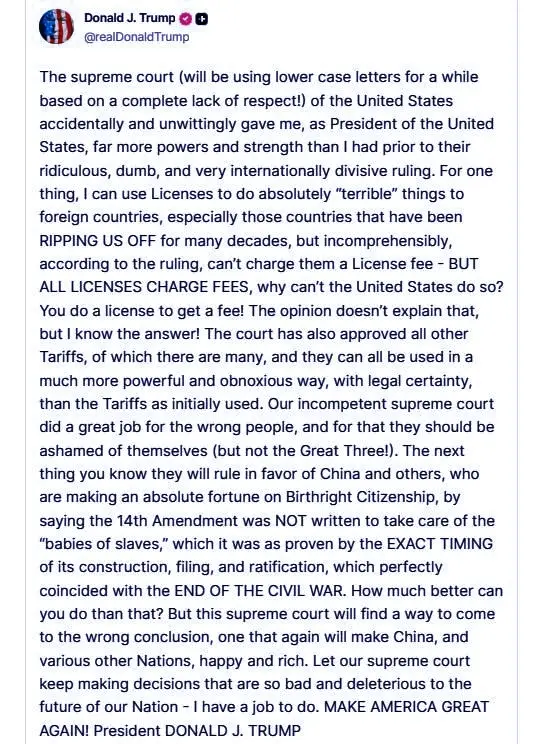
🇺🇸 JUST IN: Donald Trump says he has the power to use licenses and tariffs (taxes on imports) harshly against countries he believes have been unfair to the US.
$BTC
#TrumpAnnouncesNewTariffs #WhenisBestTimetoEntertheMarket #CLARITYActAdvances #WhiteHouseTalksStablecoinYields #CryptoSurvivalGuide
$BTC
#TrumpAnnouncesNewTariffs #WhenisBestTimetoEntertheMarket #CLARITYActAdvances #WhiteHouseTalksStablecoinYields #CryptoSurvivalGuide
BTC0.4%

- Reward
- 1
- Comment
- Repost
- Share
🚨 BIG MILESTONE ALERT!
Strategy just made its 100th Bitcoin purchase — buying 592 $BTC to mark the occasion! 🎉
100 buys. All in Bitcoin. No stopping. 🔶
#TrumpAnnouncesNewTariffs #strategy #Saylor #CLARITYActAdvances #bitcoin
Strategy just made its 100th Bitcoin purchase — buying 592 $BTC to mark the occasion! 🎉
100 buys. All in Bitcoin. No stopping. 🔶
#TrumpAnnouncesNewTariffs #strategy #Saylor #CLARITYActAdvances #bitcoin
BTC0.4%

- Reward
- 1
- Comment
- Repost
- Share
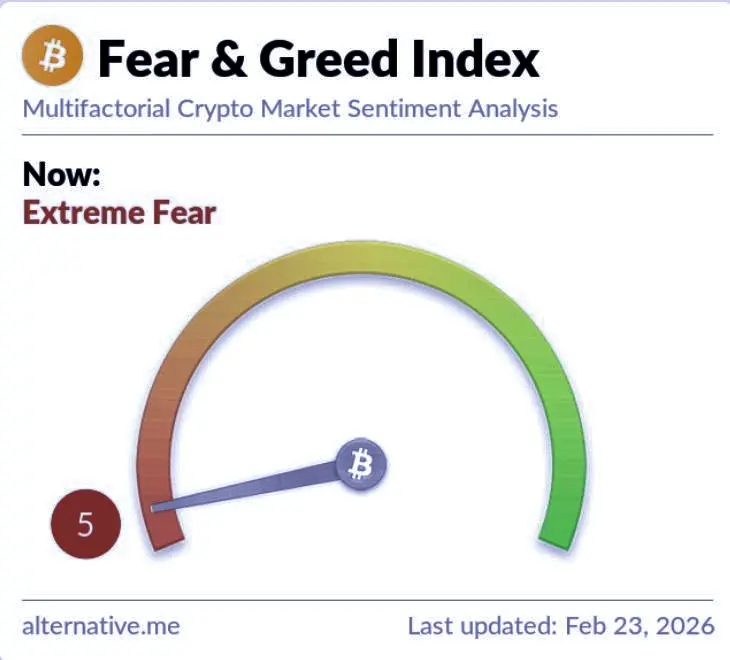
⚠️ 🚨Crypto Market Update:
The Crypto Fear and Greed Index has dropped back down to 5 out of 100, which means people are extremely scared and worried about the crypto market right now. Investors are panicking, and confidence is very low.
$BTC
#fear&greed #TrumpAnnouncesNewTariffs #CLARITYActAdvances #BuyTheDipOrWaitNow? #CryptoSurvivalGuide
BTC0.4%

- Reward
- 2
- Comment
- Repost
- Share
🚨$SKY /USDT 1D Chart Analysis
Current Price: $0.06532 | +1.33%
SKY Protocol painted a textbook V-shaped recovery from its bottom at $0.03538 nearly doubling since then. That's not weakness, that's accumulation done right.
📊 Bollinger Bands show price hugging the mid-band ($0.06529) tightly after rejection from the upper band ($0.07186). A healthy consolidation before the next leg.
🔍 RSI(6): 49.7 | RSI(12): 50.4 | RSI(24): 51.5 All three aligning near 50 signals a perfect neutral-to-bullish reset. Momentum is quietly rebuilding.
📉 Volume cooling down after the rally classic institutional
SKY2.12%
- Reward
- 2
- Comment
- Repost
- Share