Trade
Basic
Futures
Futures
Hundreds of contracts settled in USDT or BTC
TradFi
Gold
Trade global traditional assets with USDT in one place
Options
Hot
Trade European-style vanilla options
Unified Account
Maximize your capital efficiency
Demo Trading
Futures Kickoff
Get prepared for your futures trading
Futures Events
Participate in events to win generous rewards
Demo Trading
Use virtual funds to experience risk-free trading
Earn
Launch
CandyDrop
Collect candies to earn airdrops
Launchpool
Quick staking, earn potential new tokens
HODLer Airdrop
Hold GT and get massive airdrops for free
Launchpad
Be early to the next big token project
Alpha Points
Trade on-chain assets and enjoy airdrop rewards!
Futures Points
Earn futures points and claim airdrop rewards
Investment
Simple Earn
Earn interests with idle tokens
Auto-Invest
Auto-invest on a regular basis
Dual Investment
Buy low and sell high to take profits from price fluctuations
Soft Staking
Earn rewards with flexible staking
Crypto Loan
0 Fees
Pledge one crypto to borrow another
Lending Center
One-stop lending hub
VIP Wealth Hub
Customized wealth management empowers your assets growth
Private Wealth Management
Customized asset management to grow your digital assets
Quant Fund
Top asset management team helps you profit without hassle
Staking
Stake cryptos to earn in PoS products
Smart Leverage
New
No forced liquidation before maturity, worry-free leveraged gains
GUSD Minting
Use USDT/USDC to mint GUSD for treasury-level yields
More
SamDoors
🇺🇸 Thank you for your Attention to this matter!
- Reward
- like
- Comment
- Repost
- Share
- Reward
- like
- Comment
- Repost
- Share
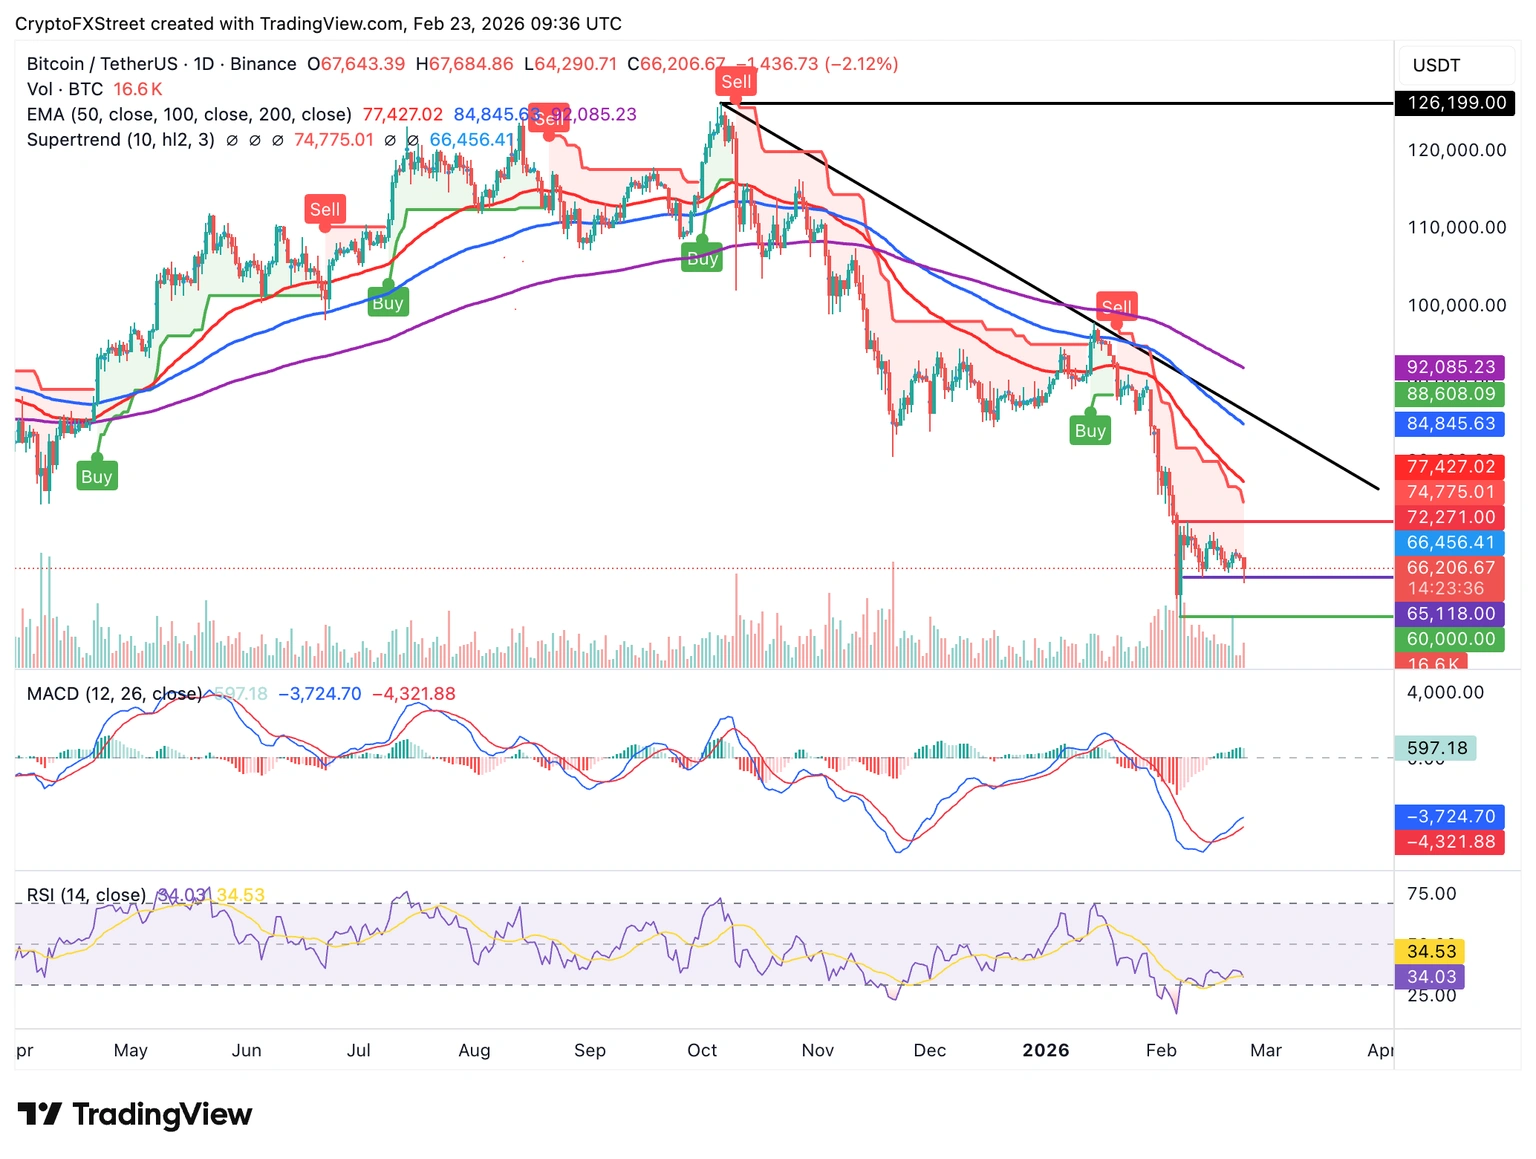
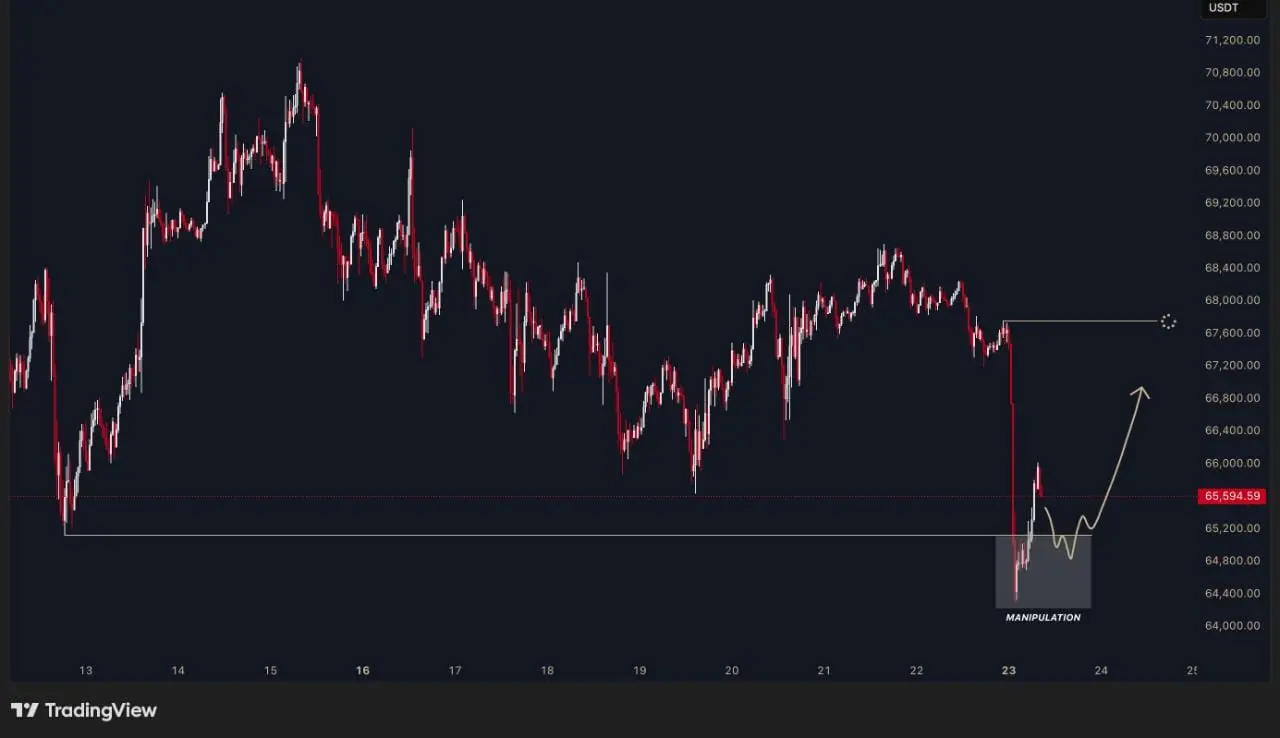
- Daily Chart: Bitcoin Sellers Tighten Their Grip:
The price of Bitcoin hovers above $66,000, below the 50-day exponential moving average (EMA) at $77,427, the 100-day exponential moving average at $84,845, and the 200-day exponential moving average at $92,085.
Key technical indicators, such as the Relative Strength Index (RSI) at 34 on the daily chart, suggest the bearish momentum may continue in the upcoming sessions. The SuperTrend indicator appears to be capping Bitcoin's rise at $72,271. Therefore, traders should watch the daily low at $64,291, which is likely to absorb selling pressure a
BTC-4,77%

- Reward
- 1
- 1
- Repost
- Share
Before00zero:
The price of Bitcoin remains above $66,000, but it is still under pressure as the total cryptocurrency liquidations approach $500 million over the past 24 hours.Arab
Arabica
Created By@GateUser-dd700158
Listing Progress
0.00%
MC:
$0.1
More Tokens
Gn Bang Bang Crypto Gang😈😈
Follow And Like For Stay With Each Other
Can I Get A Gn Back Brother😈..???
Follow And Like For Stay With Each Other
Can I Get A Gn Back Brother😈..???

- Reward
- like
- Comment
- Repost
- Share

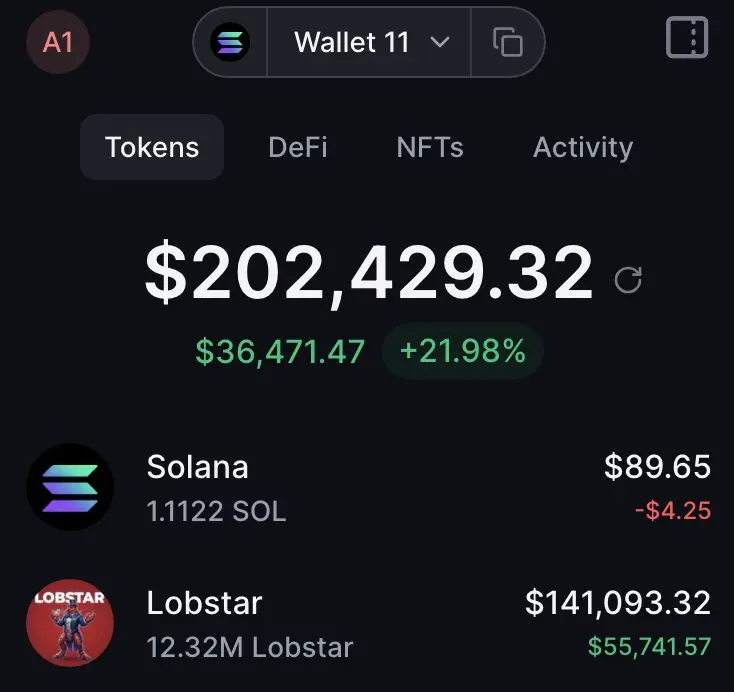
This was $5,000 $Lobstar yesterday
Never fade me again.
Never fade me again.
- Reward
- like
- Comment
- Repost
- Share
Join the horse racing predictions, complete tasks to earn horse racing tickets, enjoy daily million Gift Coins giveaways, and share a 100,000 USDT prize pool—all at the Gate 2026 Spring Festival Celebration. https://www.gate.com/competition/year-of-horse-2026?ref_type=165&utm_cmp=7EQB9Jba&ref=VVNHBAXDBQ

- Reward
- 1
- 2
- Repost
- Share
xxx40xxx :
:
2026 GOGOGO 👊View More
Market Analysis
1.453
- Reward
- like
- Comment
- Repost
- Share
NZD/USD Slides Back as Dollar Faces Weird 2025 Pressure - - #nzd #nzdusd #rbnz

- Reward
- like
- Comment
- Repost
- Share
- Reward
- like
- Comment
- Repost
- Share
Fed march rate decision preview.91 probability of holding rates steady, signaling a clearer policy path
415
- Reward
- like
- Comment
- Repost
- Share
芝麻传奇
芝麻传奇之路
Created By@gatefunuser_e111
Listing Progress
100.00%
MC:
$2.1K
More Tokens
Check out Gate and join me in the hottest event! https://www.gate.com/campaigns/4073?ref_type=132&utm_cmp=dmHSbsFn

- Reward
- like
- Comment
- Repost
- Share

Participate in horse racing betting, complete tasks to earn horse racing tickets, and enjoy a million red envelope rain daily, sharing a prize pool of 100,000 USDT at the Gate 2026 Spring Festival Celebration. https://www.gate.com/competition/year-of-horse-2026?ref_type=165&utm_cmp=7EQB9Jba&ref=VlZDBw9W
View Original
- Reward
- like
- Comment
- Repost
- Share
Participate in horse racing betting, complete tasks to earn horse racing tickets, and enjoy a million red envelope rain daily, sharing a prize pool of 100,000 USDT at Gate 2026 Spring Festival Celebration. https://www.gate.com/competition/year-of-horse-2026?ref_type=165&utm_cmp=7EQB9Jba&ref=VLCVVLBEAA
View Original
- Reward
- like
- Comment
- Repost
- Share
The 12 profitable businesses in crypto waiting for ZachXBT to drop the thread.

- Reward
- like
- Comment
- Repost
- Share
Post and Interact to Share $50,000 Red Packets on Gate Square https://www.gate.com/campaigns/4044?ref=VLFNVVLWBW&ref_type=132

- Reward
- like
- Comment
- Repost
- Share
Join the horse racing predictions, complete tasks to earn horse racing tickets, enjoy daily million Gift Coins giveaways, and share a 100,000 USDT prize pool—all at the Gate 2026 Spring Festival Celebration. https://www.gate.com/competition/year-of-horse-2026?ref_type=165&utm_cmp=7EQB9Jba&ref=VLBCXFGMBW

- Reward
- like
- Comment
- Repost
- Share
Load More
Join 40M users in our growing community
⚡️ Join 40M users in the crypto craze discussion
💬 Engage with your favorite top creators
👍 See what interests you
Trending Topics
View More387.27K Popularity
128.86K Popularity
439.26K Popularity
19.51K Popularity
138.28K Popularity
Hot Gate Fun
View More- MC:$2.37KHolders:10.00%
- MC:$0.1Holders:10.00%
- MC:$0.1Holders:10.00%
- MC:$0.1Holders:10.00%
- MC:$2.38KHolders:10.00%
News
View MorePin