Trade
Basic
Futures
Futures
Hundreds of contracts settled in USDT or BTC
TradFi
Gold
Trade global traditional assets with USDT in one place
Options
Hot
Trade European-style vanilla options
Unified Account
Maximize your capital efficiency
Demo Trading
Futures Kickoff
Get prepared for your futures trading
Futures Events
Participate in events to win generous rewards
Demo Trading
Use virtual funds to experience risk-free trading
Earn
Launch
CandyDrop
Collect candies to earn airdrops
Launchpool
Quick staking, earn potential new tokens
HODLer Airdrop
Hold GT and get massive airdrops for free
Launchpad
Be early to the next big token project
Alpha Points
Trade on-chain assets and enjoy airdrop rewards!
Futures Points
Earn futures points and claim airdrop rewards
Investment
Simple Earn
Earn interests with idle tokens
Auto-Invest
Auto-invest on a regular basis
Dual Investment
Buy low and sell high to take profits from price fluctuations
Soft Staking
Earn rewards with flexible staking
Crypto Loan
0 Fees
Pledge one crypto to borrow another
Lending Center
One-stop lending hub
VIP Wealth Hub
Customized wealth management empowers your assets growth
Private Wealth Management
Customized asset management to grow your digital assets
Quant Fund
Top asset management team helps you profit without hassle
Staking
Stake cryptos to earn in PoS products
Smart Leverage
New
No forced liquidation before maturity, worry-free leveraged gains
GUSD Minting
Use USDT/USDC to mint GUSD for treasury-level yields
More
ProfessionalBrotherOnlyEmpty
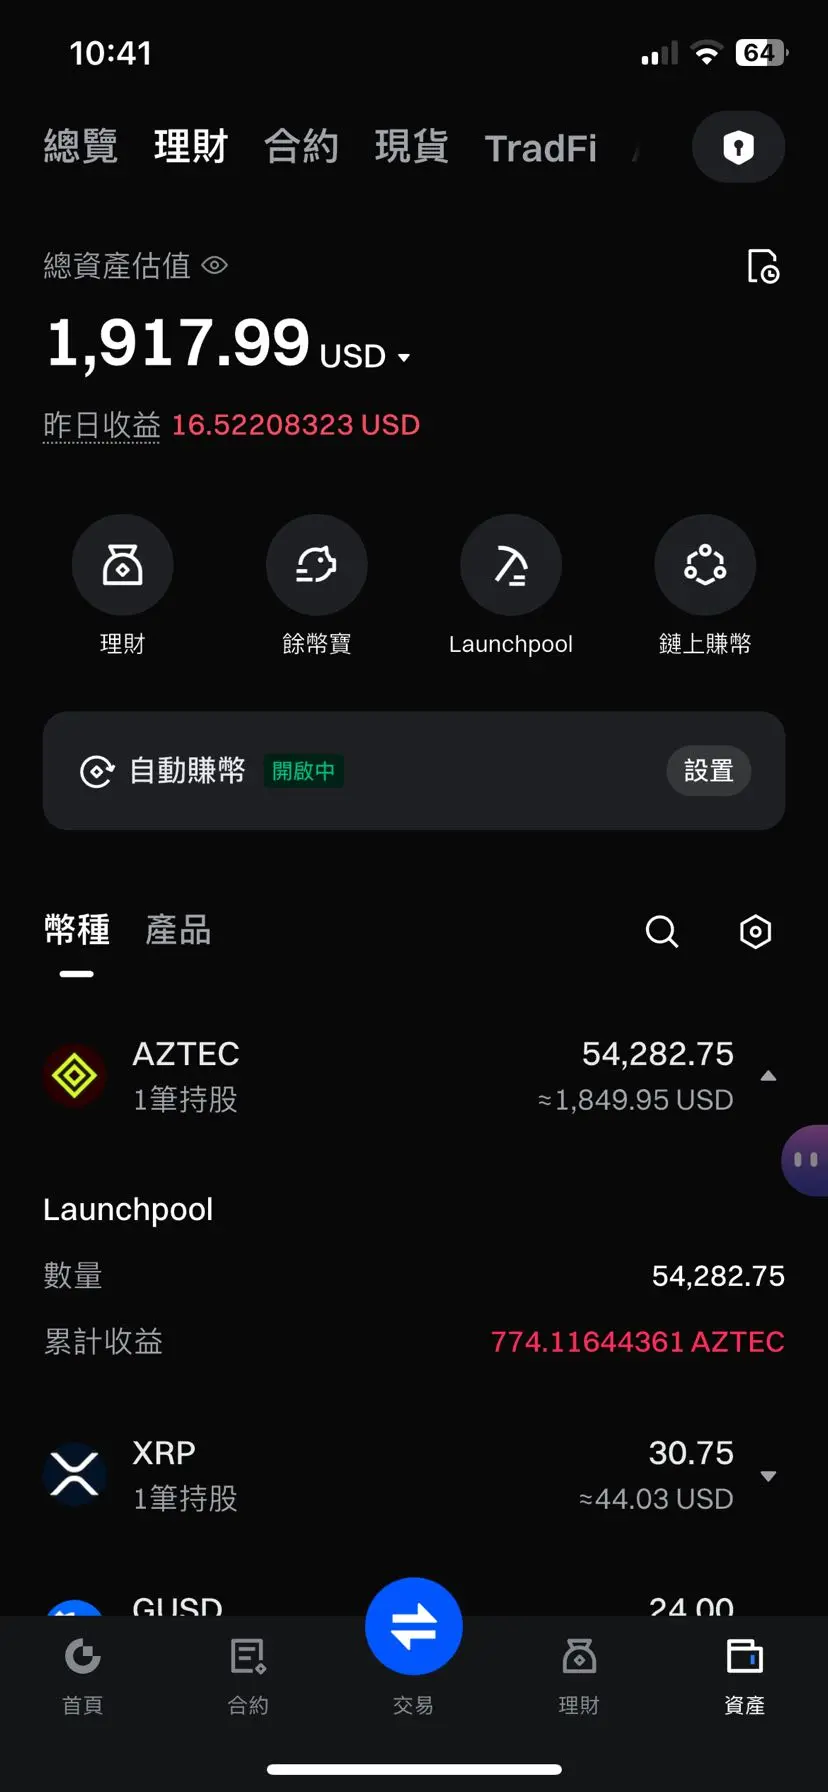
#我在Gate广场过新年 Today my friend said that if he goes broke, I shouldn't laugh at him to be considered a friend. After hearing that, I cried. I told him he's setting the bar too low. If he goes broke, I will definitely give him a few hundred bucks to eat. The premise is that I have it! The crypto world is ruthless! Humanity still has love! May we never hear the words "liquidation" again in 2026! It's all about taking profits and selling early! Keep going!$ETH
ETH0,21%


[The user has shared his/her trading data. Go to the App to view more.]
- Reward
- 2
- 6
- Repost
- Share
Short-TermAce:MasteringTheArt :
:
Hop on board!🚗View More
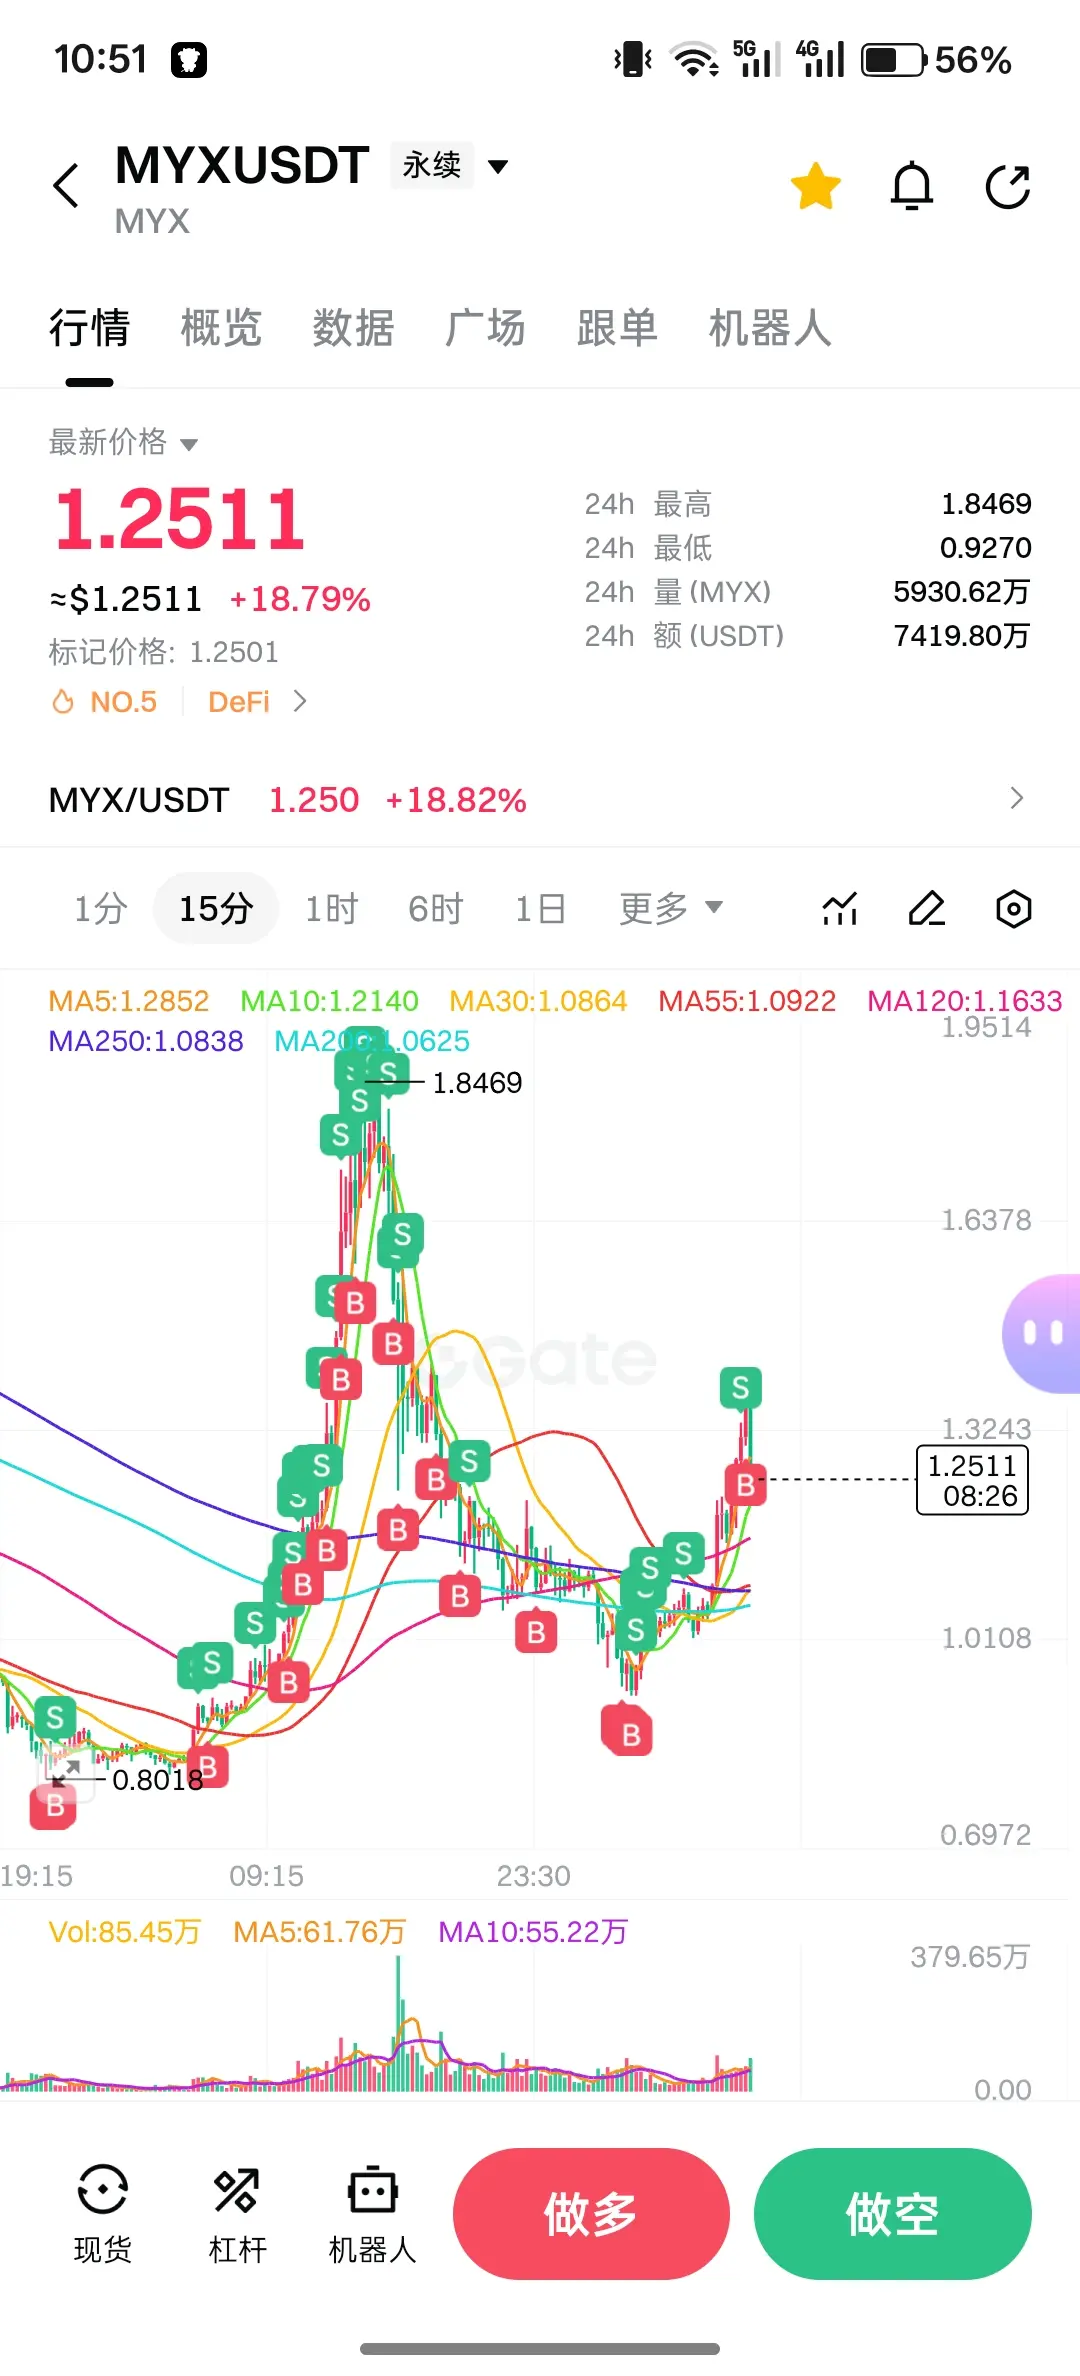
$MYX My personal understanding is that we are currently in the stage of violent testing, shaking out, and grabbing funds after changing the market maker. It’s impossible to go straight up; it’s definitely a process of pulling up and shaking out. The best approach is to buy spot if you’re confident. I’m only playing with low-leverage contracts myself. Do not hold heavy positions. There are many opportunities, so don’t try to accomplish everything in one go. 😀
MYX-2,46%
- Reward
- 4
- 1
- Repost
- Share
Chujang :
:
Indeed, it's a good thing that the market makers are willing to play; otherwise, the coin dying would really be pointless.🙅 Tether announced it will discontinue support for the offshore yuan stablecoin CNH₮ effective immediately. No new tokens will be issued, and redemption support will end one year after the announcement, with a prior reminder. The decision was based on market conditions and #limited demand, as CNH₮’s #scale no longer justifies ongoing operational support. CNH₮ will remain redeemable under Tether’s terms until the deadline, and holders are advised to redeem promptly. #stablecoin
#crypto
#crypto
- Reward
- like
- Comment
- Repost
- Share
芝麻开门
芝麻开门
Created By@DreamJourney
Listing Progress
100.00%
MC:
$2.01K
More Tokens
ABOUT BTC
In our technical analysis of Bitcoin chart, the upward trend continues as before. Currently at 68,500, this is the resistance point, and when a decline occurs, we will monitor 66,800. If it stays below this level, sharp declines may happen; if it remains in sideways movement above, the rise to 71,500 and 74,000 will continue accordingly.
If you have any analyses about altcoins you want to learn about, write in the comments and we will try to help you. If you have any questions, write in the comments and they will be answered.
$BTC $GT $ETH
View OriginalIn our technical analysis of Bitcoin chart, the upward trend continues as before. Currently at 68,500, this is the resistance point, and when a decline occurs, we will monitor 66,800. If it stays below this level, sharp declines may happen; if it remains in sideways movement above, the rise to 71,500 and 74,000 will continue accordingly.
If you have any analyses about altcoins you want to learn about, write in the comments and we will try to help you. If you have any questions, write in the comments and they will be answered.
$BTC $GT $ETH

- Reward
- 1
- Comment
- Repost
- Share
Join the horse racing predictions, complete tasks to earn horse racing tickets, enjoy daily million Gift Coins giveaways, and share a 100,000 USDT prize pool—all at the Gate 2026 Spring Festival Celebration. https://www.gate.com/competition/year-of-horse-2026?ref_type=165&utm_cmp=7EQB9Jba&ref=VQMVBFKNBA

- Reward
- 4
- 6
- Repost
- Share
Discovery :
:
To The Moon 🌕View More
Participate in horse racing betting, complete tasks to earn horse racing tickets, and enjoy a million red envelope rain daily, sharing a prize pool of 100,000 USDT at the Gate 2026 Spring Festival Celebration. https://www.gate.com/competition/year-of-horse-2026?ref_type=165&utm_cmp=7EQB9Jba&ref=VGQVUFBWUW
View Original
- Reward
- like
- Comment
- Repost
- Share
Participate in horse racing betting, complete tasks to earn horse racing tickets, and enjoy a million red envelope rain daily, sharing a prize pool of 100,000 USDT at the Gate 2026 Spring Festival Celebration. https://www.gate.com/competition/year-of-horse-2026?ref_type=165&utm_cmp=7EQB9Jba&ref=VQJBV1OLUW
View Original
- Reward
- 1
- Comment
- Repost
- Share
Participate in horse racing betting, complete tasks to earn horse racing tickets, and enjoy a million red envelope rain daily, sharing a prize pool of 100,000 USDT at the Gate 2026 Spring Festival Celebration. https://www.gate.com/competition/year-of-horse-2026?ref_type=165&utm_cmp=7EQB9Jba&ref=UlFCBFAK
View Original
- Reward
- like
- Comment
- Repost
- Share
#GateSquare$50KRedPacketGiveaway Gate Square’s SocialFi Evolution: Moving Beyond Seasonal Campaigning
As 2026 progresses, Gate.io is transforming Gate Square from a holiday promotion platform into a persistent SocialFi ecosystem designed to sustain long-term community activity. The Lunar New Year Red Packet campaign, originally launched with a $50,000 reward pool, is now evolving into a structured engagement architecture that continues driving daily active users beyond the February 9–23 activation window. App adoption data indicates that version 8.8.0+ significantly improved behavioral analyti
As 2026 progresses, Gate.io is transforming Gate Square from a holiday promotion platform into a persistent SocialFi ecosystem designed to sustain long-term community activity. The Lunar New Year Red Packet campaign, originally launched with a $50,000 reward pool, is now evolving into a structured engagement architecture that continues driving daily active users beyond the February 9–23 activation window. App adoption data indicates that version 8.8.0+ significantly improved behavioral analyti
- Reward
- 5
- 6
- Repost
- Share
ShainingMoon:
To The Moon 🌕View More
Receiving dividends in Digital Gold: Lessons in modern capital management
The best risk management right now is to learn how Elemental Royalty operates: they fund projects in exchange for production without owning the mine. My advice to everyone is to apply this "don't put all your eggs in one basket" mindset to your personal portfolio. Receiving dividends in digital gold is a good way to diversify assets beyond cash, but you also need to maintain discipline in allocating proportions. Don't go "all-in" on digitized products; keep a portion of your assets in highly liquid forms to handle any si
The best risk management right now is to learn how Elemental Royalty operates: they fund projects in exchange for production without owning the mine. My advice to everyone is to apply this "don't put all your eggs in one basket" mindset to your personal portfolio. Receiving dividends in digital gold is a good way to diversify assets beyond cash, but you also need to maintain discipline in allocating proportions. Don't go "all-in" on digitized products; keep a portion of your assets in highly liquid forms to handle any si
BTC0,57%

- Reward
- like
- Comment
- Repost
- Share
More 4x ETFs are on the way in the US stock market, making short-term speculation even more exciting🤣
View Original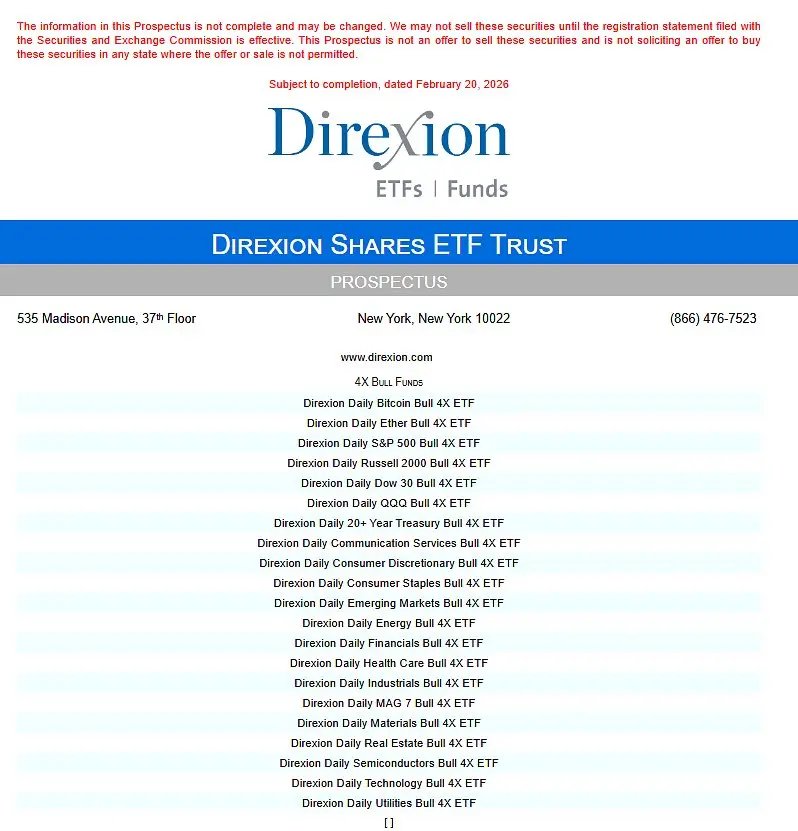
- Reward
- 2
- Comment
- Repost
- Share
- Reward
- like
- 1
- Repost
- Share
SisterLang,Don’tWas:
HoldRoc
Rocket
Created By@Geerqi
Listing Progress
0.00%
MC:
$2.48K
More Tokens
A lucky day on the fifth,
The swallow carries wealth.
Written in Jiajin characters, celebrating a glorious era.
2026, may you:
Have wealth on the chain, and a plan in your heart.
Receive the coins you seek, and everything will be settled perfectly.
View OriginalThe swallow carries wealth.
Written in Jiajin characters, celebrating a glorious era.
2026, may you:
Have wealth on the chain, and a plan in your heart.
Receive the coins you seek, and everything will be settled perfectly.

- Reward
- like
- Comment
- Repost
- Share
- Reward
- 1
- Comment
- Repost
- Share

#我在Gate广场过新年
Today is the fifth day of the Lunar New Year, commonly known as "Po Wu," and a great day to welcome the God of Wealth. In traditional customs, the New Year is not truly over until the fifth day; only then do we fully complete the celebrations. We are also ready to embark on a new year's journey. Folk often talk about "welcoming the God of Wealth," but what exactly are we welcoming? I believe we are not just welcoming a hope, but also a spirit. We are welcoming the righteousness of "Gentlemen love wealth, but acquire it through proper means"; the belief that "Heaven rewards dilige
View OriginalToday is the fifth day of the Lunar New Year, commonly known as "Po Wu," and a great day to welcome the God of Wealth. In traditional customs, the New Year is not truly over until the fifth day; only then do we fully complete the celebrations. We are also ready to embark on a new year's journey. Folk often talk about "welcoming the God of Wealth," but what exactly are we welcoming? I believe we are not just welcoming a hope, but also a spirit. We are welcoming the righteousness of "Gentlemen love wealth, but acquire it through proper means"; the belief that "Heaven rewards dilige


- Reward
- 4
- Comment
- Repost
- Share
Start the Year of the Horse with a win! Gate Plaza's $50,000 Red Envelope Rain is waiting for you to post and smash https://www.gate.com/campaigns/4044?ref=VGNBUFFYAW&ref_type=132
View Original
- Reward
- 1
- Comment
- Repost
- Share
Participate in horse racing betting, complete tasks to earn horse racing tickets, and enjoy a million red envelope rain every day, sharing a prize pool of 100,000 USDT at the Gate 2026 Spring Festival Celebration. https://www.gate.com/competition/year-of-horse-2026?ref_type=165&utm_cmp=7EQB9Jba&ref=VGMWVV5XAW
View Original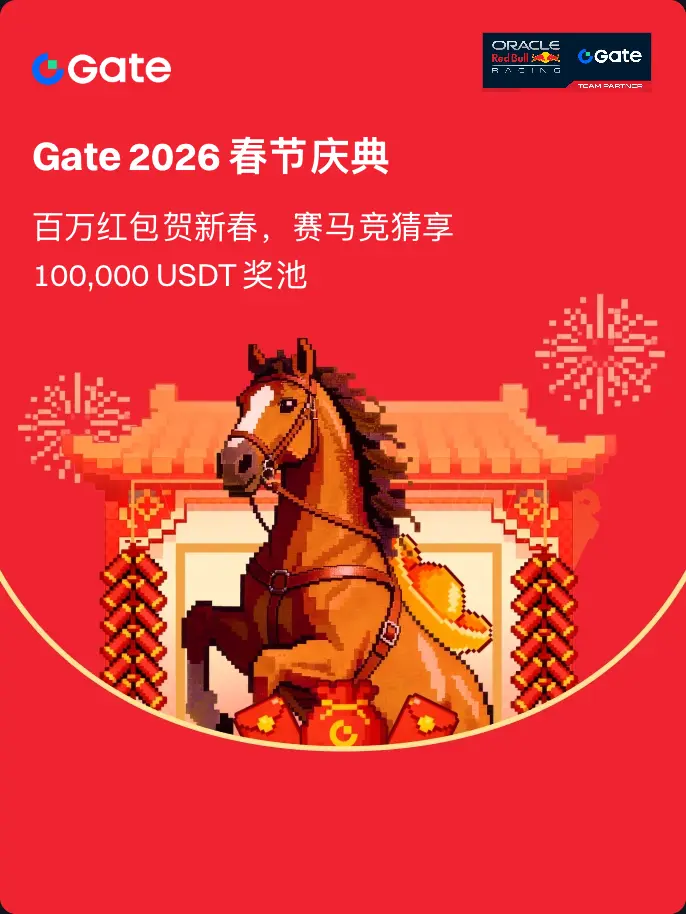
- Reward
- like
- Comment
- Repost
- Share
Live Trading and Learning with Chillzzz
1
- Reward
- like
- Comment
- Repost
- Share
- Reward
- 1
- Comment
- Repost
- Share
Load More
Join 40M users in our growing community
⚡️ Join 40M users in the crypto craze discussion
💬 Engage with your favorite top creators
👍 See what interests you
Trending Topics
View More278.95K Popularity
87.21K Popularity
409.57K Popularity
106.55K Popularity
13.84K Popularity
News
View MoreProject Hunt: The decentralized derivatives exchange MYX.Finance is the project with the most new followers in the past 7 days.
23 m
Project Hunt: Decentralized AI Memory Layer Unibase for the projects most unfollowed by top figures in the past 7 days
23 m
White House officials confirm Trump will visit China from March 31 to April 2
30 m
Brother Ma Ji has once again placed multiple ETH limit sell orders this morning, currently with 14 sell orders in the $1980-$2025 range.
34 m
RootData: SIGN will unlock tokens worth approximately $2.54 million in one week
37 m
Pin