Trade
Basic
Futures
Futures
Hundreds of contracts settled in USDT or BTC
Options
HOT
Trade European-style vanilla options
Unified Account
Maximize your capital efficiency
Demo Trading
Futures Kickoff
Get prepared for your futures trading
Futures Events
Futures Mall
Participate in events to win generous rewards
Demo Trading
Use virtual funds to experience risk-free trading
Earn
Launch
CandyDrop
Collect candies to earn airdrops
Launchpool
Quick staking, earn potential new tokens
HODLer Airdrop
Hold GT and get massive airdrops for free
Launchpad
Be early to the next big token project
Alpha Points
NEW
Trade on-chain assets and enjoy airdrop rewards!
Futures Points
NEW
Earn futures points and claim airdrop rewards
Investment
Simple Earn
Earn interests with idle tokens
Auto-Invest
Auto-invest on a regular basis
Dual Investment
Buy low and sell high to take profits from price fluctuations
Soft Staking
Earn rewards with flexible staking
Crypto Loan
0 Fees
Pledge one crypto to borrow another
Lending Center
One-stop lending hub
VIP Wealth Hub
Customized wealth management empowers your assets growth
Private Wealth Management
Customized asset management to grow your digital assets
Quant Fund
Top asset management team helps you profit without hassle
Staking
Stake cryptos to earn in PoS products
Smart Leverage
NEW
No forced liquidation before maturity, worry-free leveraged gains
GUSD Minting
Use USDT/USDC to mint GUSD for treasury-level yields
More
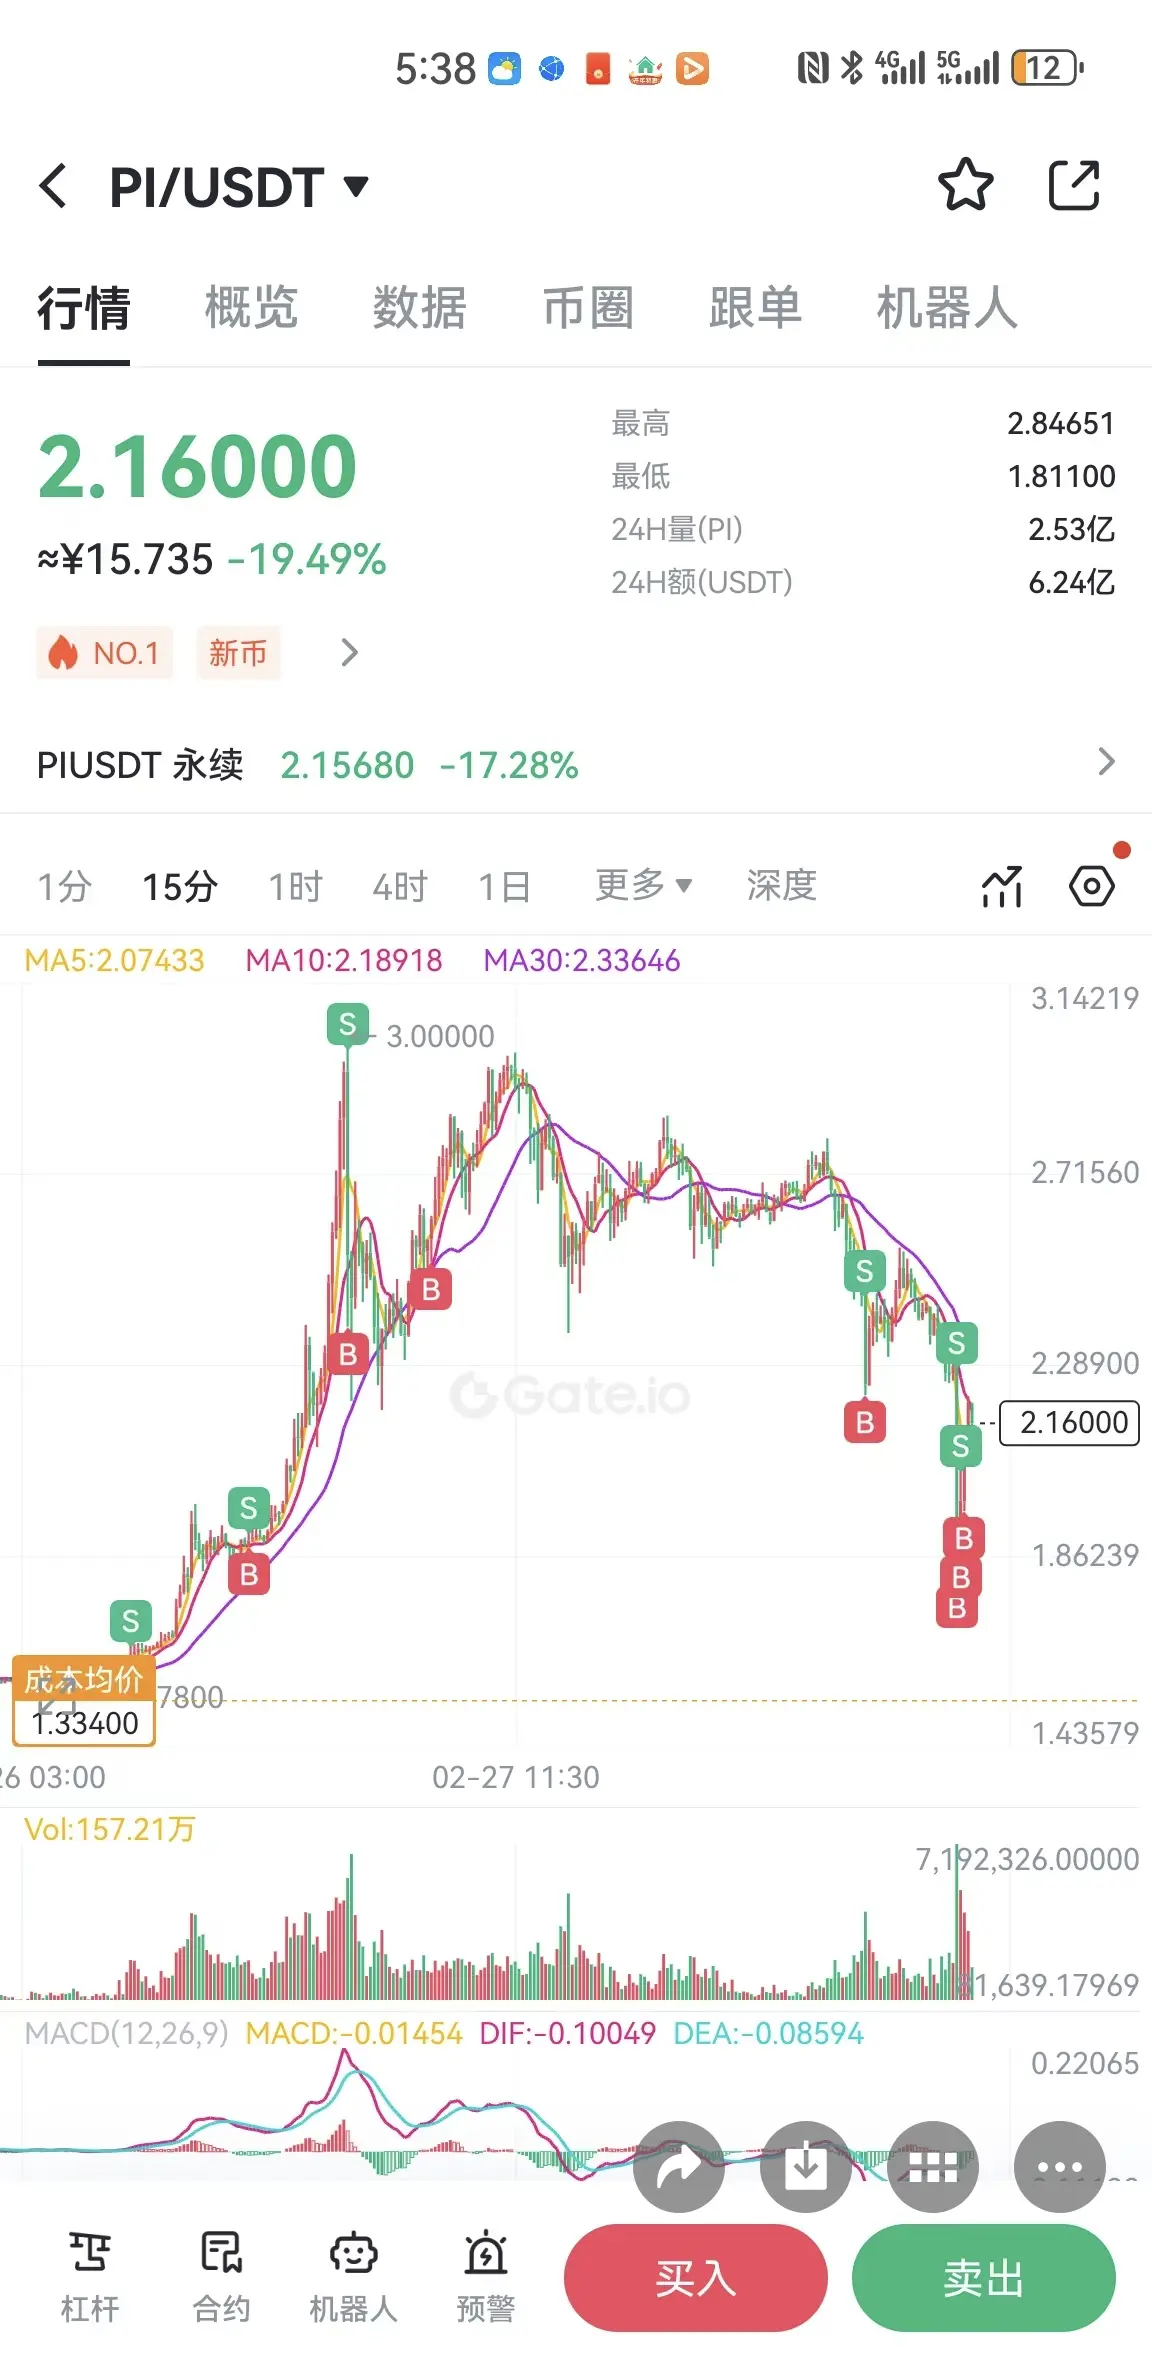
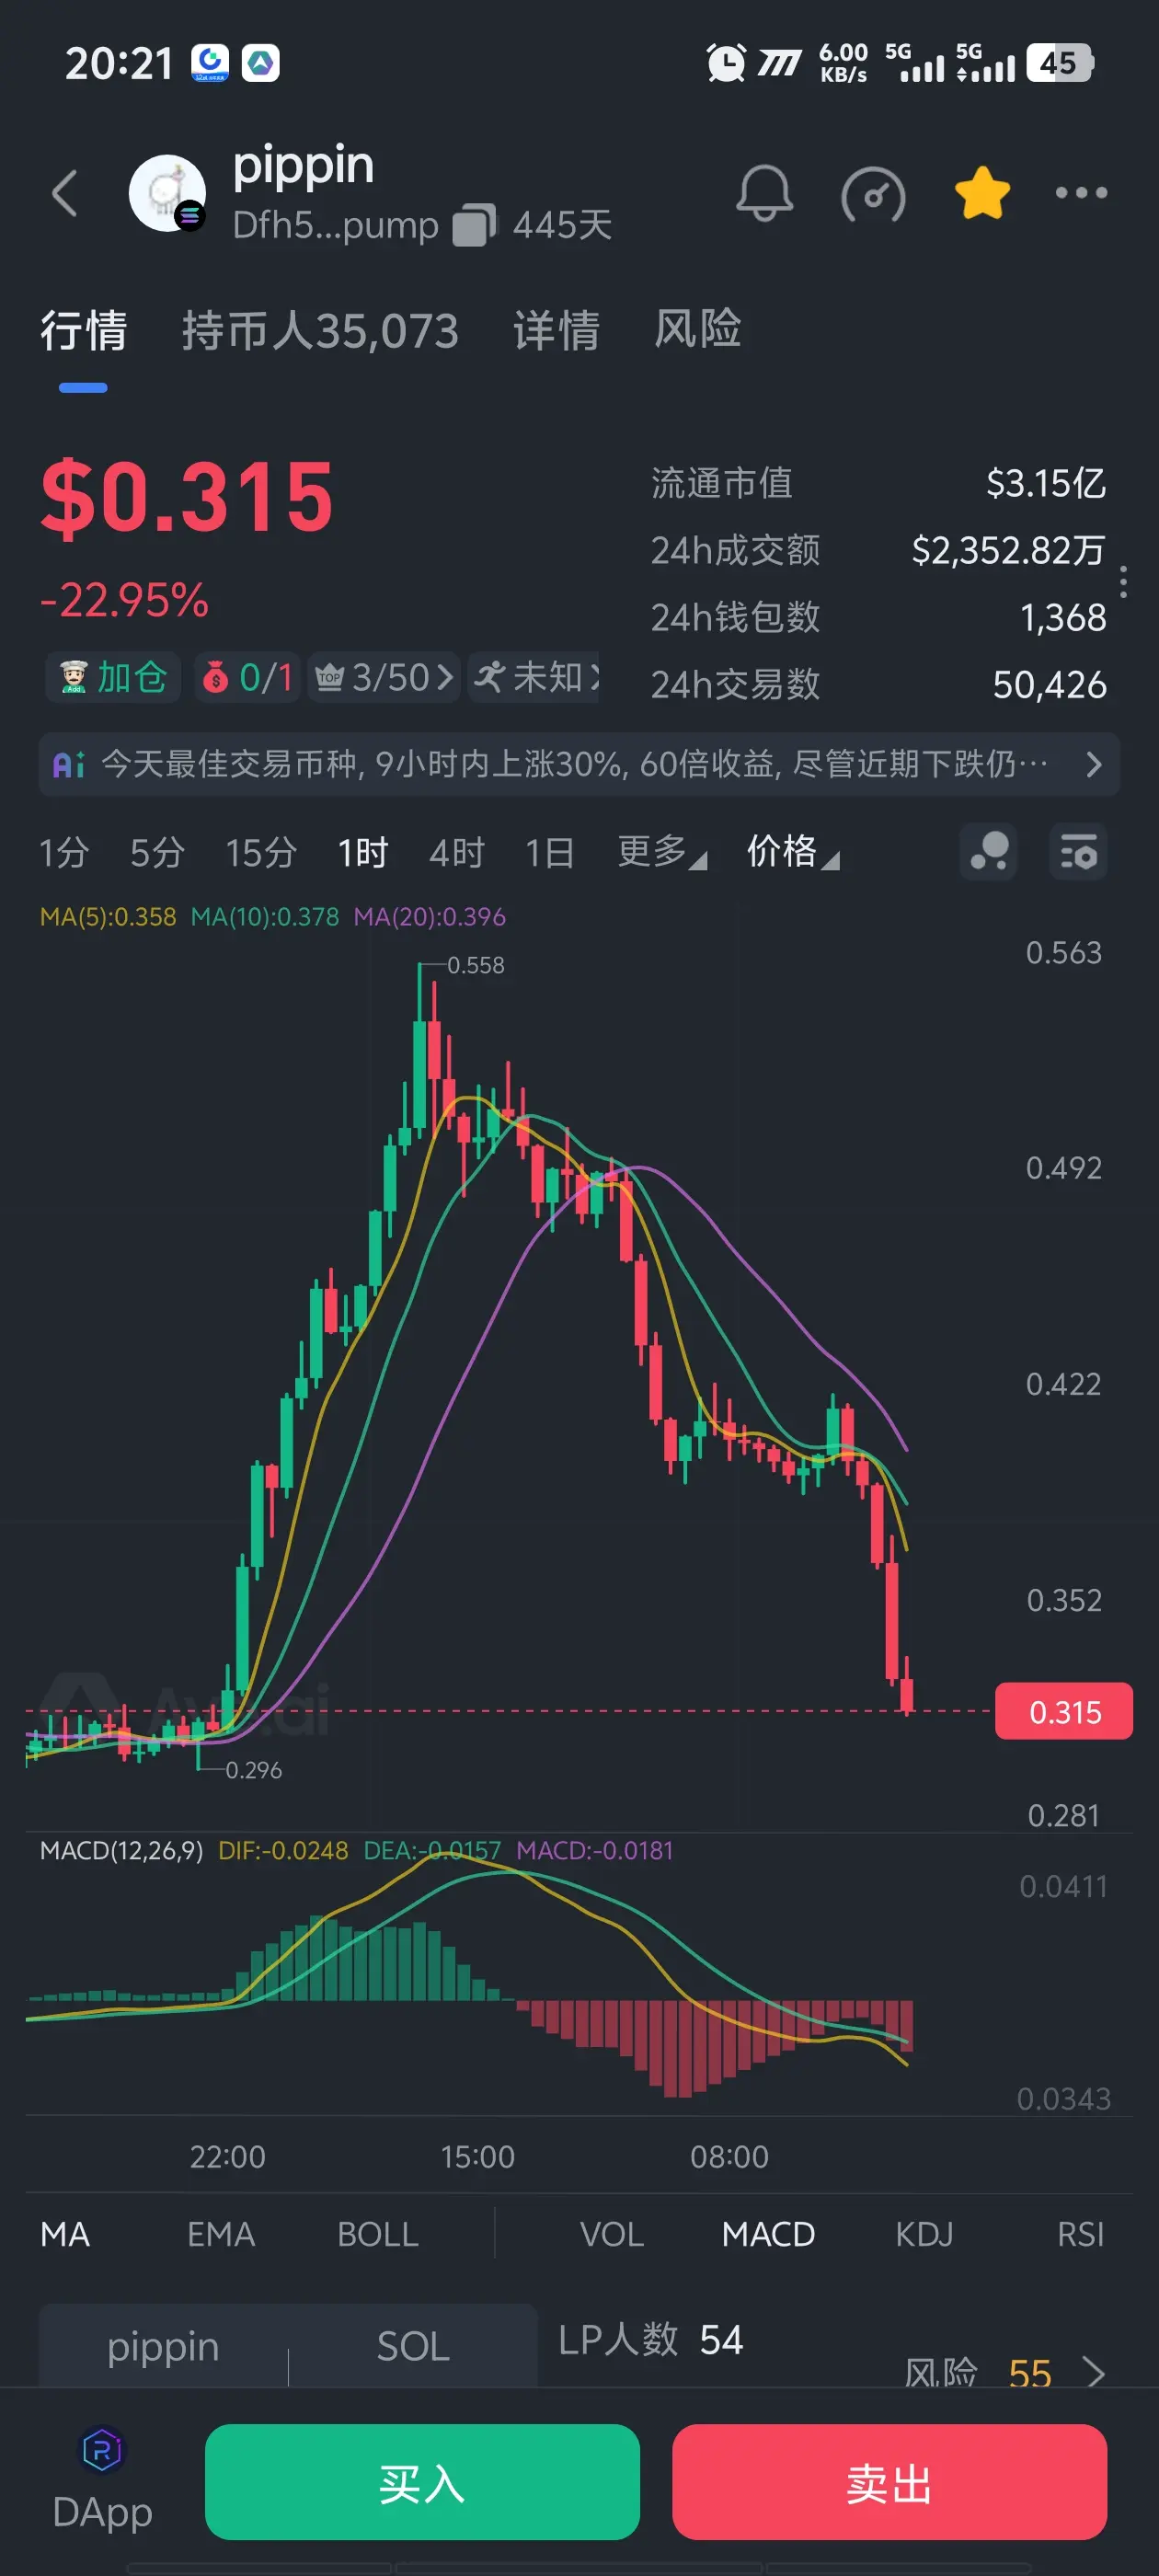
Goodwillnotfailu
#老子 WHEN WILL THIS CHICHIN hit $0.1

- Reward
- like
- Comment
- Repost
- Share

- Reward
- like
- 6
- Repost
- Share
小龙7757:
How much are you trapped in?View More
FKB
扶亏币
Created By@LiXiaoyao
Subscription Progress
0.00%
MC:
$0
Create My Token
What ticker is this? Wrong answers only!
- Reward
- like
- Comment
- Repost
- Share
#AIBT showcases innovative technology, driving the development of blockchain applications! Unlimited potential! Aibt
View Original
- Reward
- like
- Comment
- Repost
- Share
- Reward
- 1
- Comment
- Repost
- Share
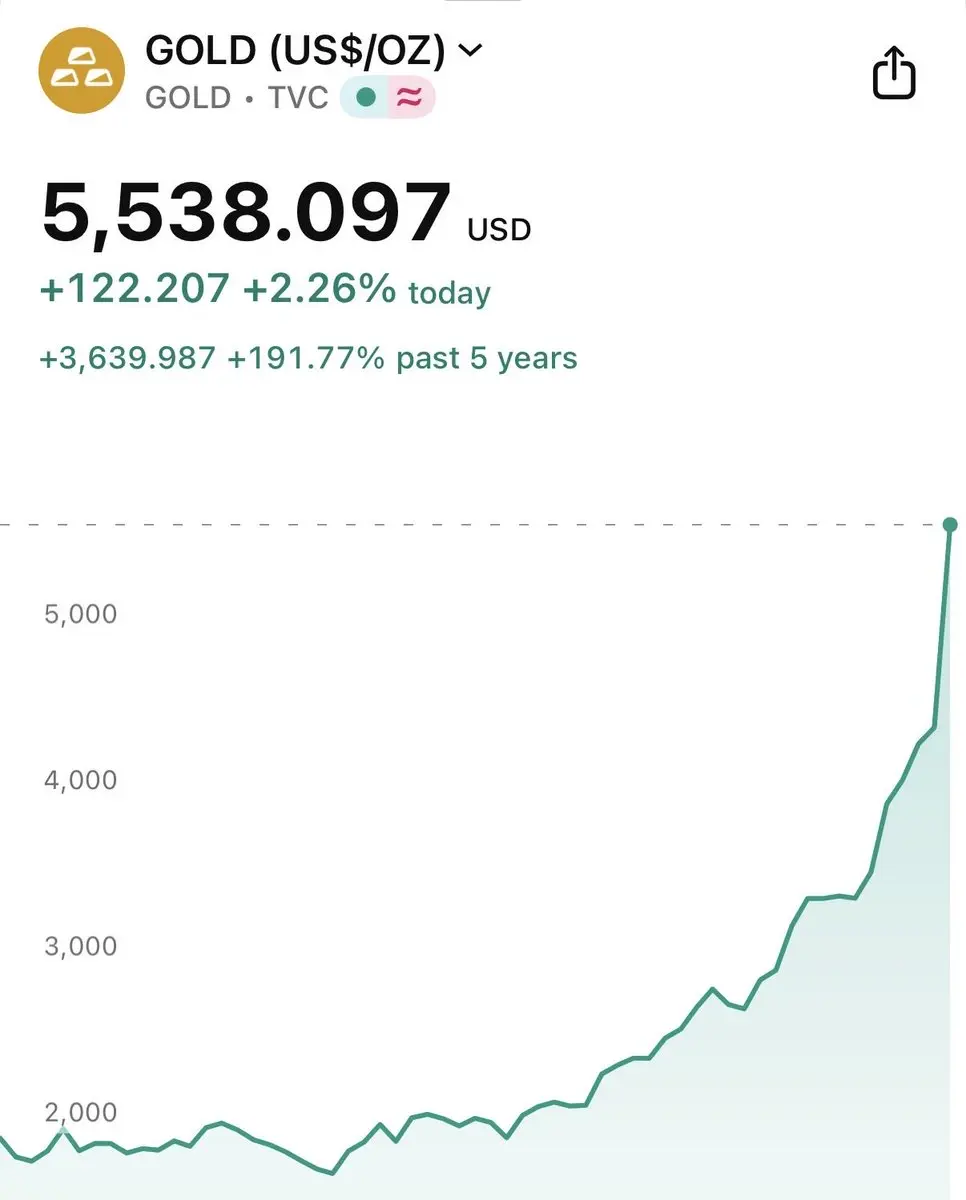
People are saying that Michael Saylor should have just bought gold for the last 5 years instead of Bitcoin. What are your thoughts on this?
BTC-2.24%
- Reward
- like
- Comment
- Repost
- Share
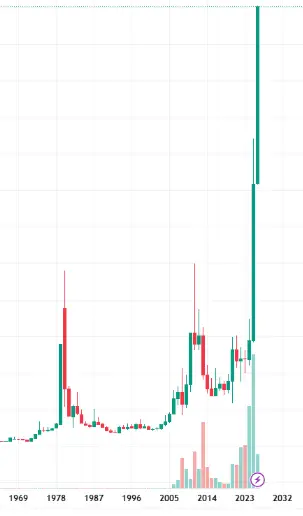
As early as 2018, in the book "The Bitcoin Standard," it clearly explained how the current silver rally would inevitably come to an end. As prices rise, the supply from miners and holders approaches infinity, but Bitcoin is different—miners will never be able to mine more Bitcoin. Investors will eventually realize that the effect of using funds to speculate on gold and silver compared to Bitcoin is a matter of magnitude.
$BTC$GT $ETH
View Original$BTC$GT $ETH
- Reward
- like
- Comment
- Repost
- Share


- Reward
- like
- Comment
- Repost
- Share
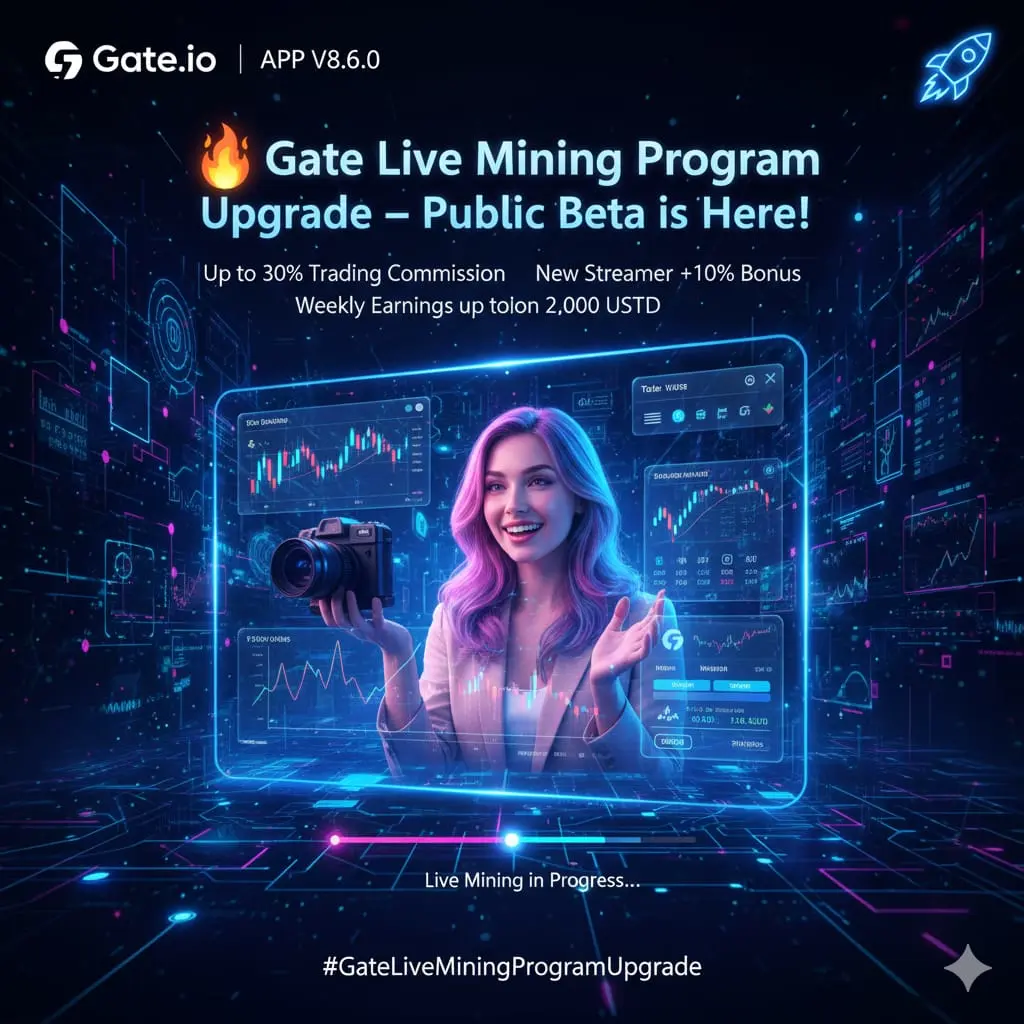
🔥 Gate Live Mining Program Upgrade – Public Beta is Here!
Gate has officially rolled out the Live Mining Program Upgrade with APP V8.6.0, and it’s a total game-changer for streamers and traders alike. With this upgrade, streamer earnings have been significantly boosted, offering up to 30% trading commission, while new streamers receive an extra +10% bonus, making it easier than ever to grow income. On top of that, weekly earnings can reach up to 2,000 USDT, which is massive for active creators.
I personally updated the app to V8.6.0, and my experience has been excellent. The interface feels s
- Reward
- 1
- Comment
- Repost
- Share
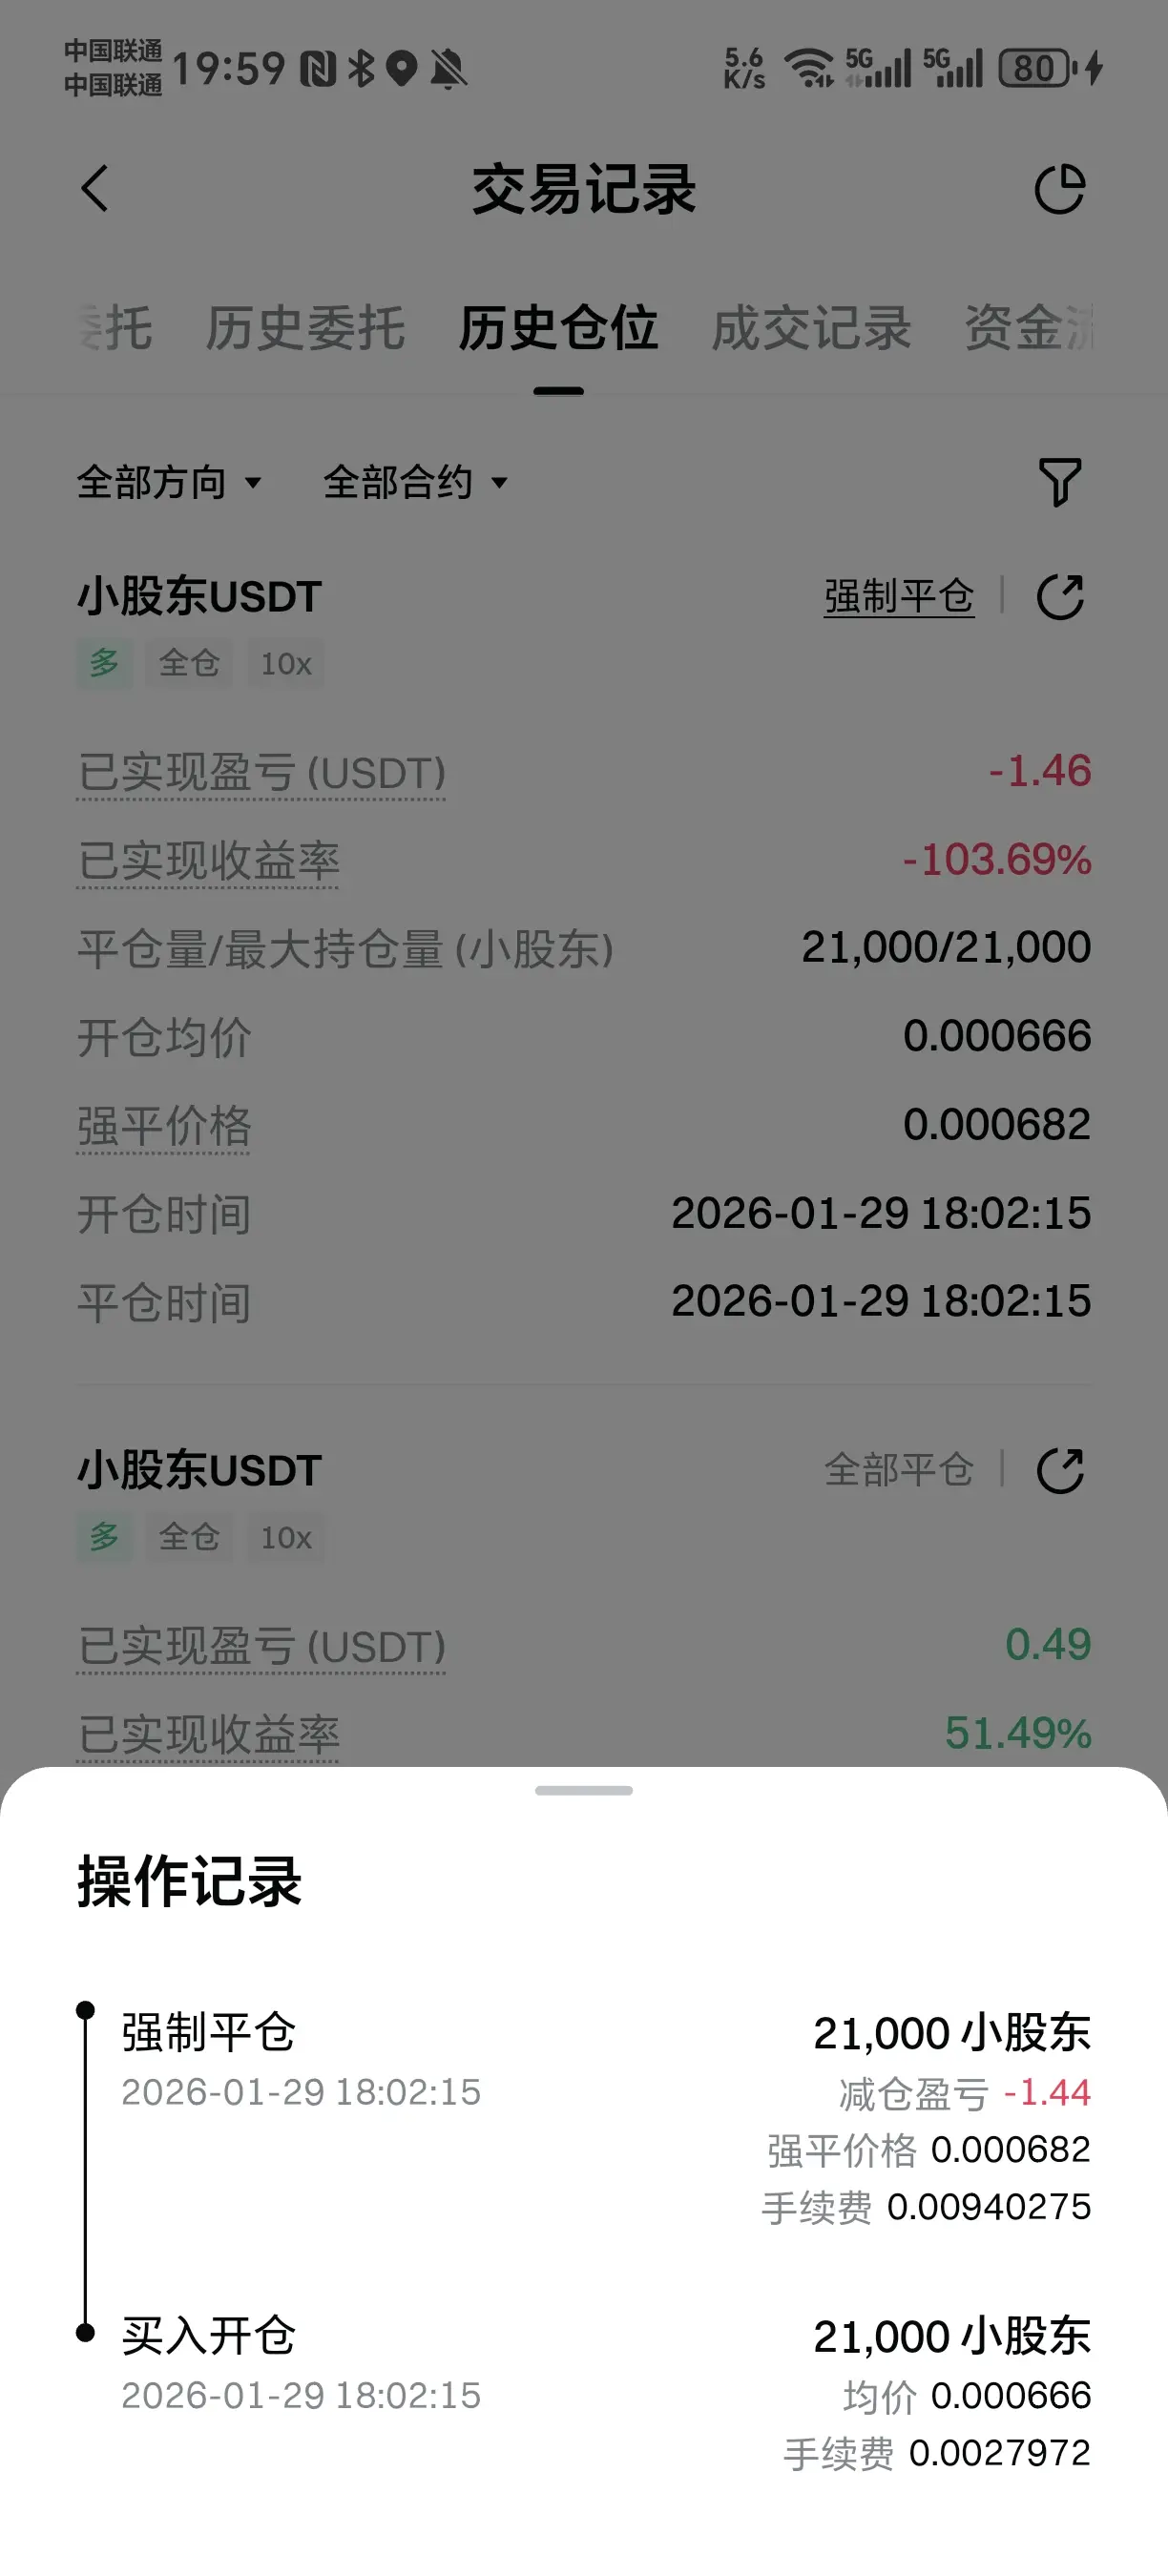
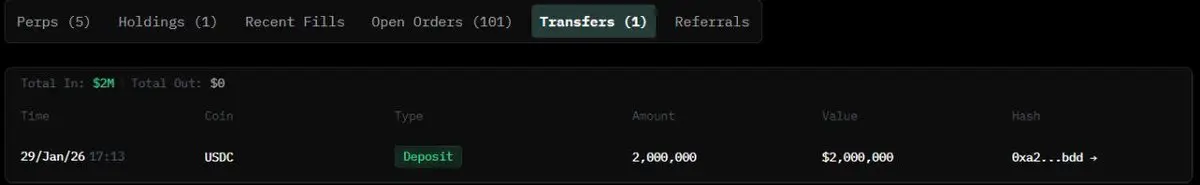
Past year:
Father-in-law's steady big A, return +28%
Little brother-in-law's bottom-fishing in US stocks, return +52%
Wife's gold jewelry investment, return +80%
Me, a seasoned crypto player, full position in altcoins, return -64%
May I ask, for this year's New Year's Eve dinner,
Can I still sit in the main seat and be the first to pick up chopsticks, just like in previous years?🤣🤣🤣
View Original
- Reward
- like
- 1
- Repost
- Share
XiazhuangCoins :
:
This year is different. Who loses more than whom? Who has the say?人民币
全世界人民通用货币
Created By@Million-DollarNetWorth
Listing Progress
0.05%
MC:
$3.4K
Create My Token
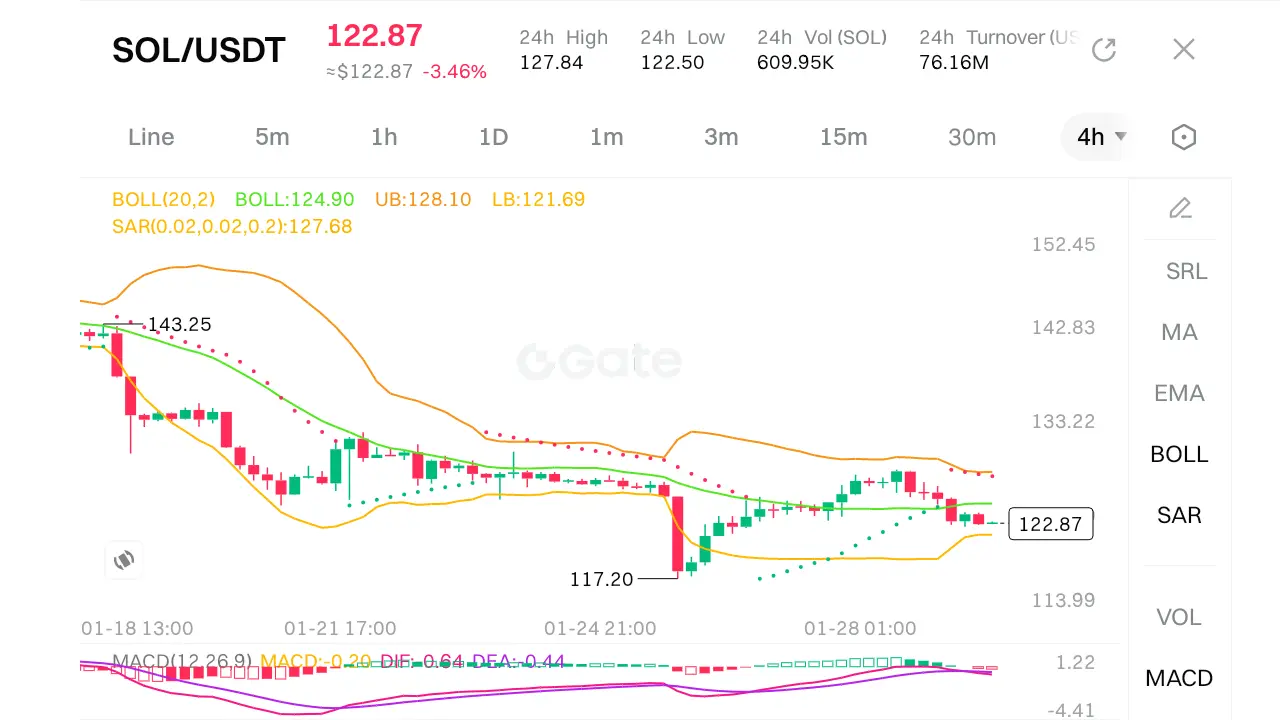
$SOL Here is a structured technical breakdown:
📉 4-Hour Analysis
· Direction:
Downtrend intact. Price is trading below the BOLL middle band, and the SAR dots are above the price, indicating bearish control.
· Liquidity:
Recent low near 122.50 is a short-term liquidity zone. A break below could target 121.10 or lower.
· Supply & Demand:
· Supply zone: 127.84 – 128.35 (resistance)
· Demand zone: 122.50 – 121.84 (support)
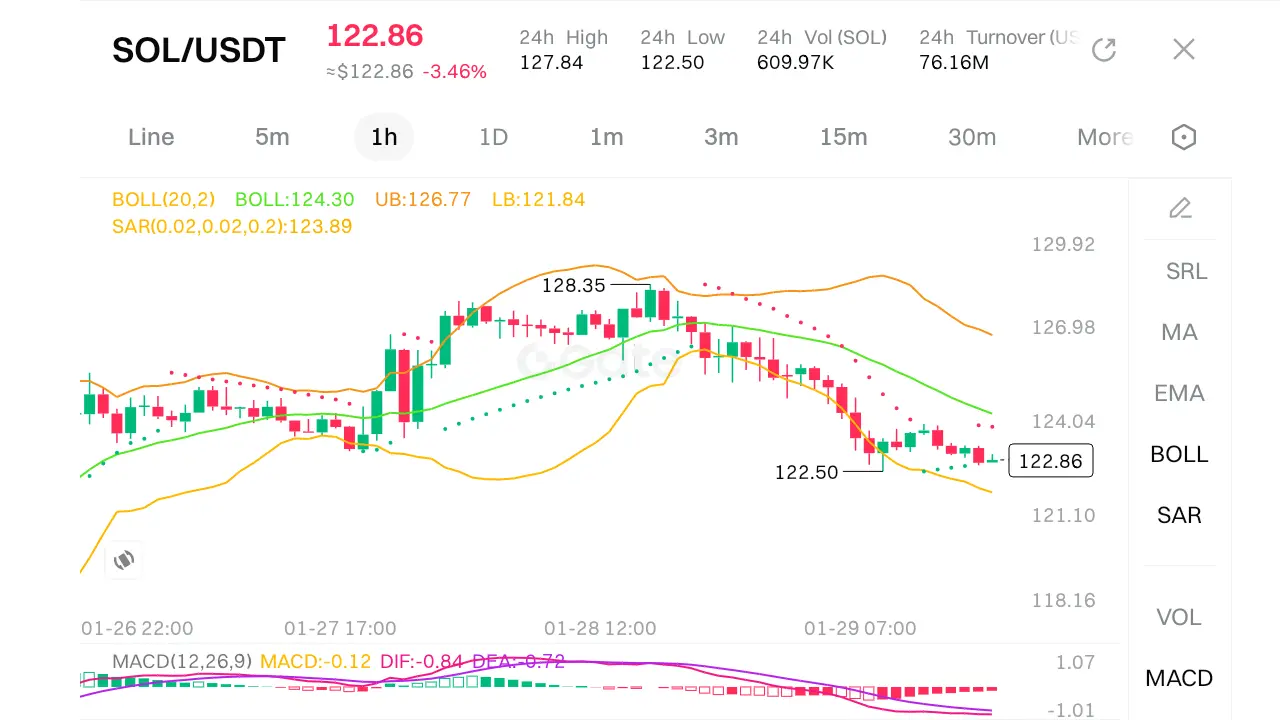
⏳ 1-Hour Analysis
· Trend:
Bearish momentum persists. Price oscillates in the lower half of the BOLL band. MACD is below zero, with negative DIF and DEA.
· Bre
📉 4-Hour Analysis
· Direction:
Downtrend intact. Price is trading below the BOLL middle band, and the SAR dots are above the price, indicating bearish control.
· Liquidity:
Recent low near 122.50 is a short-term liquidity zone. A break below could target 121.10 or lower.
· Supply & Demand:
· Supply zone: 127.84 – 128.35 (resistance)
· Demand zone: 122.50 – 121.84 (support)
⏳ 1-Hour Analysis
· Trend:
Bearish momentum persists. Price oscillates in the lower half of the BOLL band. MACD is below zero, with negative DIF and DEA.
· Bre
SOL-3.13%
- Reward
- 1
- Comment
- Repost
- Share
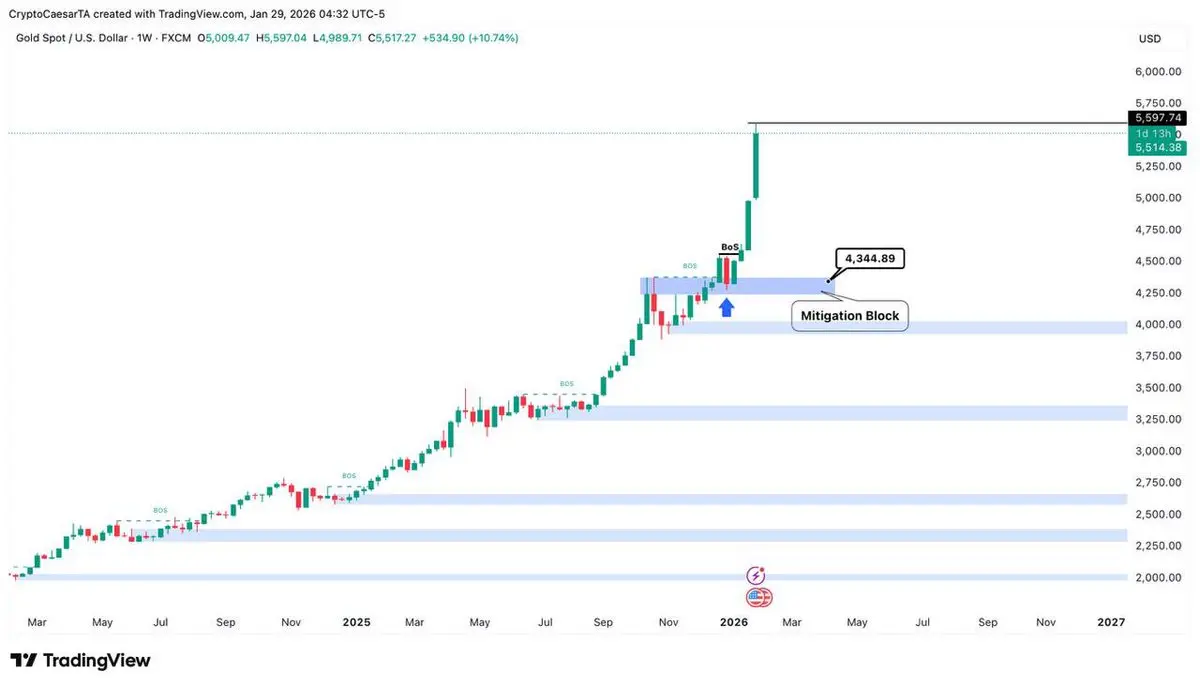
$Gold, one word: insane.
- Reward
- like
- Comment
- Repost
- Share
Fallen to a ghost, have a drink, everything is in your dreams😭
View Original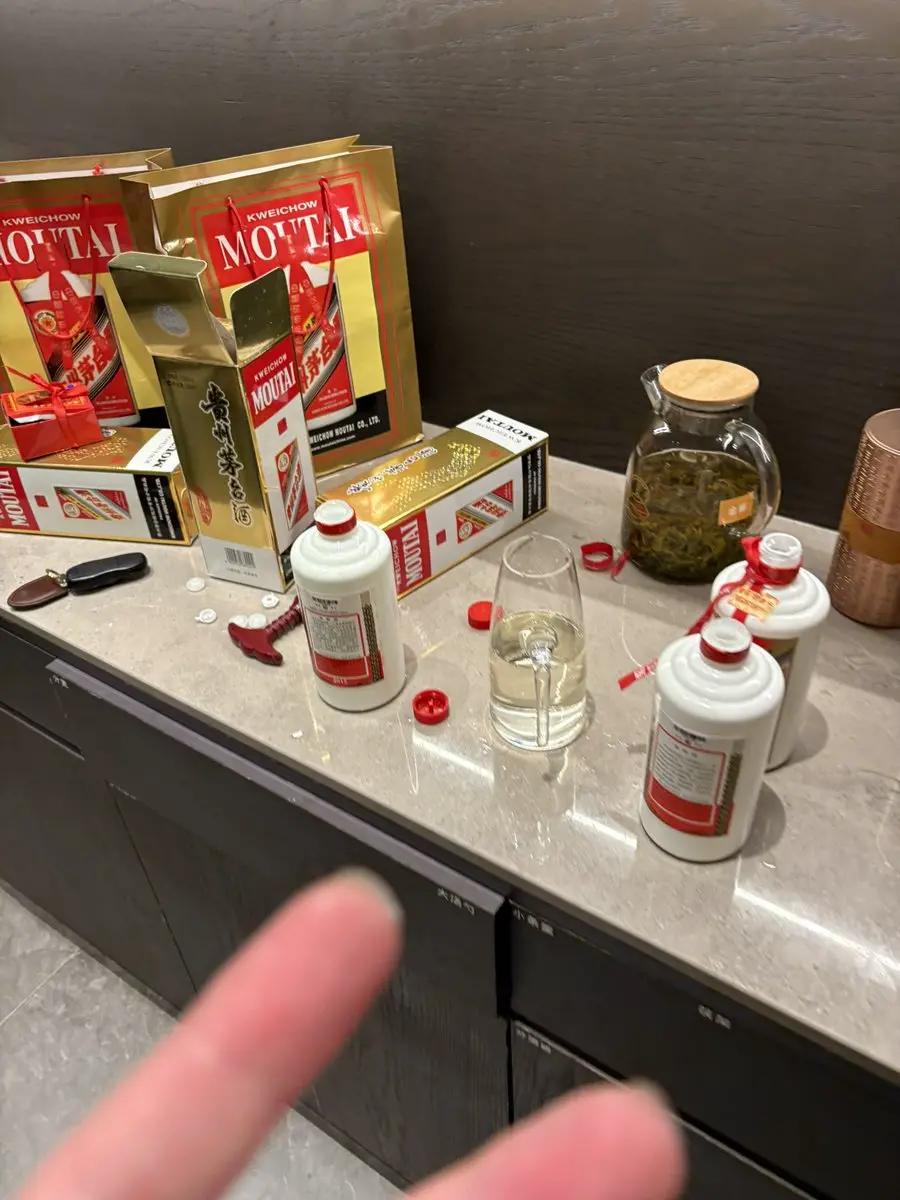

- Reward
- like
- Comment
- Repost
- Share
Bitcoin Stagnates While Options Remain Dead According to Jeff Park - #cryptocurrency #bitcoin #altcoins
BTC-2.24%

- Reward
- like
- Comment
- Repost
- Share
#BTCUSD Do you remember the 91333 central pivot? Only delayed love can turn time into the strongest wine. It’s not love at first sight like fireworks, but countless near misses, countless missed opportunities, countless times twisting the heart into a braid and then forcibly flattening it, still willing to take a step closer to you with bloodshot eyes and old wounds—clumsy. It’s coming, within the next 4-24 hours! We have been waiting for this moment!
View Original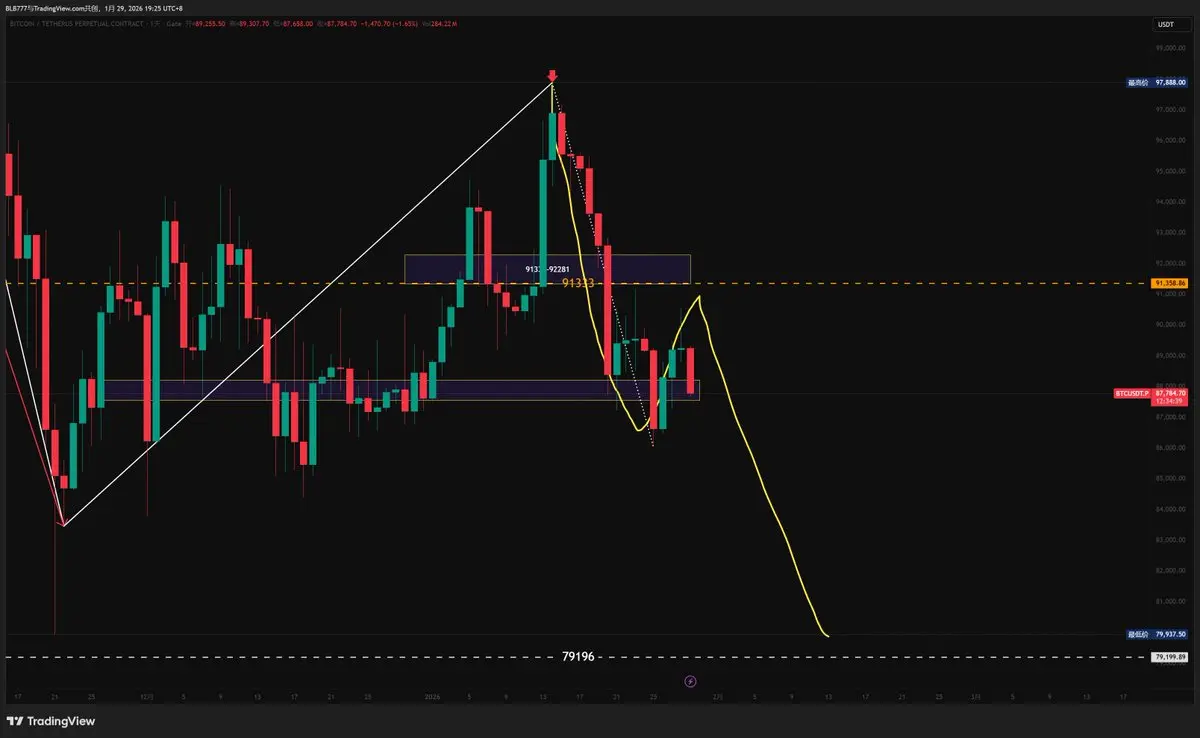
- Reward
- like
- 3
- Repost
- Share
ABookOfTangles:
You don't understand! Empty it out now.View More
Load More
Join 40M users in our growing community
⚡️ Join 40M users in the crypto craze discussion
💬 Engage with your favorite top creators
👍 See what interests you
Trending Topics
View More4.57K Popularity
4.84K Popularity
3.45K Popularity
2K Popularity
39.35K Popularity
Hot Gate Fun
View More- MC:$0.1Holders:10.00%
- MC:$3.36KHolders:10.00%
- MC:$3.36KHolders:10.00%
- MC:$3.35KHolders:10.00%
- MC:$3.35KHolders:10.00%
News
View MoreNasdaq 100 Index futures give back gains, now roughly flat
1 m
Data: 43.56 BTC transferred out from Jump Crypto, worth approximately $3.83 million
2 m
US-listed company DDC Enterprise increases holdings by 100 Bitcoins, with a total holding of 1,783 Bitcoins
10 m
ALT5 Sigma Company announces that the board of directors has approved a strategic acquisition of more WLFI tokens on the open market
17 m
ByteDance and Alibaba will launch new artificial intelligence models in mid-February
18 m
Pin
Gate Square New & Returning Creator Rewards are ongoing!
Your ideas may be more valuable than you think!
Make your first post or come back post to share a $20,000 monthly prize pool!
Post with #MyFirstPostOnSquare to receive a $50 Position Voucher each
Monthly Top Posters and Top Engagers will each earn an extra $50 reward
Your crypto insights could inspire many—start creating today!
👉 https://www.gate.com/postGate Square “Creator Certification Incentive Program” — Recruiting Outstanding Creators!
Join now, share quality content, and compete for over $10,000 in monthly rewards.
How to Apply:
1️⃣ Open the App → Tap [Square] at the bottom → Click your [avatar] in the top right.
2️⃣ Tap [Get Certified], submit your application, and wait for approval.
Apply Now: https://www.gate.com/questionnaire/7159
Token rewards, exclusive Gate merch, and traffic exposure await you!
Details: https://www.gate.com/announcements/article/47889