Trade
Basic
Futures
Futures
Hundreds of contracts settled in USDT or BTC
Options
HOT
Trade European-style vanilla options
Unified Account
Maximize your capital efficiency
Demo Trading
Futures Kickoff
Get prepared for your futures trading
Futures Events
Participate in events to win generous rewards
Demo Trading
Use virtual funds to experience risk-free trading
Earn
Launch
CandyDrop
Collect candies to earn airdrops
Launchpool
Quick staking, earn potential new tokens
HODLer Airdrop
Hold GT and get massive airdrops for free
Launchpad
Be early to the next big token project
Alpha Points
NEW
Trade on-chain assets and enjoy airdrop rewards!
Futures Points
NEW
Earn futures points and claim airdrop rewards
Investment
Simple Earn
Earn interests with idle tokens
Auto-Invest
Auto-invest on a regular basis
Dual Investment
Buy low and sell high to take profits from price fluctuations
Soft Staking
Earn rewards with flexible staking
Crypto Loan
0 Fees
Pledge one crypto to borrow another
Lending Center
One-stop lending hub
VIP Wealth Hub
Customized wealth management empowers your assets growth
Private Wealth Management
Customized asset management to grow your digital assets
Quant Fund
Top asset management team helps you profit without hassle
Staking
Stake cryptos to earn in PoS products
Smart Leverage
NEW
No forced liquidation before maturity, worry-free leveraged gains
GUSD Minting
Use USDT/USDC to mint GUSD for treasury-level yields
More
TheOtherSide
- Reward
- 1
- Comment
- Repost
- Share
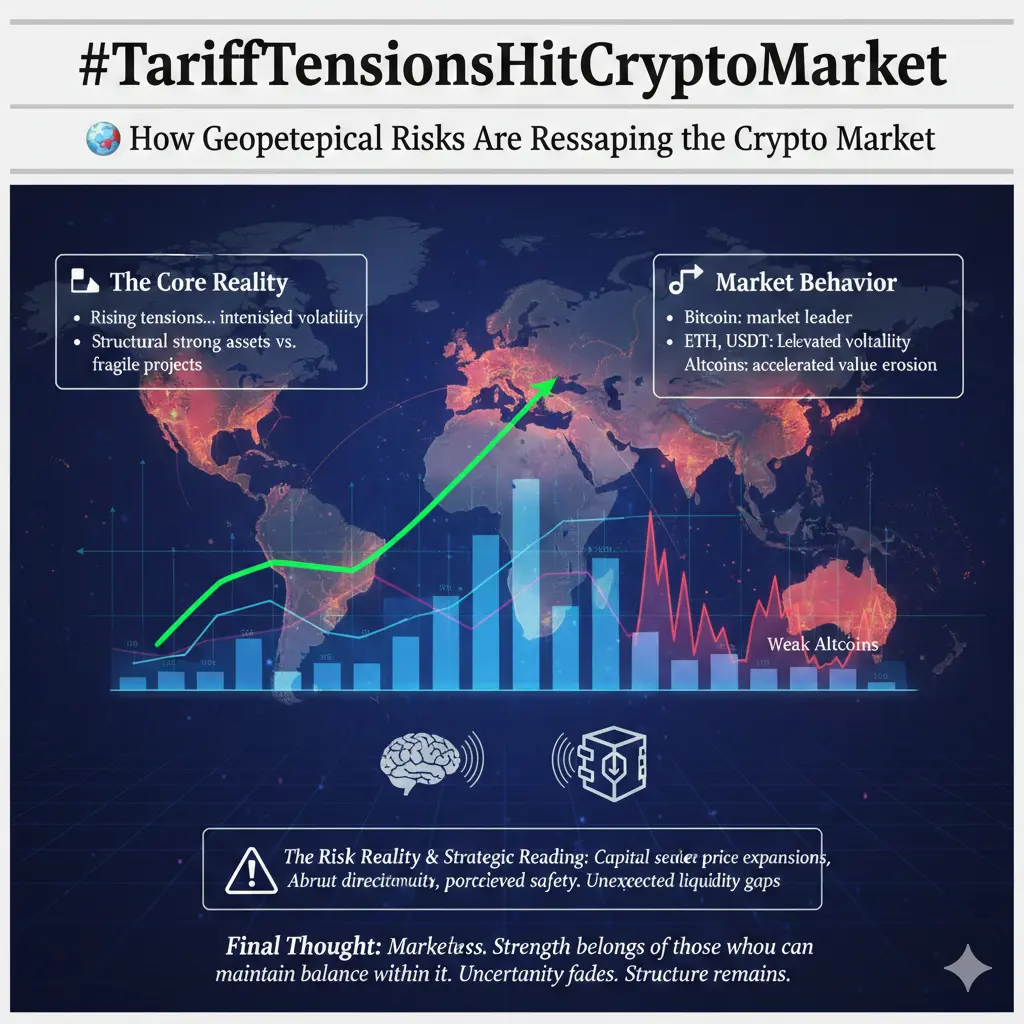
#TariffTensionsHitCryptoMarket Geopolitical Risks and Crypto Market Dynamics
Geopolitical tensions are no longer just headlines — they actively reshape global capital flows, investor behavior, and market structure. In 2026, crypto markets are reflecting this reality more clearly than ever: during periods of uncertainty, resilience and structure outweigh speed and speculation.
📊 The Macro Reality
Escalating tensions in the Middle East, combined with lingering effects of the Ukraine–Russia conflict, are producing elevated volatility across digital assets. Investors are reassessing risk exposure


- Reward
- 3
- 4
- Repost
- Share
Discovery :
:
Buy To Earn 💎View More
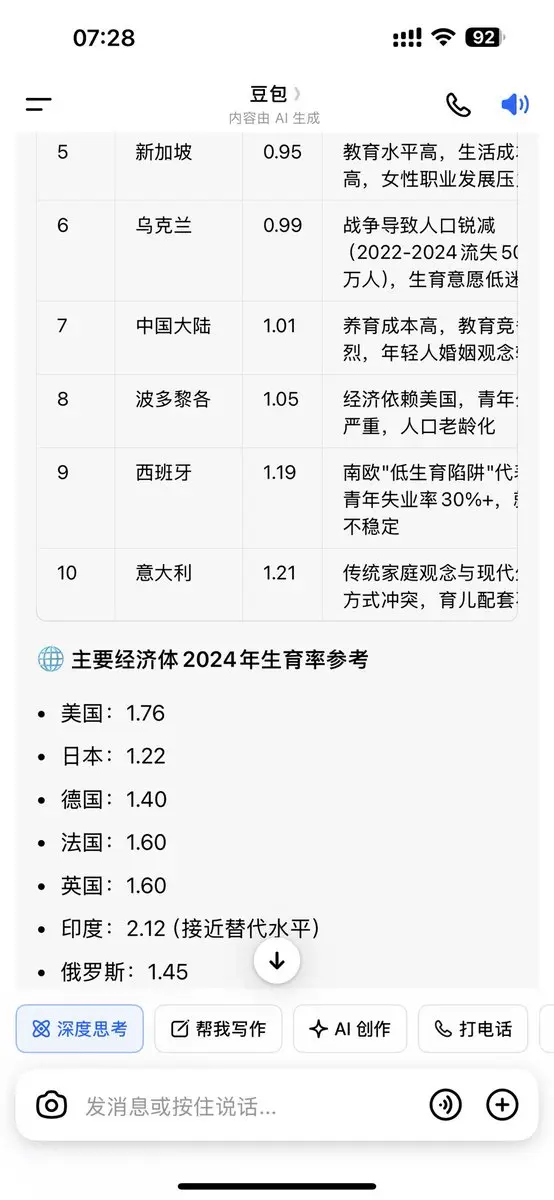
There is a saying that low marriage and fertility rates are due to longer education times, but I checked, and Singapore, with shorter education times, has a lower fertility rate.\n\nLow marriage and fertility rates are fundamentally issues related to the social development process.\n\nThe baby booms of the 60s and 80s were mainly influenced by the agricultural society's preference for larger families in the 60s.\nIn some coastal areas, fishermen often fought, so these areas preferred boys.\nAt that time, during the early years of the founding of the country, all industries were just starting,
View Original
- Reward
- like
- Comment
- Repost
- Share
绿油油的韭菜
韭菜
Created By@CongratulationsAndProsperityW
Subscription Progress
0.00%
MC:
$0
Create My Token
- Reward
- 1
- Comment
- Repost
- Share


- Reward
- 2
- Comment
- Repost
- Share
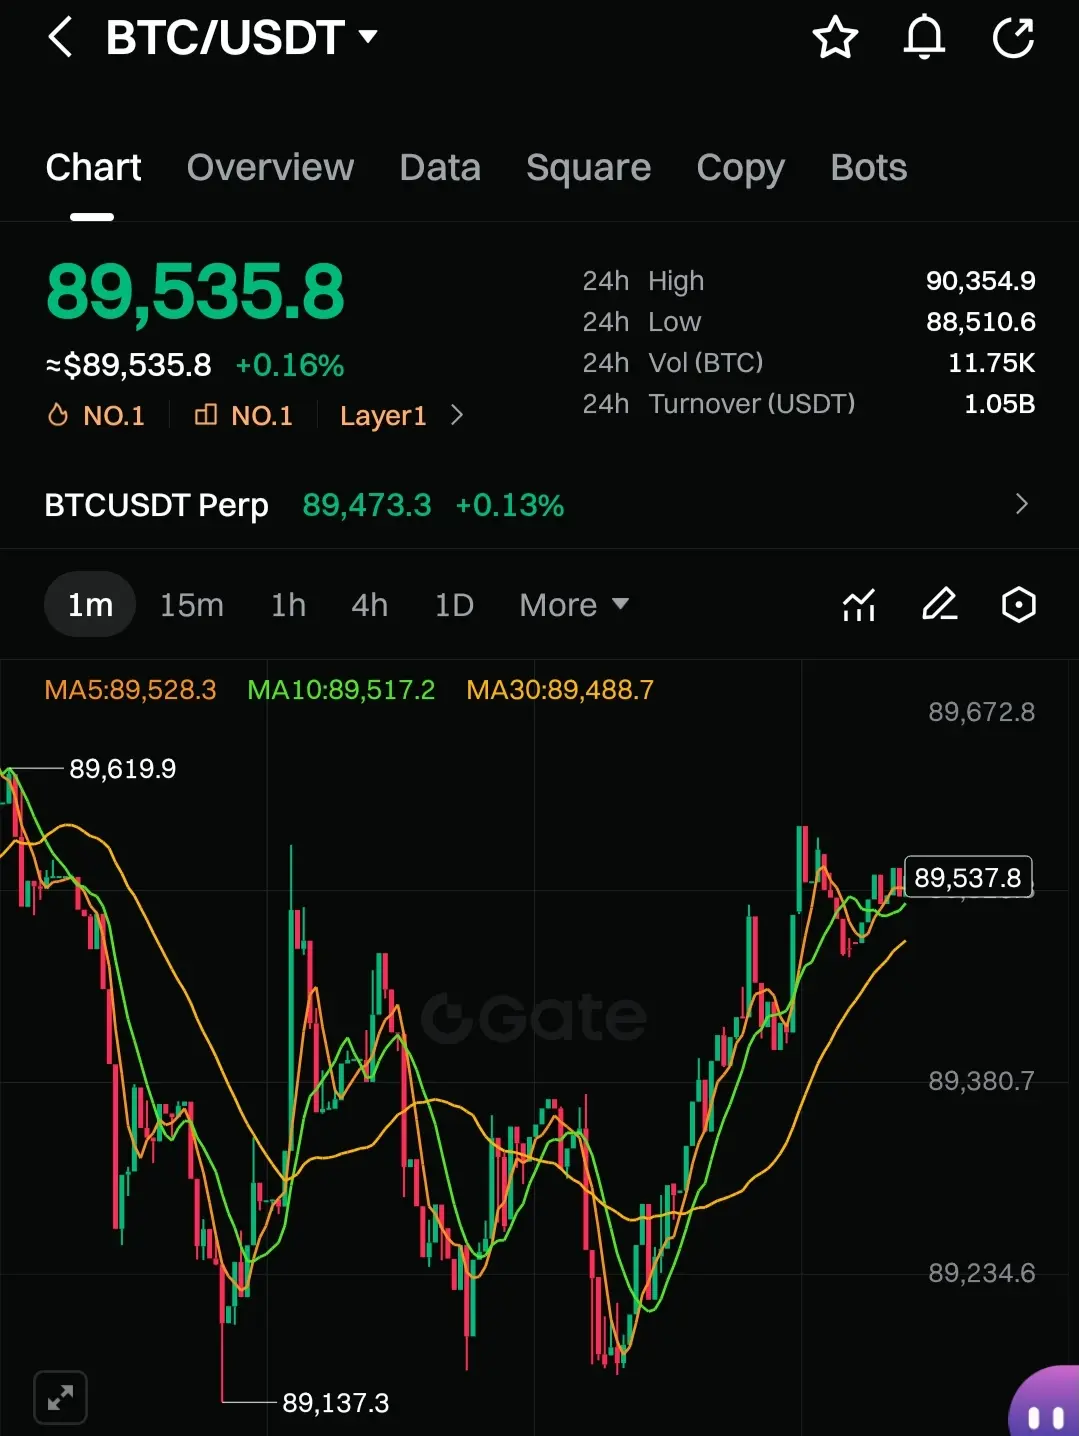
$BTC at $89,535.8, trending up +0.16%. If it bounces off $88,510.6 support, we might see a push to $90,000–$90,500. But if it breaks below $88,510.6, could drop to $88,000–$88,300. 24h volume is 1.05B USDT, what's driving the move? #BTC #Rmj-Trades
BTC-0,41%
- Reward
- 1
- 1
- Repost
- Share
RoadsideStone:
goooooooooooooooooooooood1.23 Gold Morning Trading Ideas
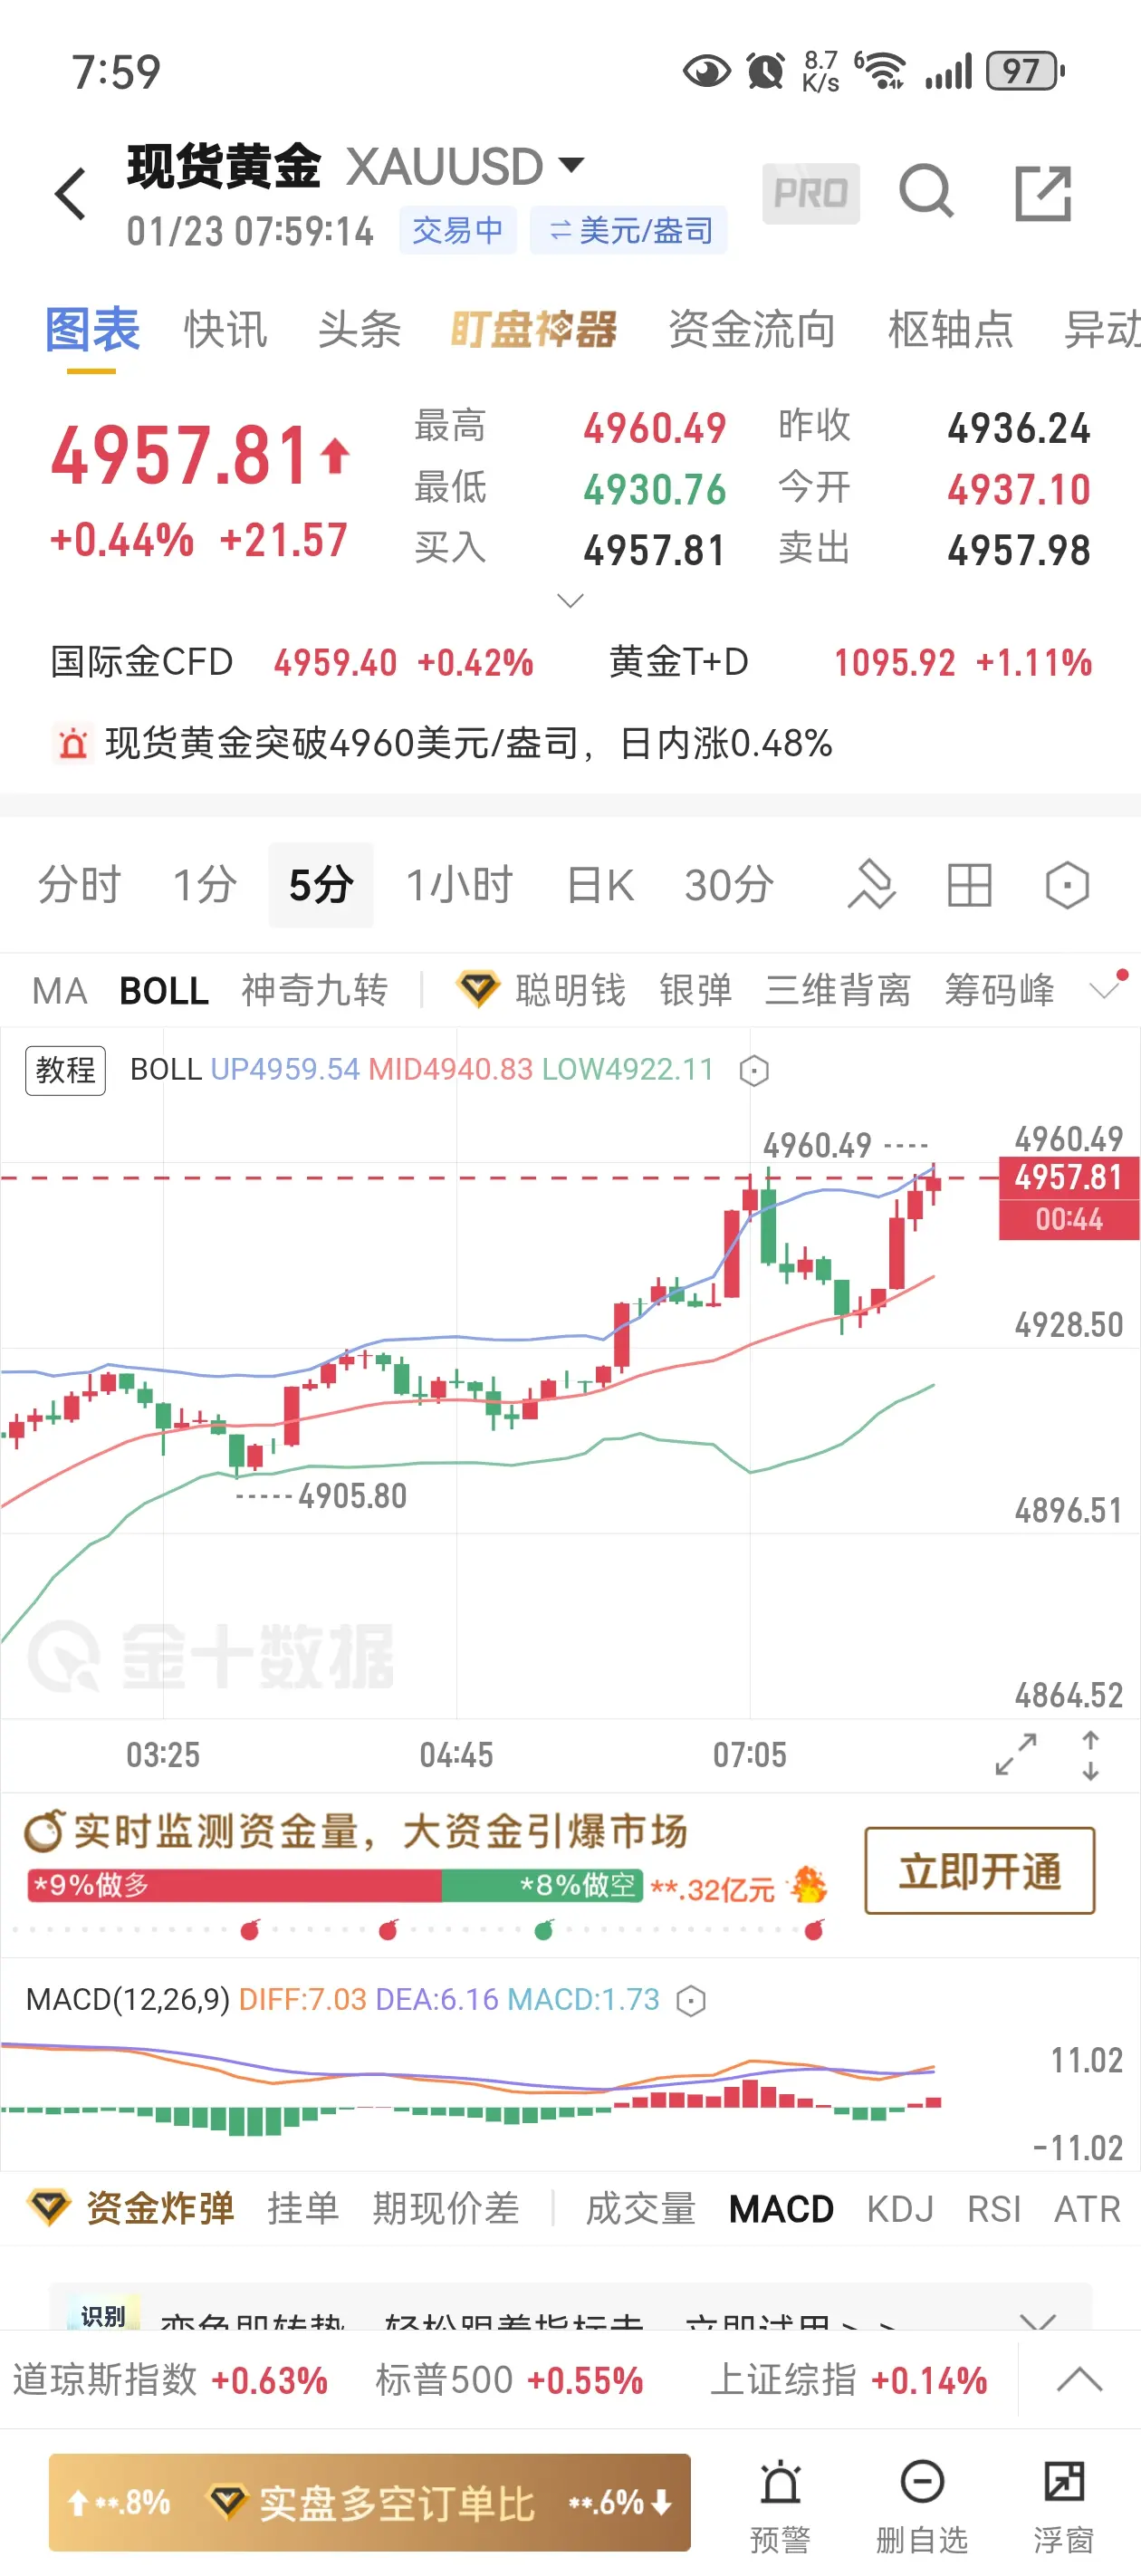
This morning, gold bulls launched a full-scale attack, showing strong momentum! After a brief pullback on the hourly chart, prices surged overnight, breaking through the key 4900 level, reaching as high as 4940. Market bullish sentiment is fully unleashed, and the current trend is clearly bullish. Do not blindly open short positions. If the price unexpectedly breaks below the 4890 support, it is recommended to wait and observe, then look for a suitable entry once the trend clarifies.
✅ Long positions: Enter once the 4910-4920 range stabilizes, with stop-loss bel
View OriginalThis morning, gold bulls launched a full-scale attack, showing strong momentum! After a brief pullback on the hourly chart, prices surged overnight, breaking through the key 4900 level, reaching as high as 4940. Market bullish sentiment is fully unleashed, and the current trend is clearly bullish. Do not blindly open short positions. If the price unexpectedly breaks below the 4890 support, it is recommended to wait and observe, then look for a suitable entry once the trend clarifies.
✅ Long positions: Enter once the 4910-4920 range stabilizes, with stop-loss bel
- Reward
- like
- Comment
- Repost
- Share
Four-hour level: After the price continuously closes lower and tests the support level, it shifts to a narrow range consolidation at a low position, and the trend enters a phase of staged accumulation. The upper and lower bands of the Bollinger Bands gradually contract, indicating that the short-term bullish and bearish momentum are tending to balance. Once the consolidation is complete, a new round of directional momentum will be released.
One-hour chart: After quickly probing below the lower Bollinger Band, the price continuously recovers with bullish candles. The long upper and lower shadow
View OriginalOne-hour chart: After quickly probing below the lower Bollinger Band, the price continuously recovers with bullish candles. The long upper and lower shadow
- Reward
- like
- Comment
- Repost
- Share
Become the richest person by buying the richest person🚀🚀🚀🚀
View Original
MC:$23.57KHolders:127
60.48%
- Reward
- like
- Comment
- Repost
- Share
Market Analysis for January 23
Four-Hour Level
$BTC : After a continuous decline testing the support level, the price entered a narrow range consolidation at low levels, showing a phased buildup; Bollinger Bands are narrowing, indicating balanced short-term bullish and bearish momentum. The consolidation phase will soon lead to a directional breakout.
$ETH : Simultaneous oscillation with narrowing Bollinger Bands, price hovering around key support levels, bearish momentum gradually weakening. Overall, following BTC for a breakout, with long shadows indicating intense bullish and bearish battle
View OriginalFour-Hour Level
$BTC : After a continuous decline testing the support level, the price entered a narrow range consolidation at low levels, showing a phased buildup; Bollinger Bands are narrowing, indicating balanced short-term bullish and bearish momentum. The consolidation phase will soon lead to a directional breakout.
$ETH : Simultaneous oscillation with narrowing Bollinger Bands, price hovering around key support levels, bearish momentum gradually weakening. Overall, following BTC for a breakout, with long shadows indicating intense bullish and bearish battle


- Reward
- like
- Comment
- Repost
- Share
$RIVER has been successfully kicked off the bus!!! You did it!
View Original
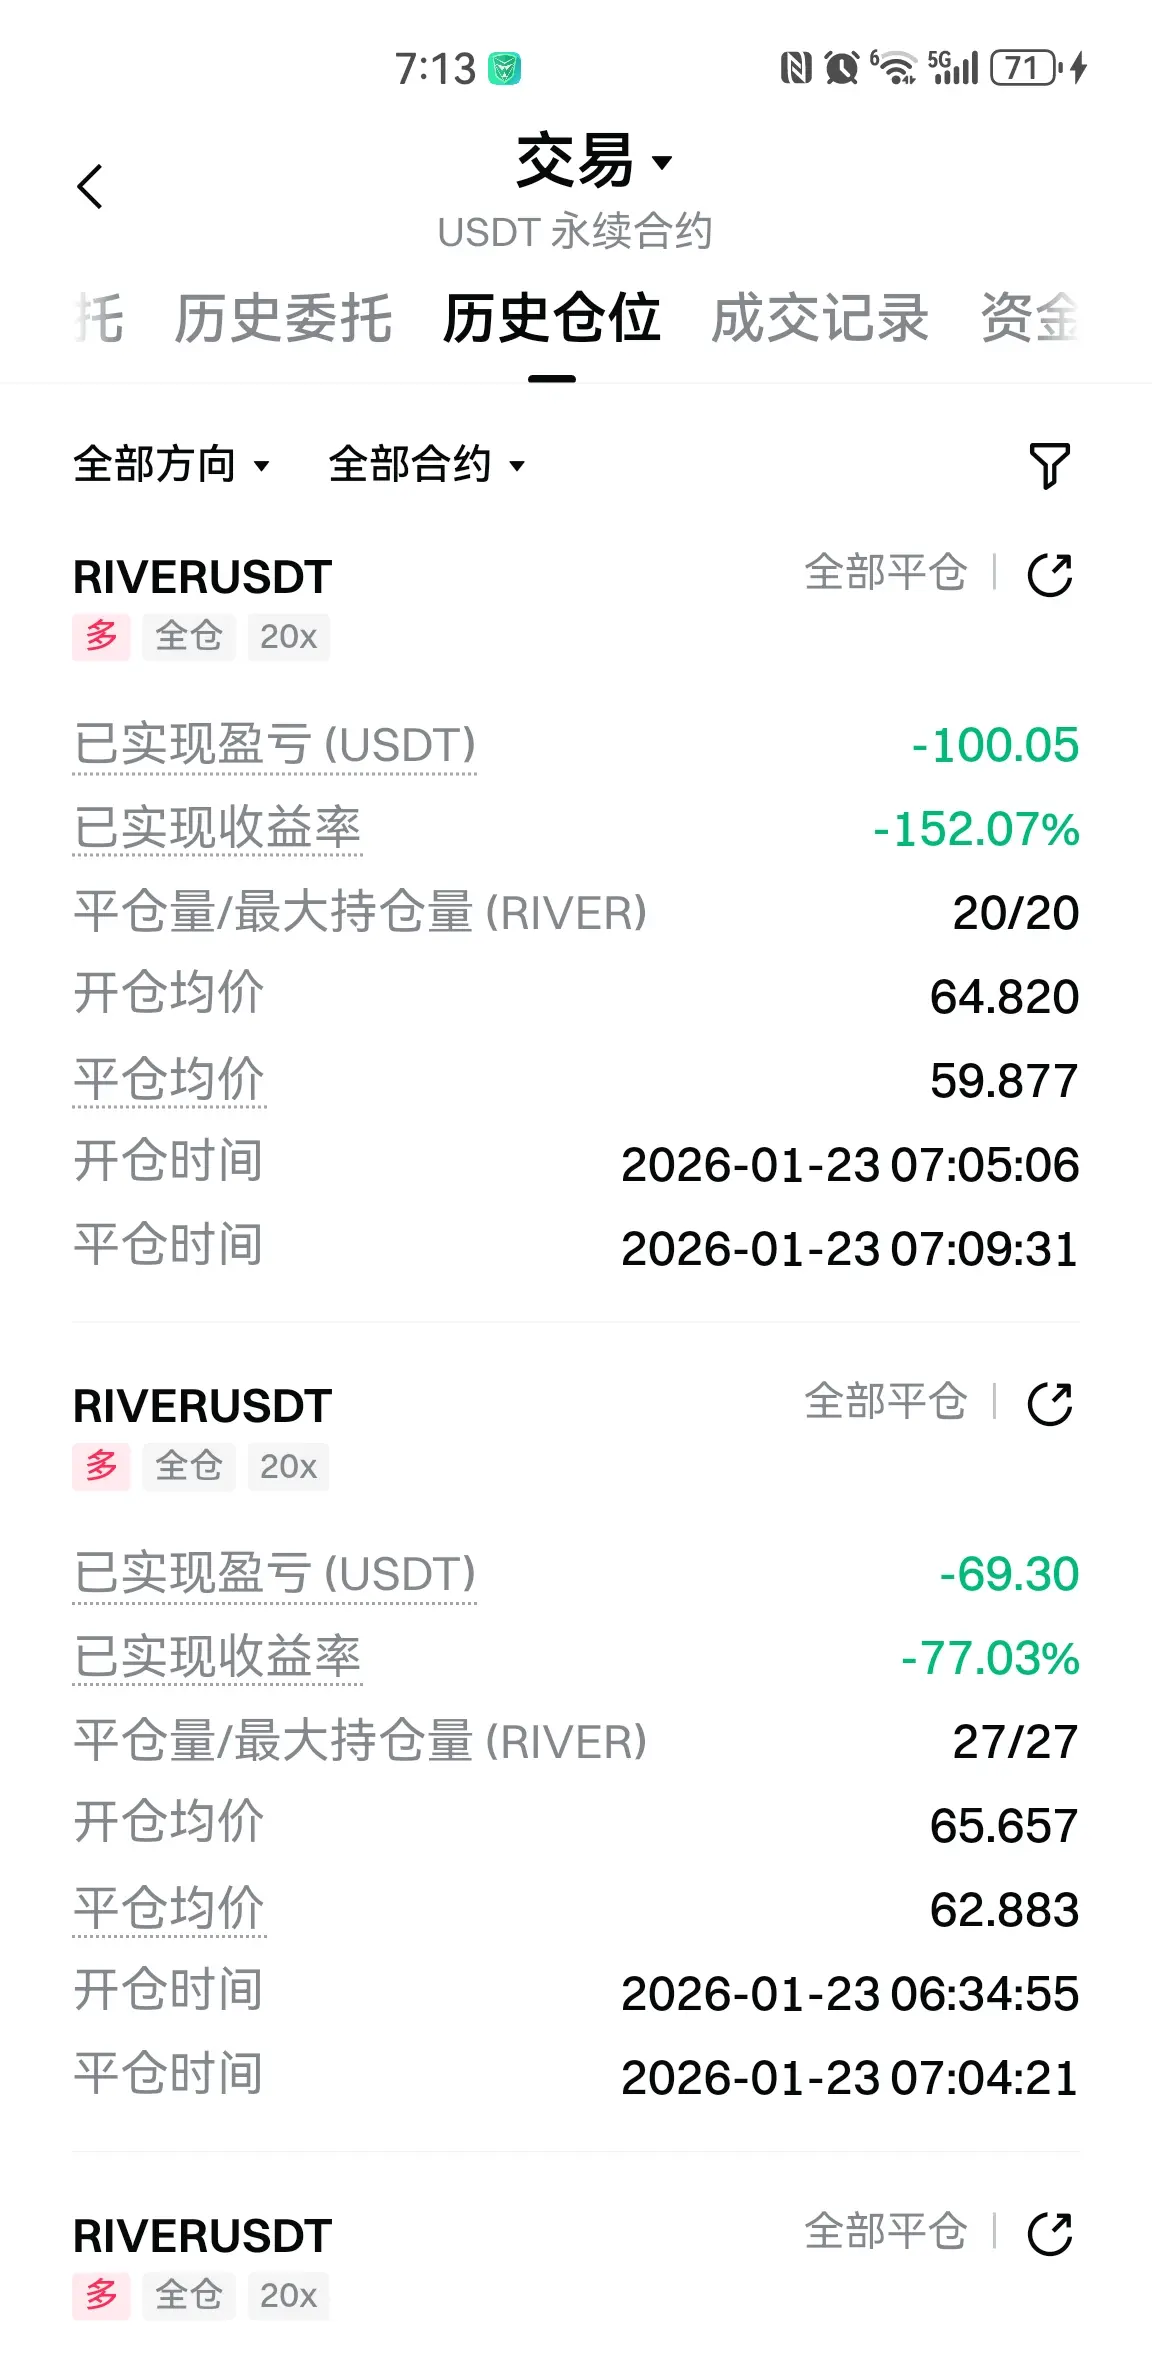
[The user has shared his/her trading data. Go to the App to view more.]
- Reward
- like
- 5
- Repost
- Share
PeerlessWizards :
:
You can go long at 57, and run at 63.View More
#FB $FB prices are only temporary; without low prices, there would be no lower cost basis for building positions. Those high-quality assets have all gone through a period of downturn, but that doesn't matter. Looking around, how many truly public chains are there?
FB has huge potential!
FB has huge potential!
FB-0,91%


- Reward
- like
- Comment
- Repost
- Share
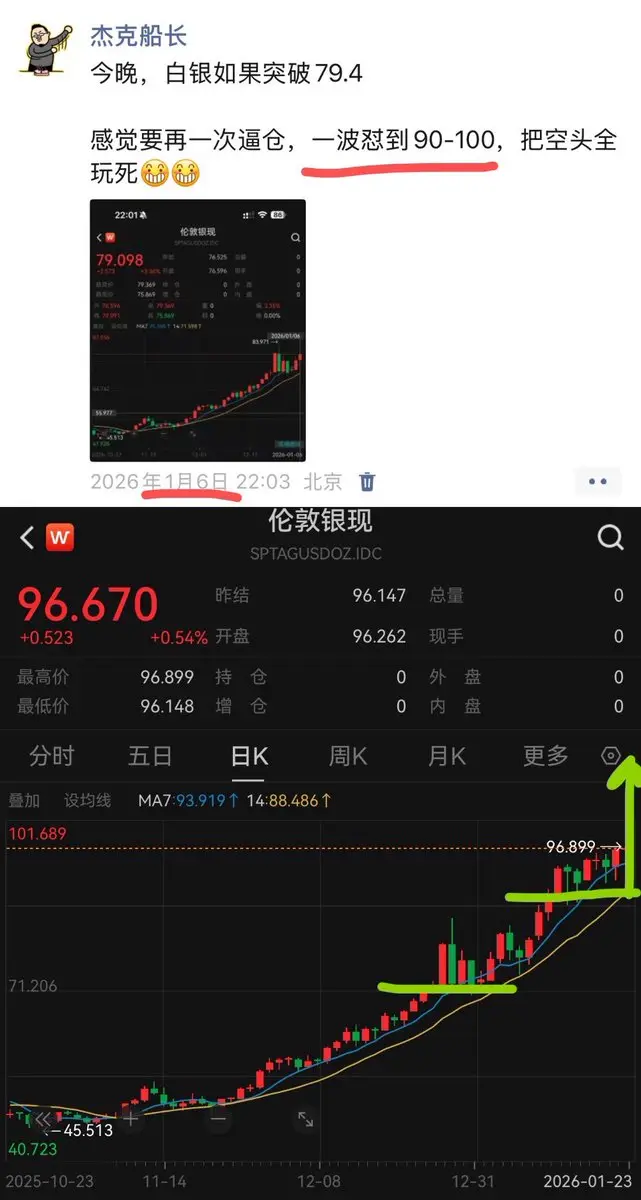
Silver 79, I see 90-100, now 97
79 is bearish on silver, likely to be a rookie
When I get old, I will sell him health supplements😁
View Original79 is bearish on silver, likely to be a rookie
When I get old, I will sell him health supplements😁
- Reward
- like
- Comment
- Repost
- Share
HIB
HIBA
Created By@GateUser-ba7c4c69
Subscription Progress
0.00%
MC:
$0
Create My Token
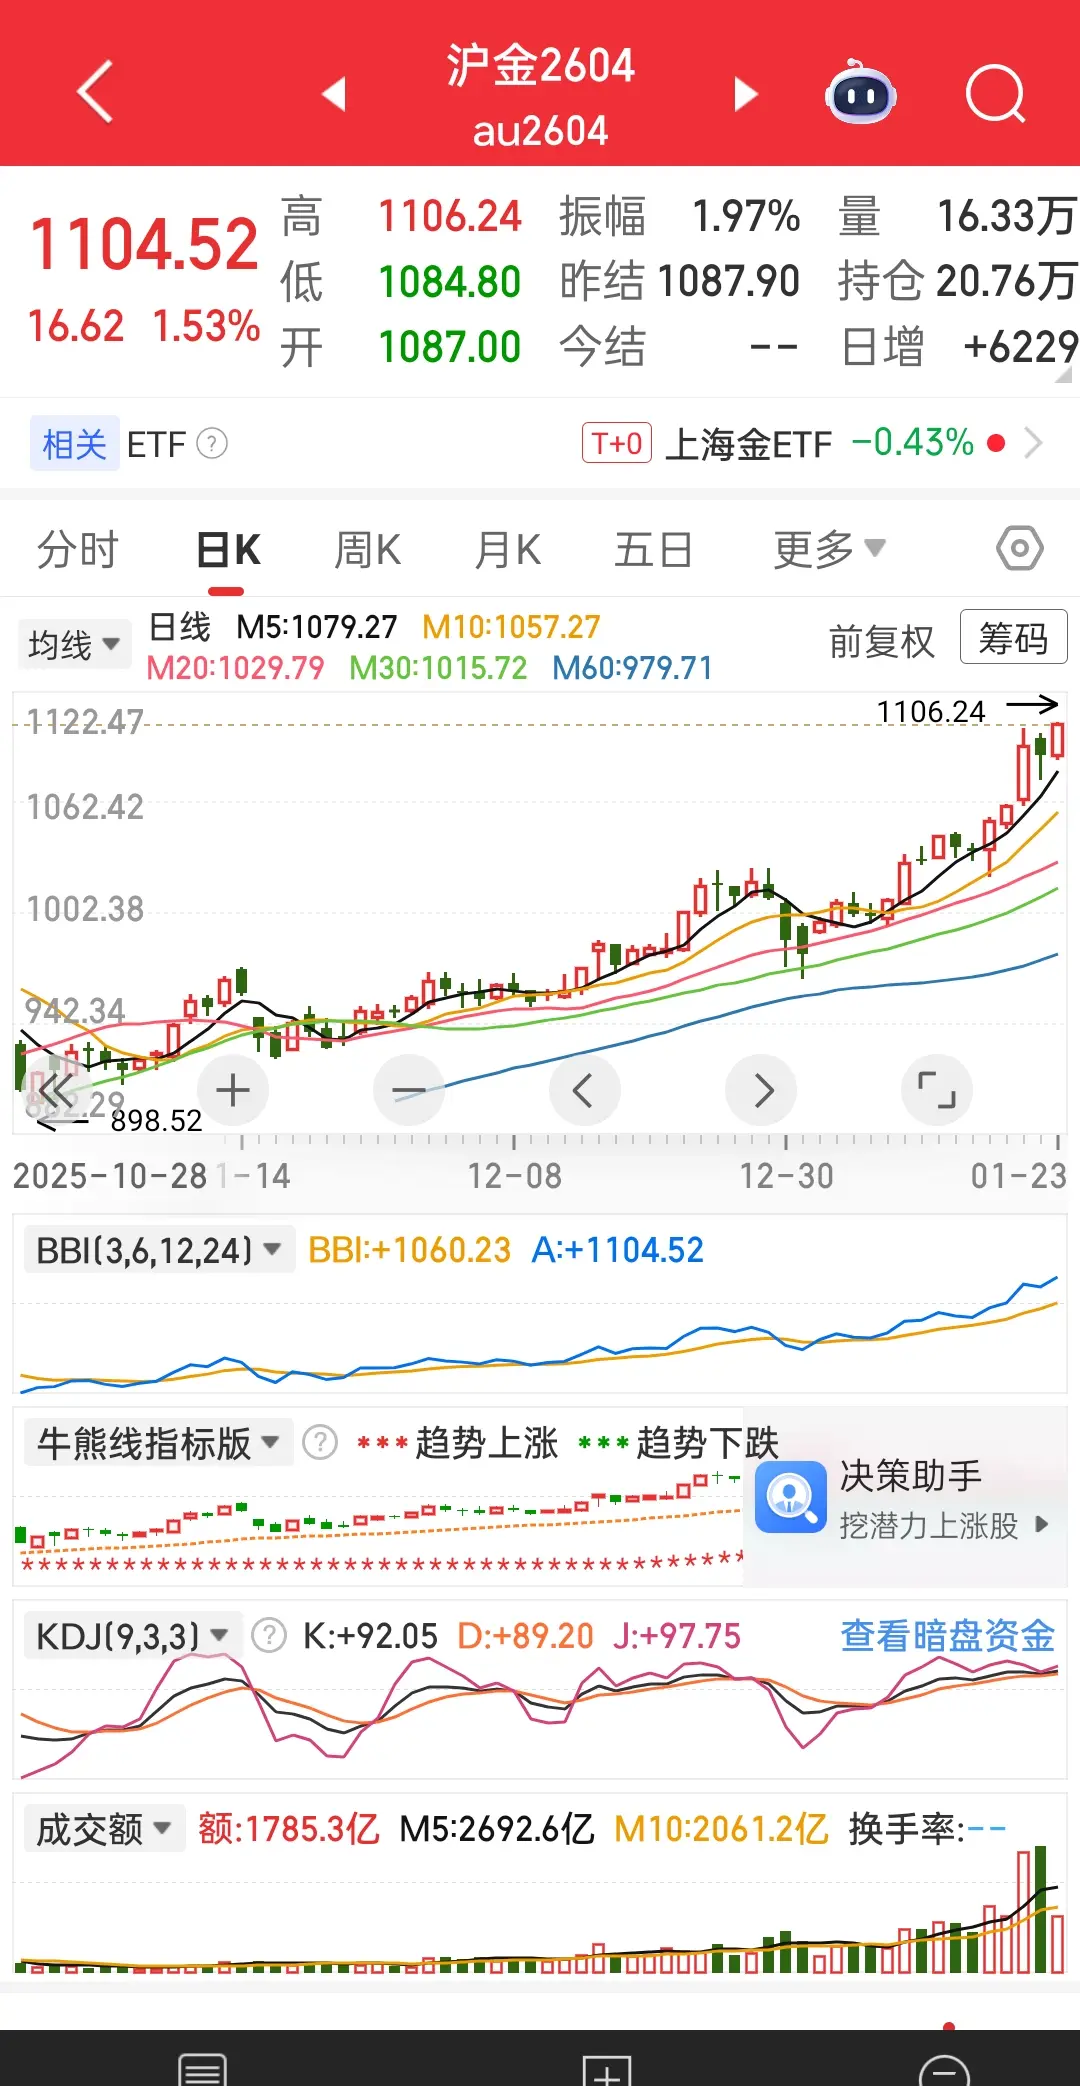
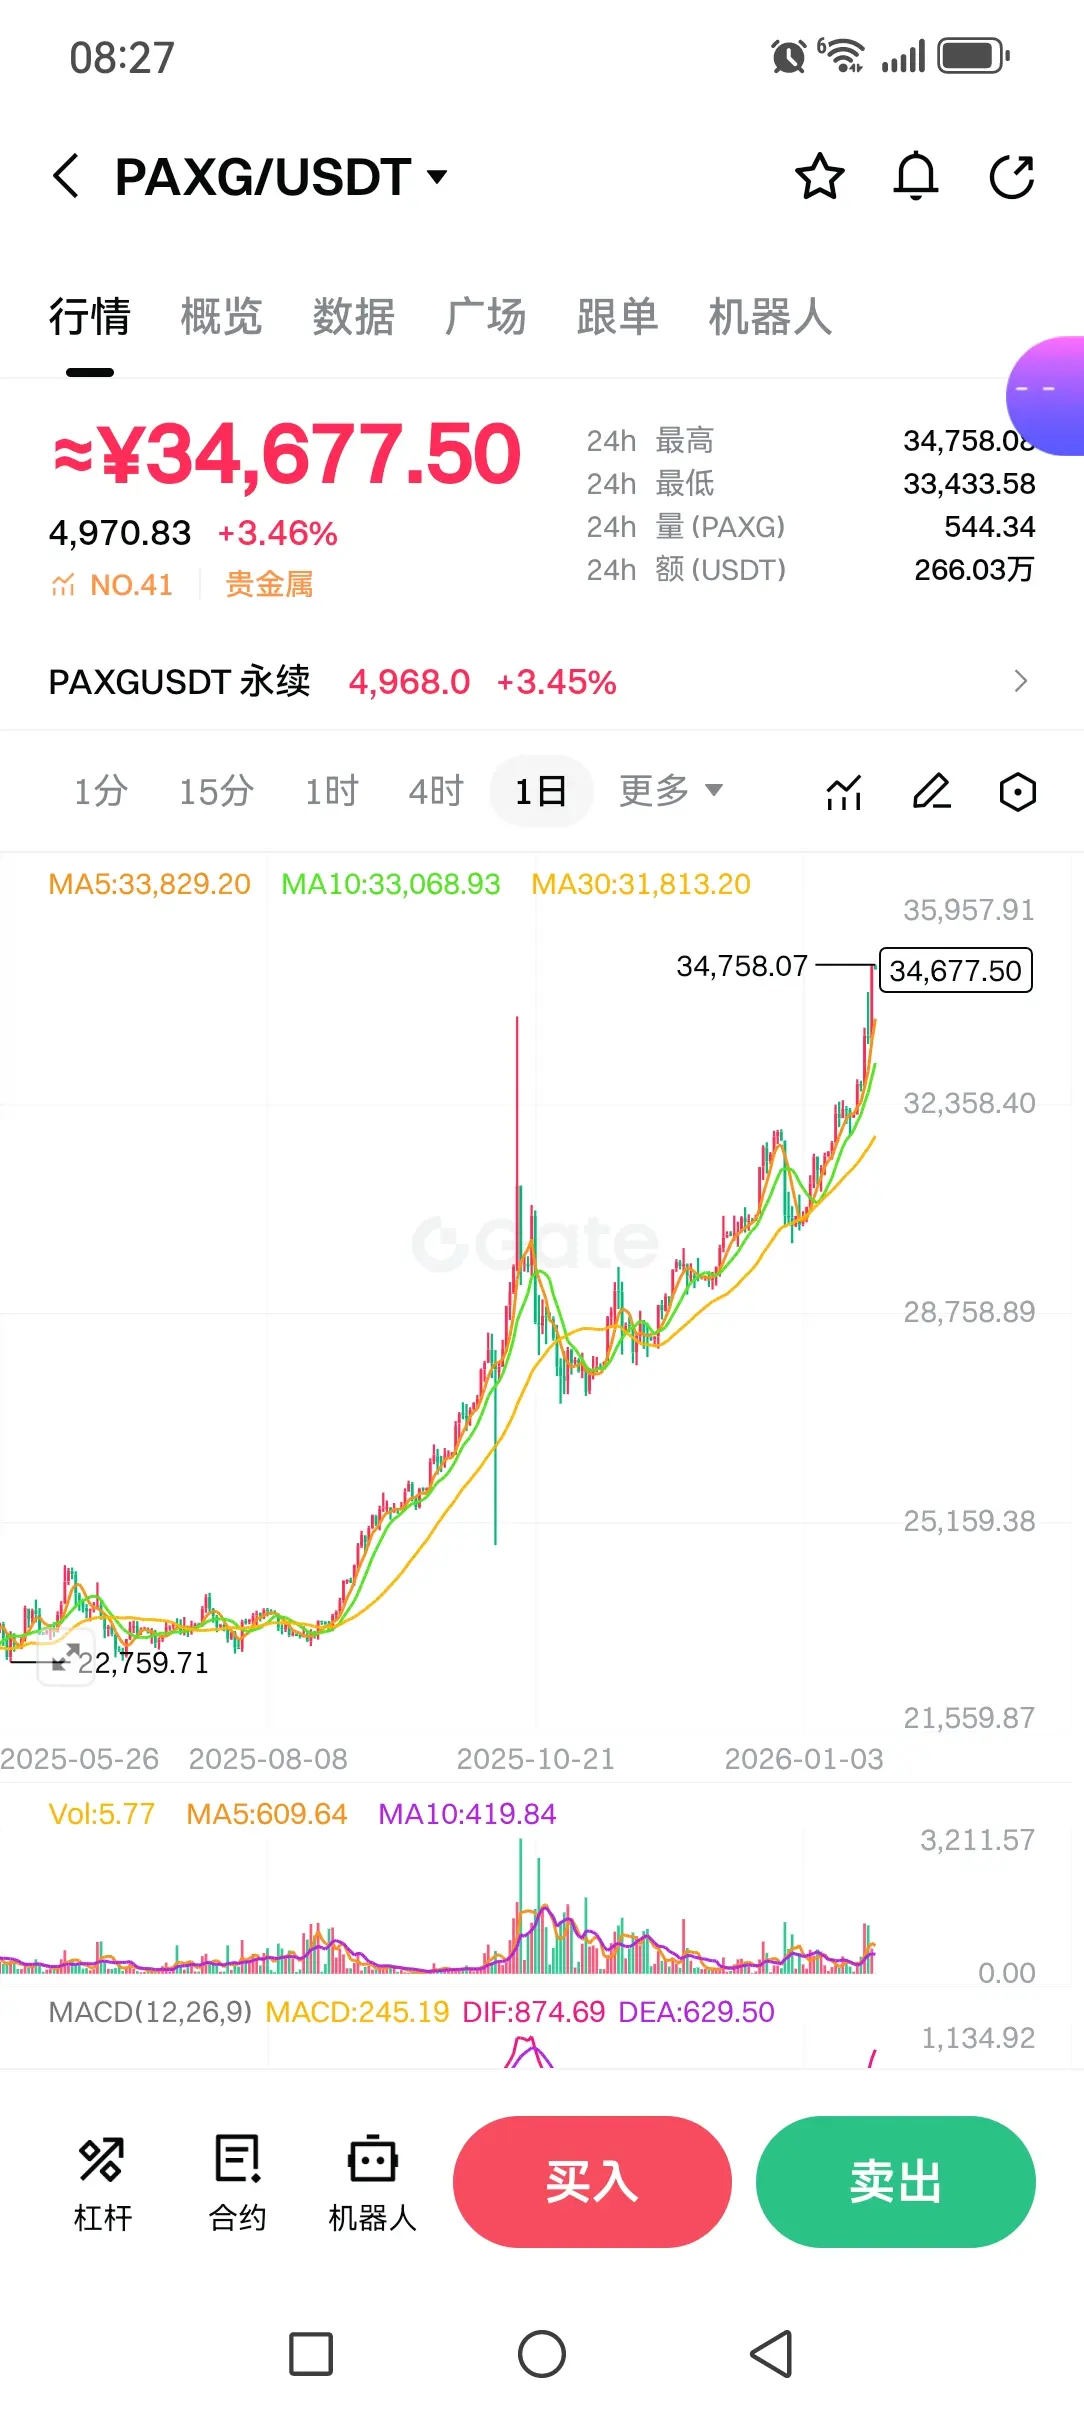
Let's talk about the upcoming levels and outlook for gold.
On the Zhima platform, you can buy and sell spot gold and contracts. I estimate that many beginners don't know this, so let me explain. Spot gold is $PAXG , and gold contracts are $XAU .
In this bull market, each time the price breaks below the parabolic structure, the average retracement is about -10%.
Therefore, the next phase of this trend could push up to around 5000.
Then, there will be another approximately -10% correction, followed by a push to new highs.
Having discussed the technical aspect of gold, let's now look at the funda
PAXG3,38%
- Reward
- 4
- 5
- Repost
- Share
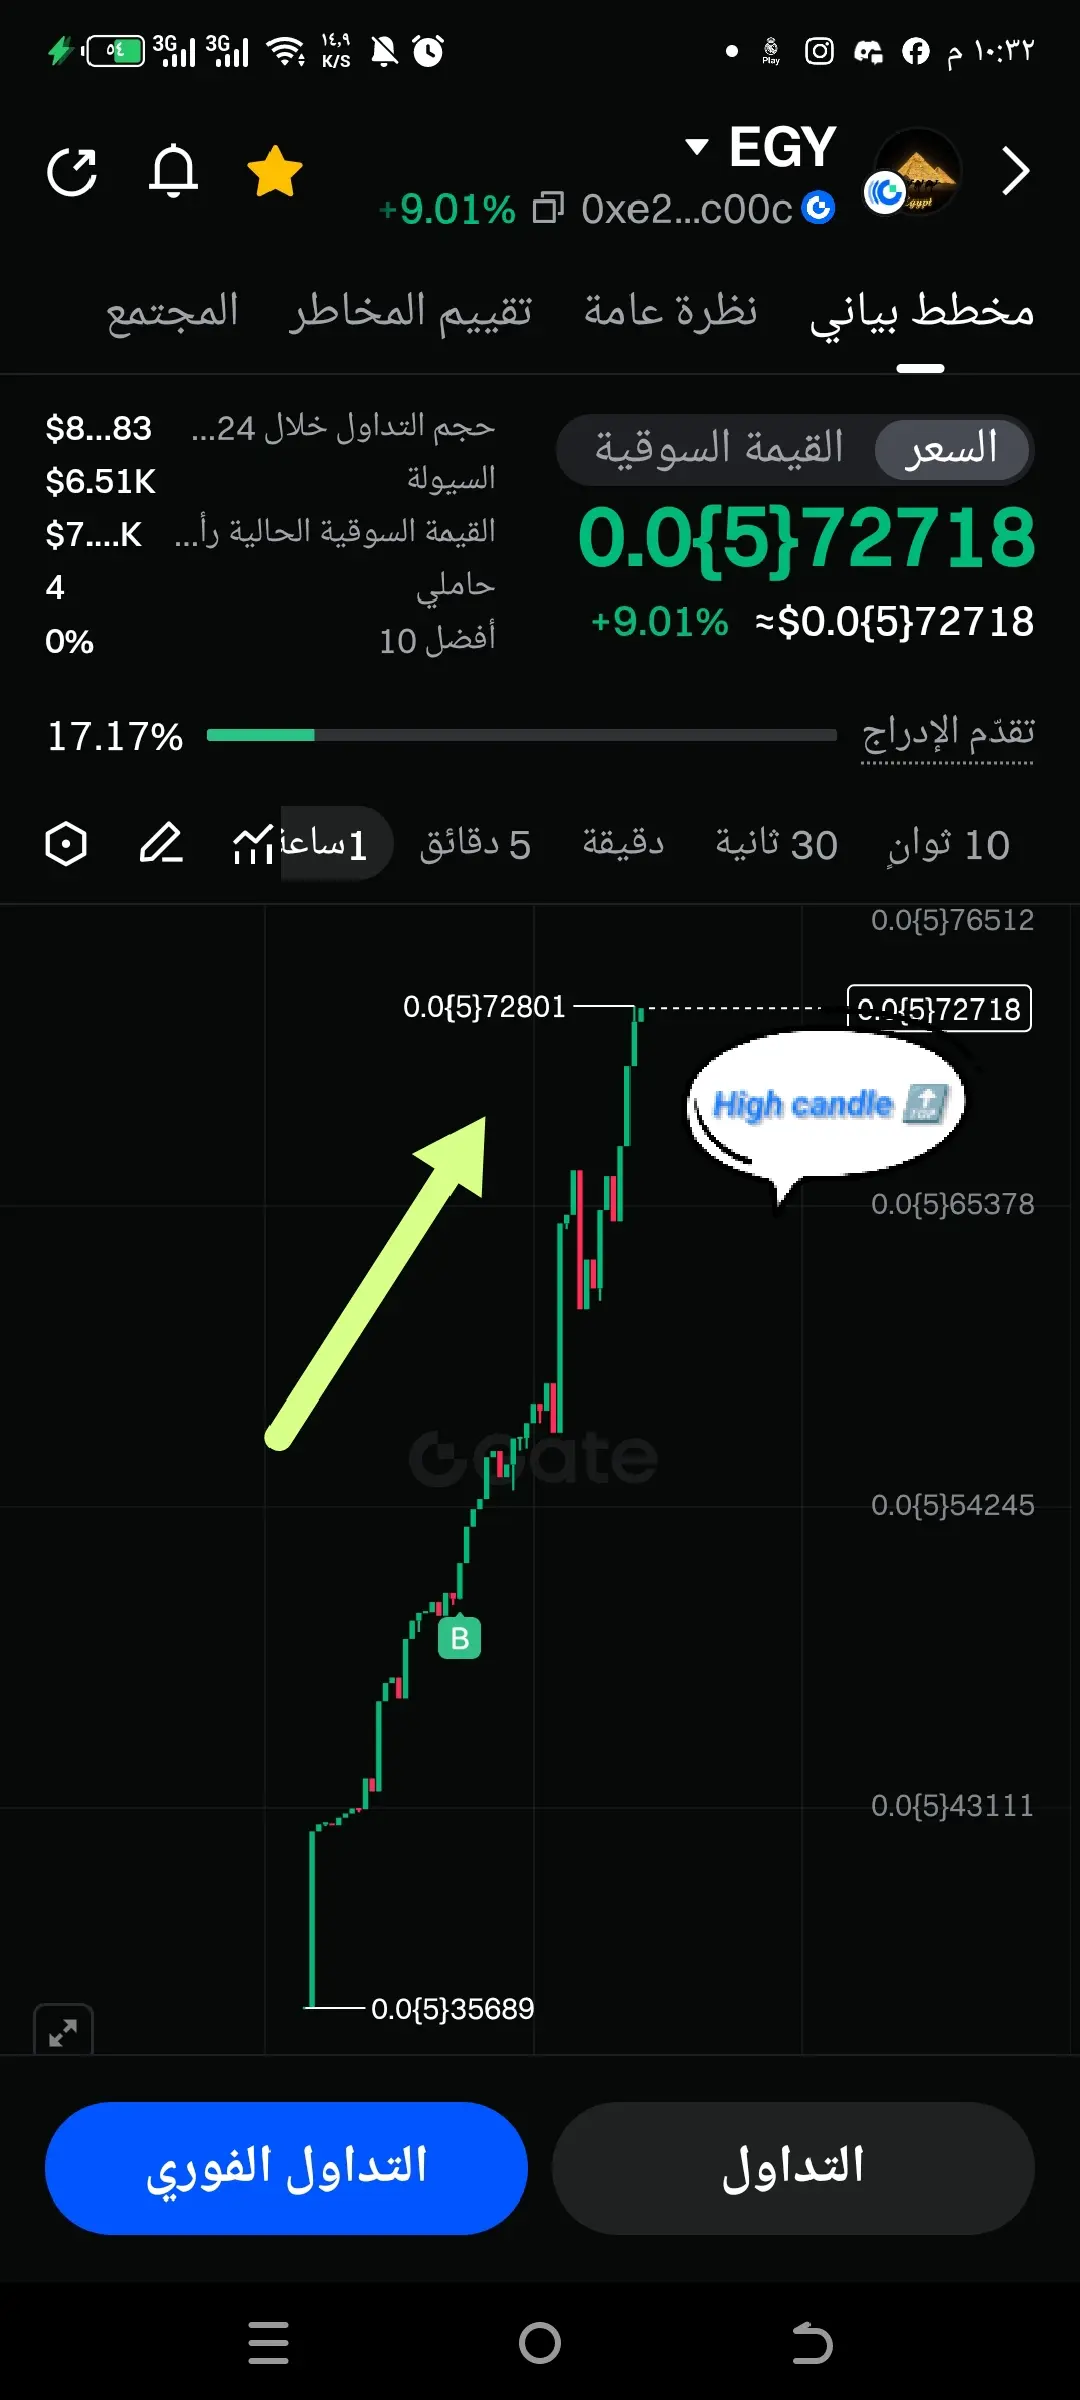
Ryakpanda:
Hold on tight, we're about to take off 🛫View More
Viewing the Top Market Coins Spot Chart and comparing them
1
- Reward
- 1
- Comment
- Repost
- Share


- Reward
- like
- Comment
- Repost
- Share
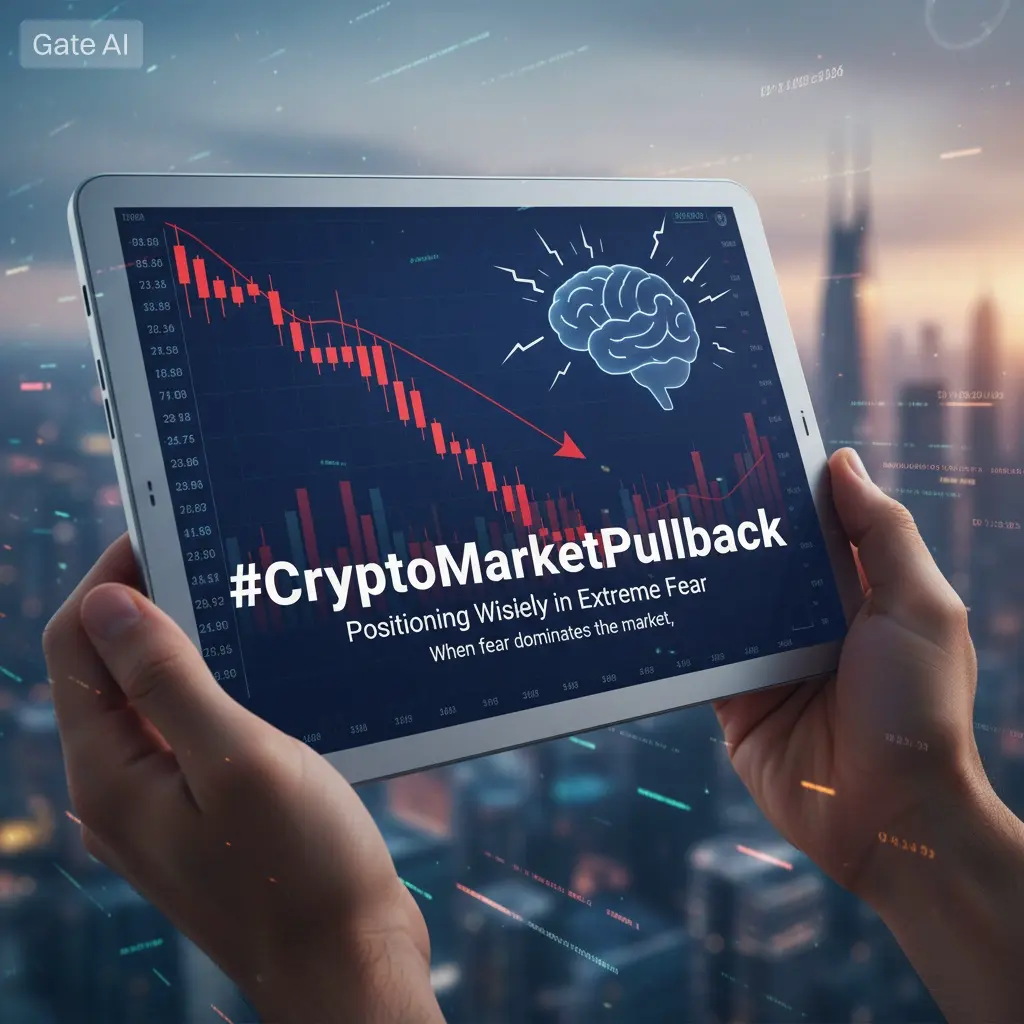
#CryptoMarketPullback Positioning Wisely in Extreme Fear
When fear dominates the market, speed is rarely the path to success. Winners are those who think clearly, act deliberately, and control risk. In early 2026, crypto markets are showing extreme fear signals: price action is indecisive, volume is selective, and uncertainty is widespread. This is not a time for aggression — it is a time for strategic positioning.
📌 1. Position Your Mind First
The most common mistake during fear phases is acting fast or reacting emotionally. The markets are uncertain, and emotional responses amplify risk. Tr
- Reward
- 2
- 3
- Repost
- Share
Discovery:
Buy To Earn 💎View More
All the #TradeOnGateToClaim5Million #PI positions have been held since 2019 and 2020, the early pioneers. Bought in at 2.3, who is more miserable than me? The early promotion was mocked by others. After 6 years, it finally launched on the mainnet, only to be trapped at the peak. Staking ETF, and then mocked again.
View Original
- Reward
- like
- Comment
- Repost
- Share
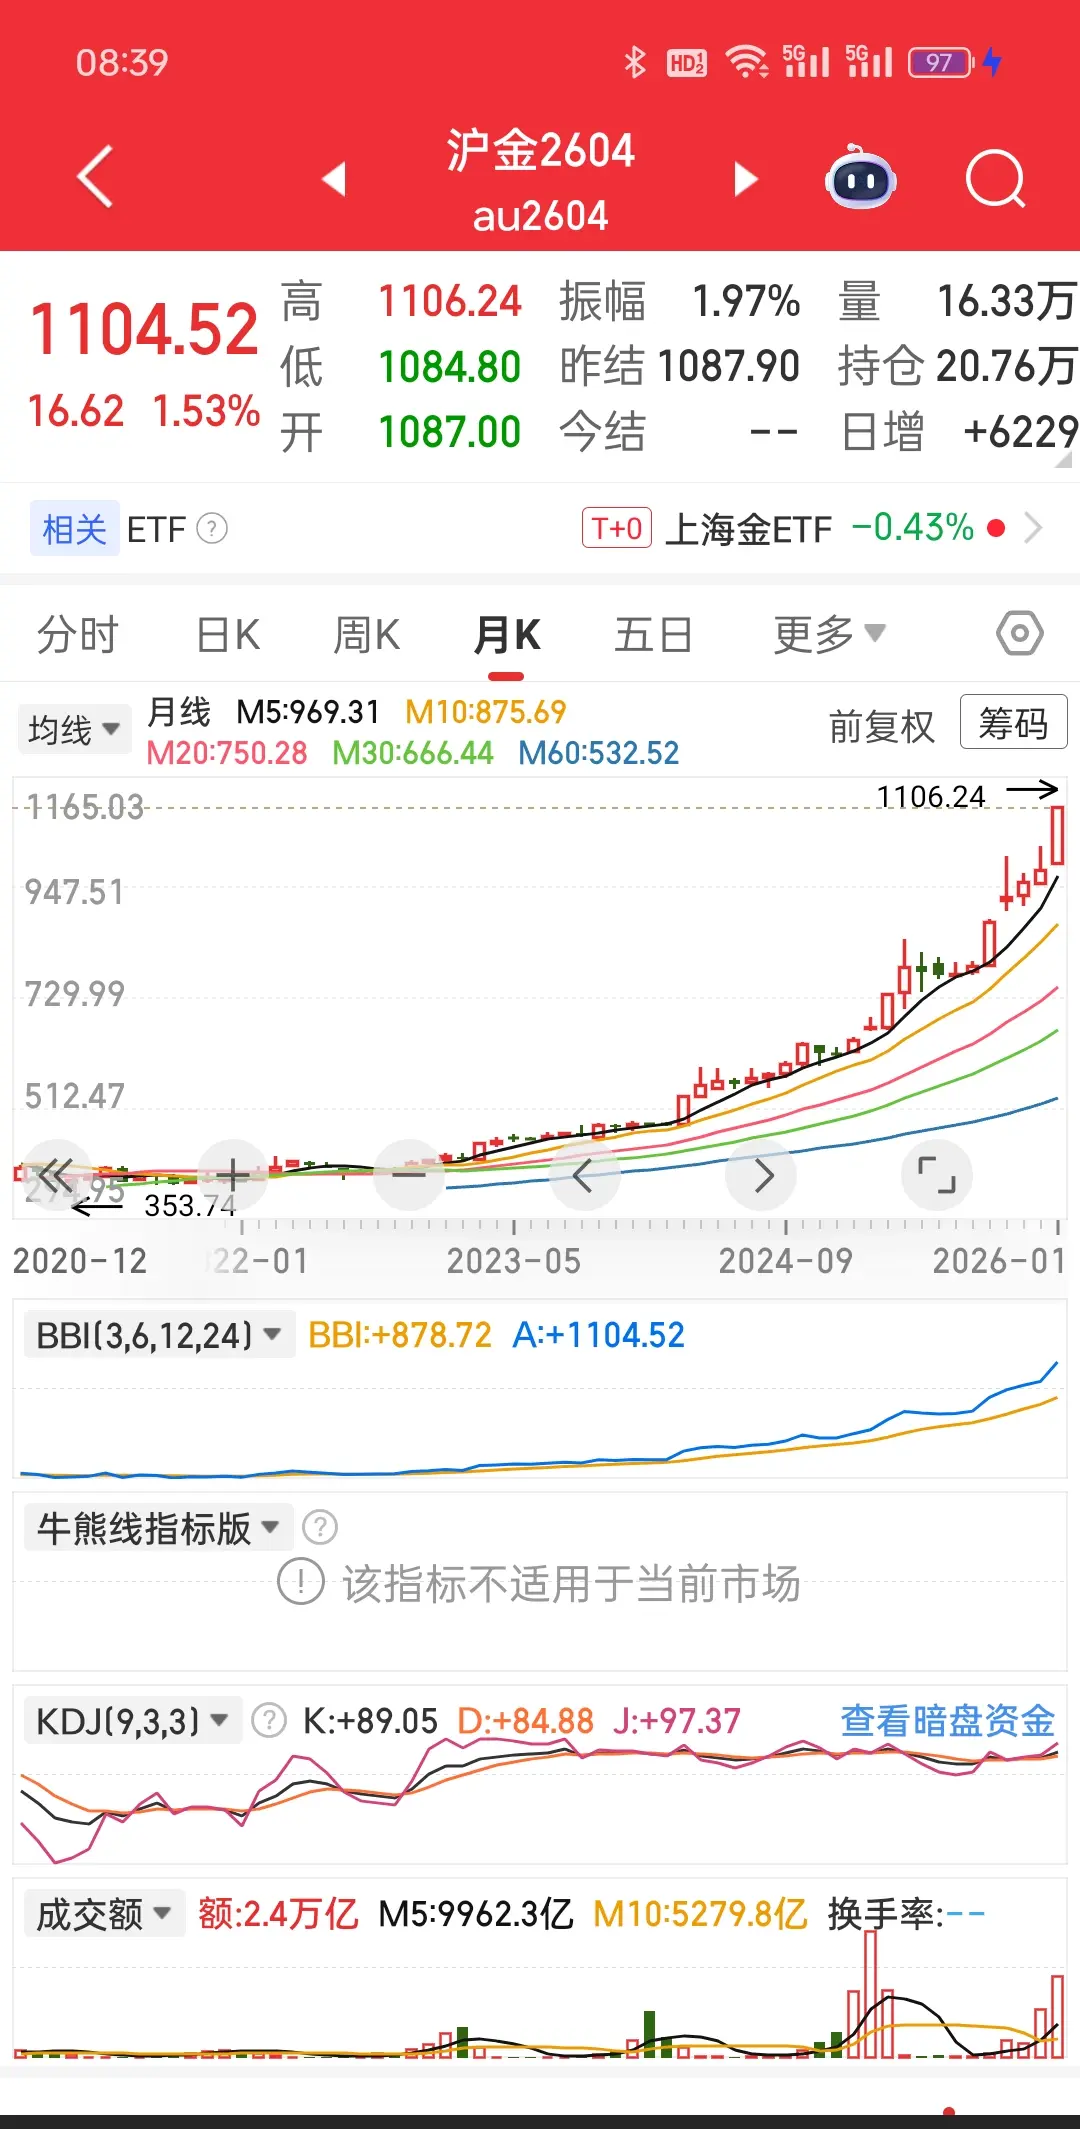
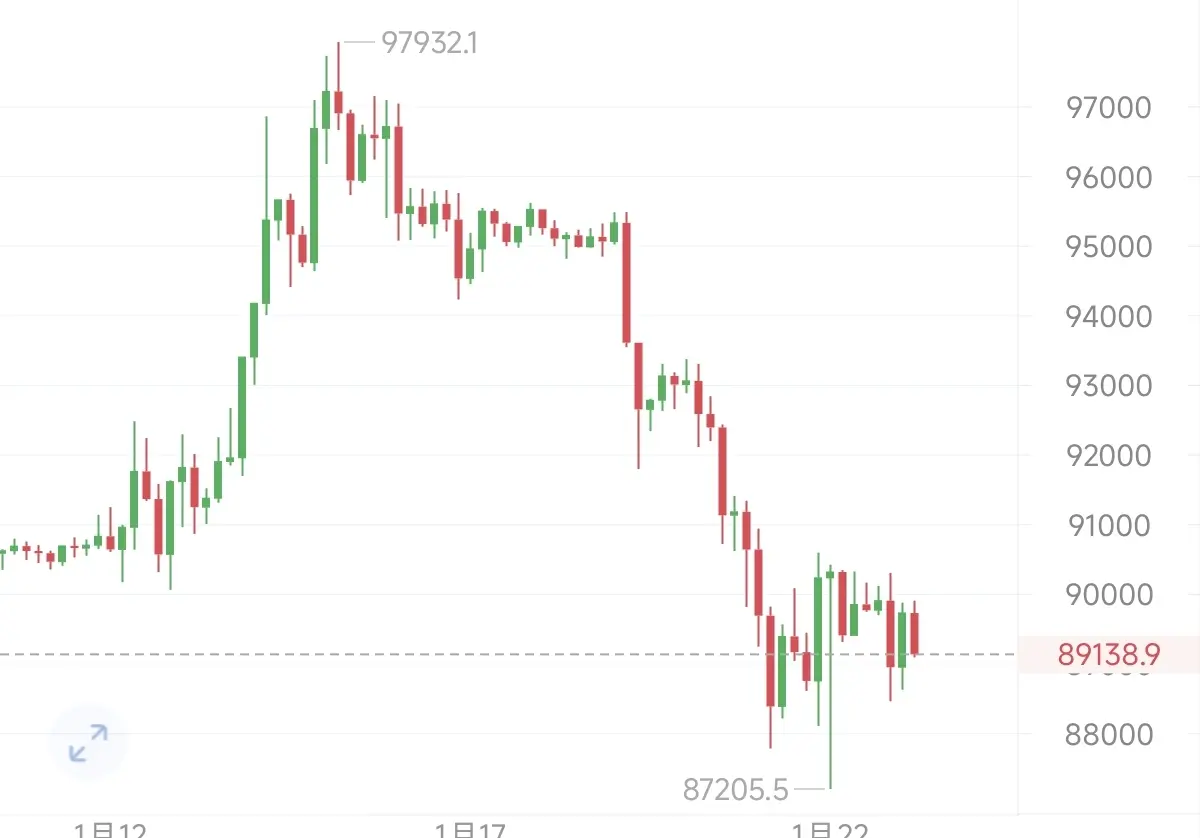
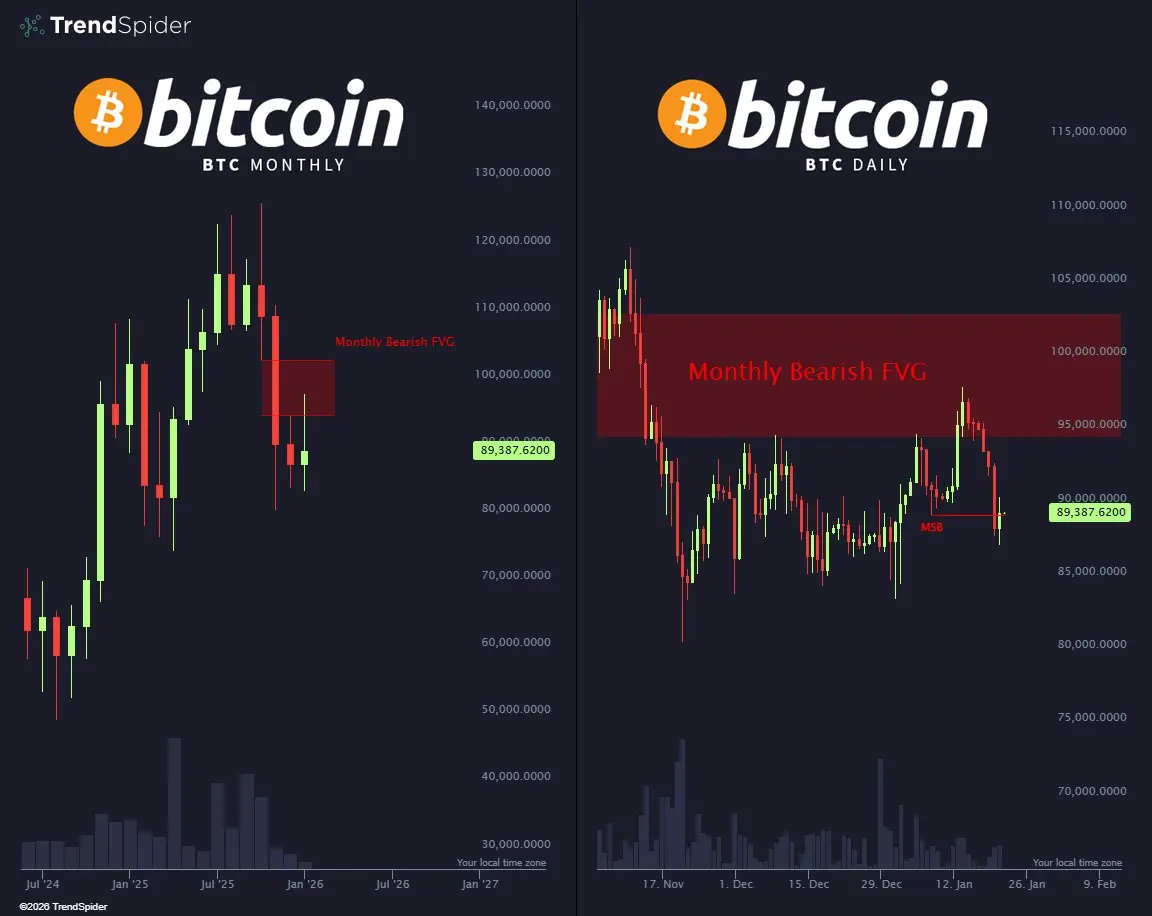
Bitcoin at $89,000... Is this a real rally or a trap for buyers? 📉₿
-
The chart is more reliable than news reports.
The monthly chart shows that we are now inside the "Bearish FVG" (Bearish FVG).
This red zone is not just a color on the screen,
but a previous "imbalance" area,
where sellers had the upper hand,
and now the price is testing whether sellers are still there.
-
The answer comes from the daily chart:
An (MSB) signal or "break of market structure" has appeared.
In simple terms: the buying momentum that pushed the price up is starting to fade,
and institutions are beginning to take p
-
The chart is more reliable than news reports.
The monthly chart shows that we are now inside the "Bearish FVG" (Bearish FVG).
This red zone is not just a color on the screen,
but a previous "imbalance" area,
where sellers had the upper hand,
and now the price is testing whether sellers are still there.
-
The answer comes from the daily chart:
An (MSB) signal or "break of market structure" has appeared.
In simple terms: the buying momentum that pushed the price up is starting to fade,
and institutions are beginning to take p
BTC-0,41%
MC:$38.43KHolders:4
87.77%
- Reward
- like
- Comment
- Repost
- Share
Load More
Join 40M users in our growing community
⚡️ Join 40M users in the crypto craze discussion
💬 Engage with your favorite top creators
👍 See what interests you
Trending Topics
View More64.21K Popularity
43.29K Popularity
26.12K Popularity
67.61K Popularity
348.23K Popularity
Hot Gate Fun
View More- MC:$3.42KHolders:10.00%
- MC:$3.4KHolders:10.00%
- MC:$3.4KHolders:10.00%
- MC:$3.45KHolders:20.04%
- MC:$3.39KHolders:10.00%
News
View MoreDeepBook Margin is now live, introducing fully on-chain and composable leverage trading functionality for Sui.
1 m
Spot silver breaks through $97, reaching a new all-time high
2 m
WLFI and Spacecoin strategic partnership, announces token swap to layout "DeFi × Space Internet"
6 m
TikTok officially announces the US plan, with two companies jointly operating, and ByteDance retaining the algorithm intellectual property rights
10 m
Capital One invests $5.15 billion to acquire fintech startup Brex
12 m
Pin