Trade
Basic
Futures
Futures
Hundreds of contracts settled in USDT or BTC
TradFi
Gold
Trade global traditional assets with USDT in one place
Options
Hot
Trade European-style vanilla options
Unified Account
Maximize your capital efficiency
Demo Trading
Futures Kickoff
Get prepared for your futures trading
Futures Events
Participate in events to win generous rewards
Demo Trading
Use virtual funds to experience risk-free trading
Earn
Launch
CandyDrop
Collect candies to earn airdrops
Launchpool
Quick staking, earn potential new tokens
HODLer Airdrop
Hold GT and get massive airdrops for free
Launchpad
Be early to the next big token project
Alpha Points
Trade on-chain assets and enjoy airdrop rewards!
Futures Points
Earn futures points and claim airdrop rewards
Investment
Simple Earn
Earn interests with idle tokens
Auto-Invest
Auto-invest on a regular basis
Dual Investment
Buy low and sell high to take profits from price fluctuations
Soft Staking
Earn rewards with flexible staking
Crypto Loan
0 Fees
Pledge one crypto to borrow another
Lending Center
One-stop lending hub
VIP Wealth Hub
Customized wealth management empowers your assets growth
Private Wealth Management
Customized asset management to grow your digital assets
Quant Fund
Top asset management team helps you profit without hassle
Staking
Stake cryptos to earn in PoS products
Smart Leverage
New
No forced liquidation before maturity, worry-free leveraged gains
GUSD Minting
Use USDT/USDC to mint GUSD for treasury-level yields
More
EqunixHub
$ETC
The ETC/USDT 15m chart shows a sharp bearish drop 📉. After hitting a high of 9.076, price plummeted below all major Moving Averages (MA5, MA10, MA30), signaling strong downward momentum.
Key metrics:
Price: 8.767 (-1.80%)
Support: Testing the 8.747 level; a break here could lead to further bleeding 🩸
MACD: Deeply negative (-0.030) with expanding red bars, suggesting sellers are still in control
Expect high volatility. Entering now is risky as the "falling knife" hasn't stabilized yet ⚠️.
ETC-2.82%
- Reward
- 1
- Comment
- Repost
- Share
moving all my playlist to ytmusic
- access to podcast
- Yt premium for background plays
- easy to clip moments from app
thanks for playing 👍
- access to podcast
- Yt premium for background plays
- easy to clip moments from app
thanks for playing 👍
- Reward
- like
- Comment
- Repost
- Share
Brief
Search trends on Google show a clear divergence between investor fear and growing public curiosity around bitcoin.
Panic searches such as “Bitcoin to zero” and “Bitcoin is dead” are rapidly increasing — a signal historically associated with market bottoms.
At the same time, educational searches like “What is Bitcoin?” are reaching record highs thanks to new, beginner users.
Google Trends for Bitcoin illustrate investor concern
While bitcoin has again surpassed the $68 000 mark after a notable rebound in US stock markets, web search statistics show an increase in negative searches. Many p
BTC-3.37%


- Reward
- like
- Comment
- Repost
- Share
馬币火
Malaysian Ringgit
Created By@CryptoKing2026
Listing Progress
100.00%
MC:
$5.26K
More Tokens
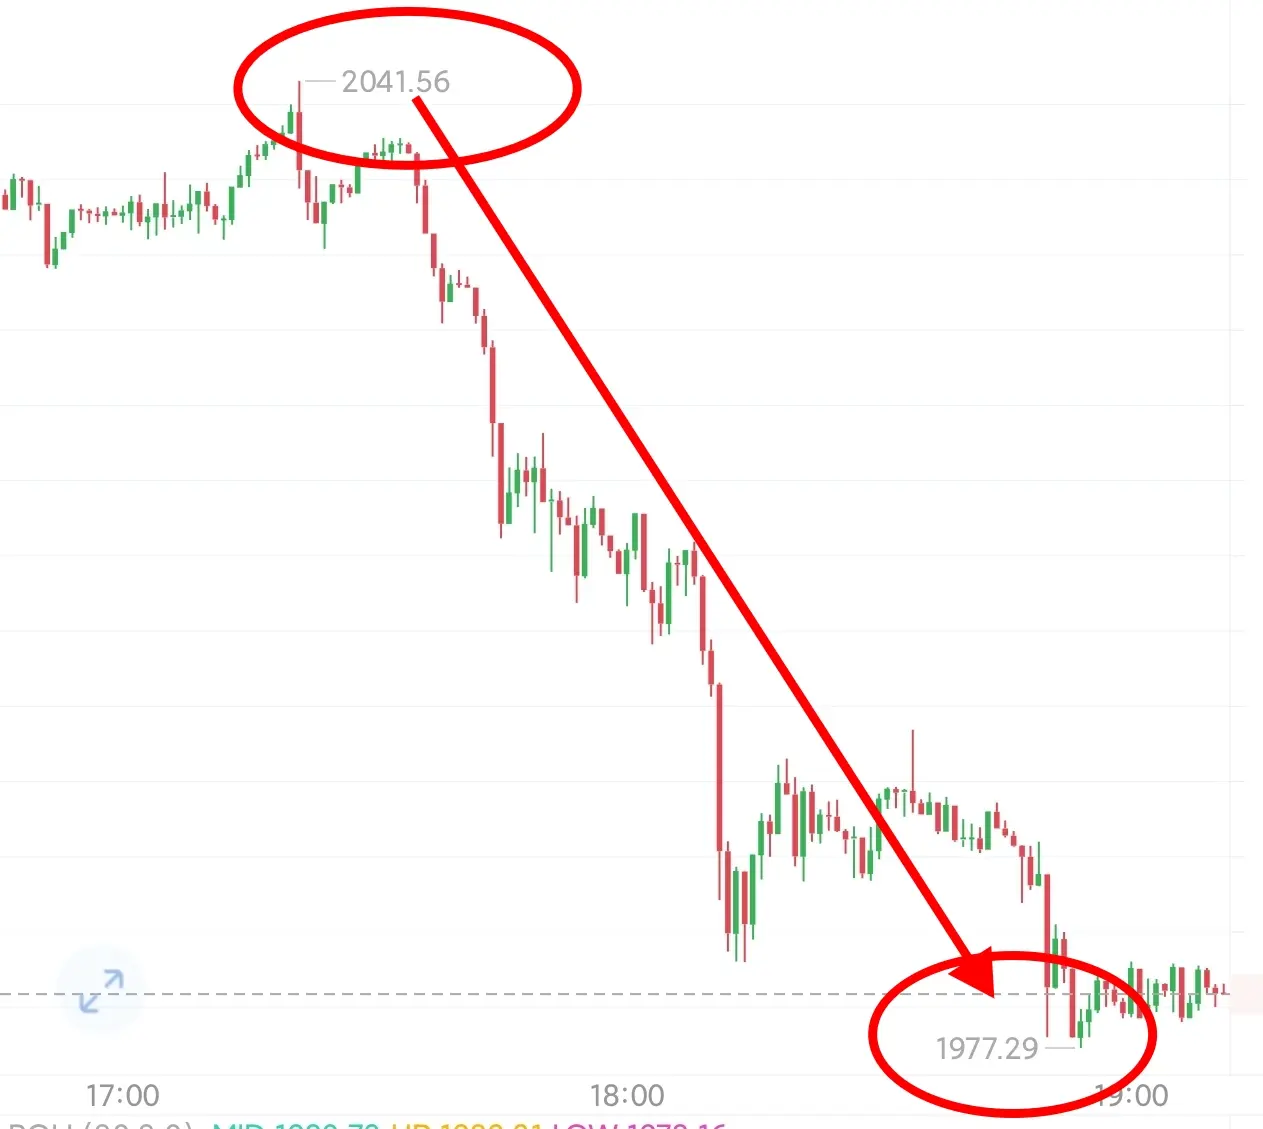
Small positions are really hard to survive, forcing a bloody path through the trend
Bitcoin 675 points, Luodai 4046 trading $BTC
#当前行情抄底还是观望?
#BTC能否重返7万美元?
Bitcoin 675 points, Luodai 4046 trading $BTC
#当前行情抄底还是观望?
#BTC能否重返7万美元?
BTC-3.37%
- Reward
- 1
- Comment
- Repost
- Share
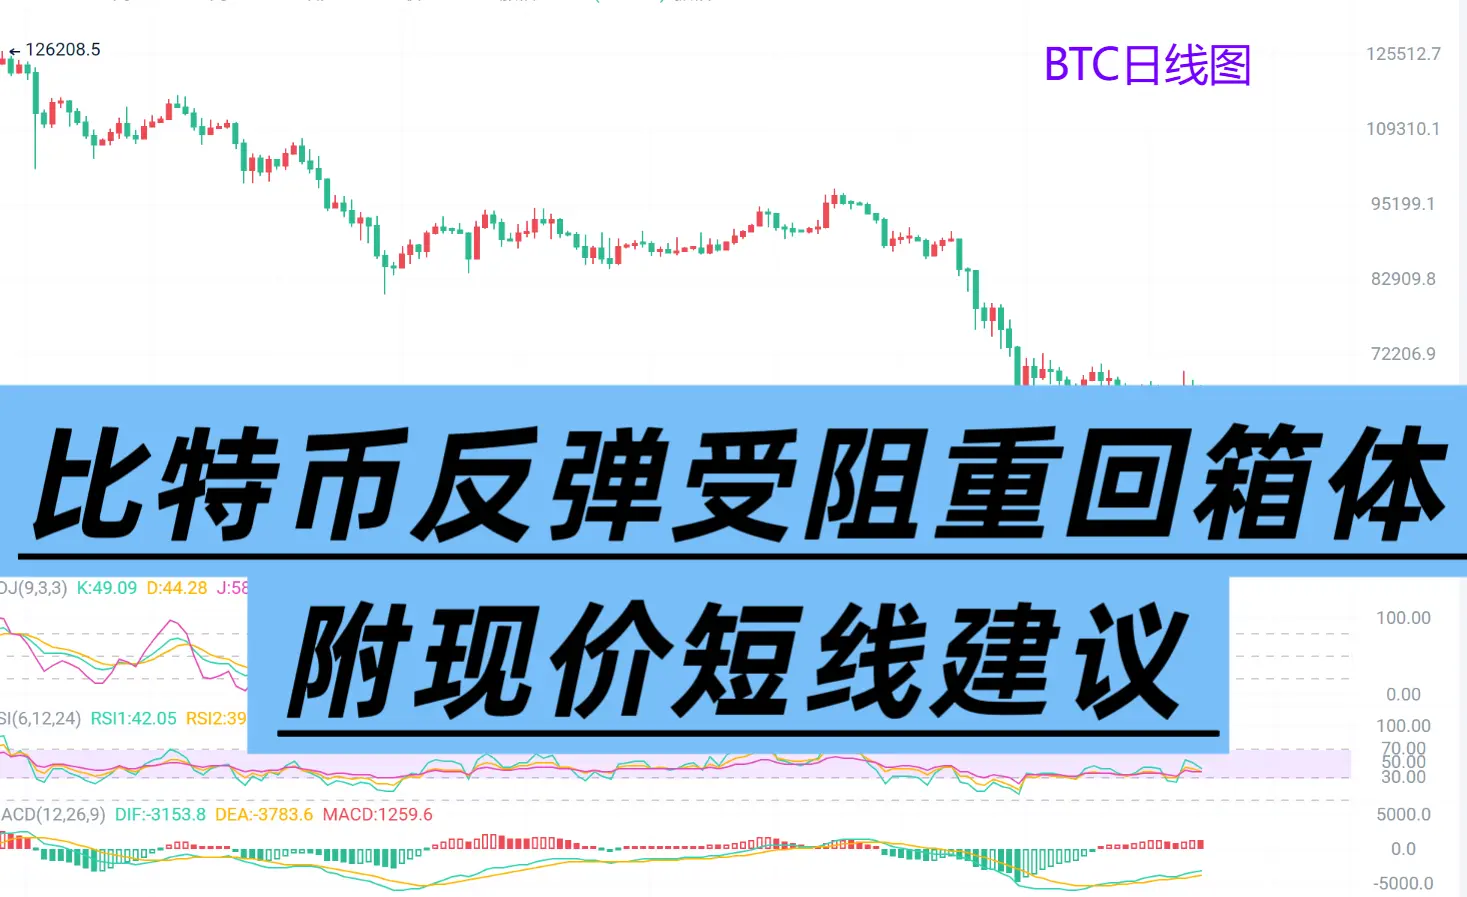
Yue Ying: Bitcoin and Ethereum Market Analysis for 2.28 - Rebound Blocked, Returning to Range, Short-term Price Suggestions
I am Zhou Yueying. Friends who enjoy my articles, please follow me and check out today's share!
Bitcoin Technical Analysis ————
On the daily chart, Bitcoin closed with a doji candlestick, indicating indecision. The opening did not stabilize above the midline and tested downward. The Bollinger Bands are narrowing and flattening. The short-term moving averages are around the middle band. The MACD fast and slow lines are extending upward, but the histogram is shrinking again
View OriginalI am Zhou Yueying. Friends who enjoy my articles, please follow me and check out today's share!
Bitcoin Technical Analysis ————
On the daily chart, Bitcoin closed with a doji candlestick, indicating indecision. The opening did not stabilize above the midline and tested downward. The Bollinger Bands are narrowing and flattening. The short-term moving averages are around the middle band. The MACD fast and slow lines are extending upward, but the histogram is shrinking again
- Reward
- like
- Comment
- Repost
- Share
#MarketInsights
Market Insight: The Next Move in Crypto
The crypto market is entering an interesting phase where patience and strategy matter more than emotions. Bitcoin and major altcoins are showing signs of strength after recent volatility, and traders are closely watching key support and resistance zones.
Market cycles always reward those who stay informed and disciplined. Short term fluctuations may create uncertainty, but they also open opportunities for smart positioning. Volume trends, liquidity movements, and investor sentiment are becoming important indicators for the next potential


- Reward
- 1
- 1
- Repost
- Share
AngryBird:
To The Moon 🌕


Bro @loshmi tending non-stop
- Reward
- like
- Comment
- Repost
- Share
The future of the crypto industry is overall long-term optimistic, institutionalized, and value-driven. Regulations are gradually becoming clearer, ETFs continue to attract capital, and Bitcoin and Ethereum are becoming mainstream asset allocations. AI and on-chain applications, RWA tokenization are exploding, and the industry is shifting from speculation to real-world implementation. Liquidity remains ample, technological iterations accelerate, and the ecosystem matures in resonance. The long-term center of gravity is steadily rising, volatility narrows, and opportunities become more solid—th
View Original


- Reward
- 1
- Comment
- Repost
- Share
show me a better anime collection than this

- Reward
- like
- Comment
- Repost
- Share
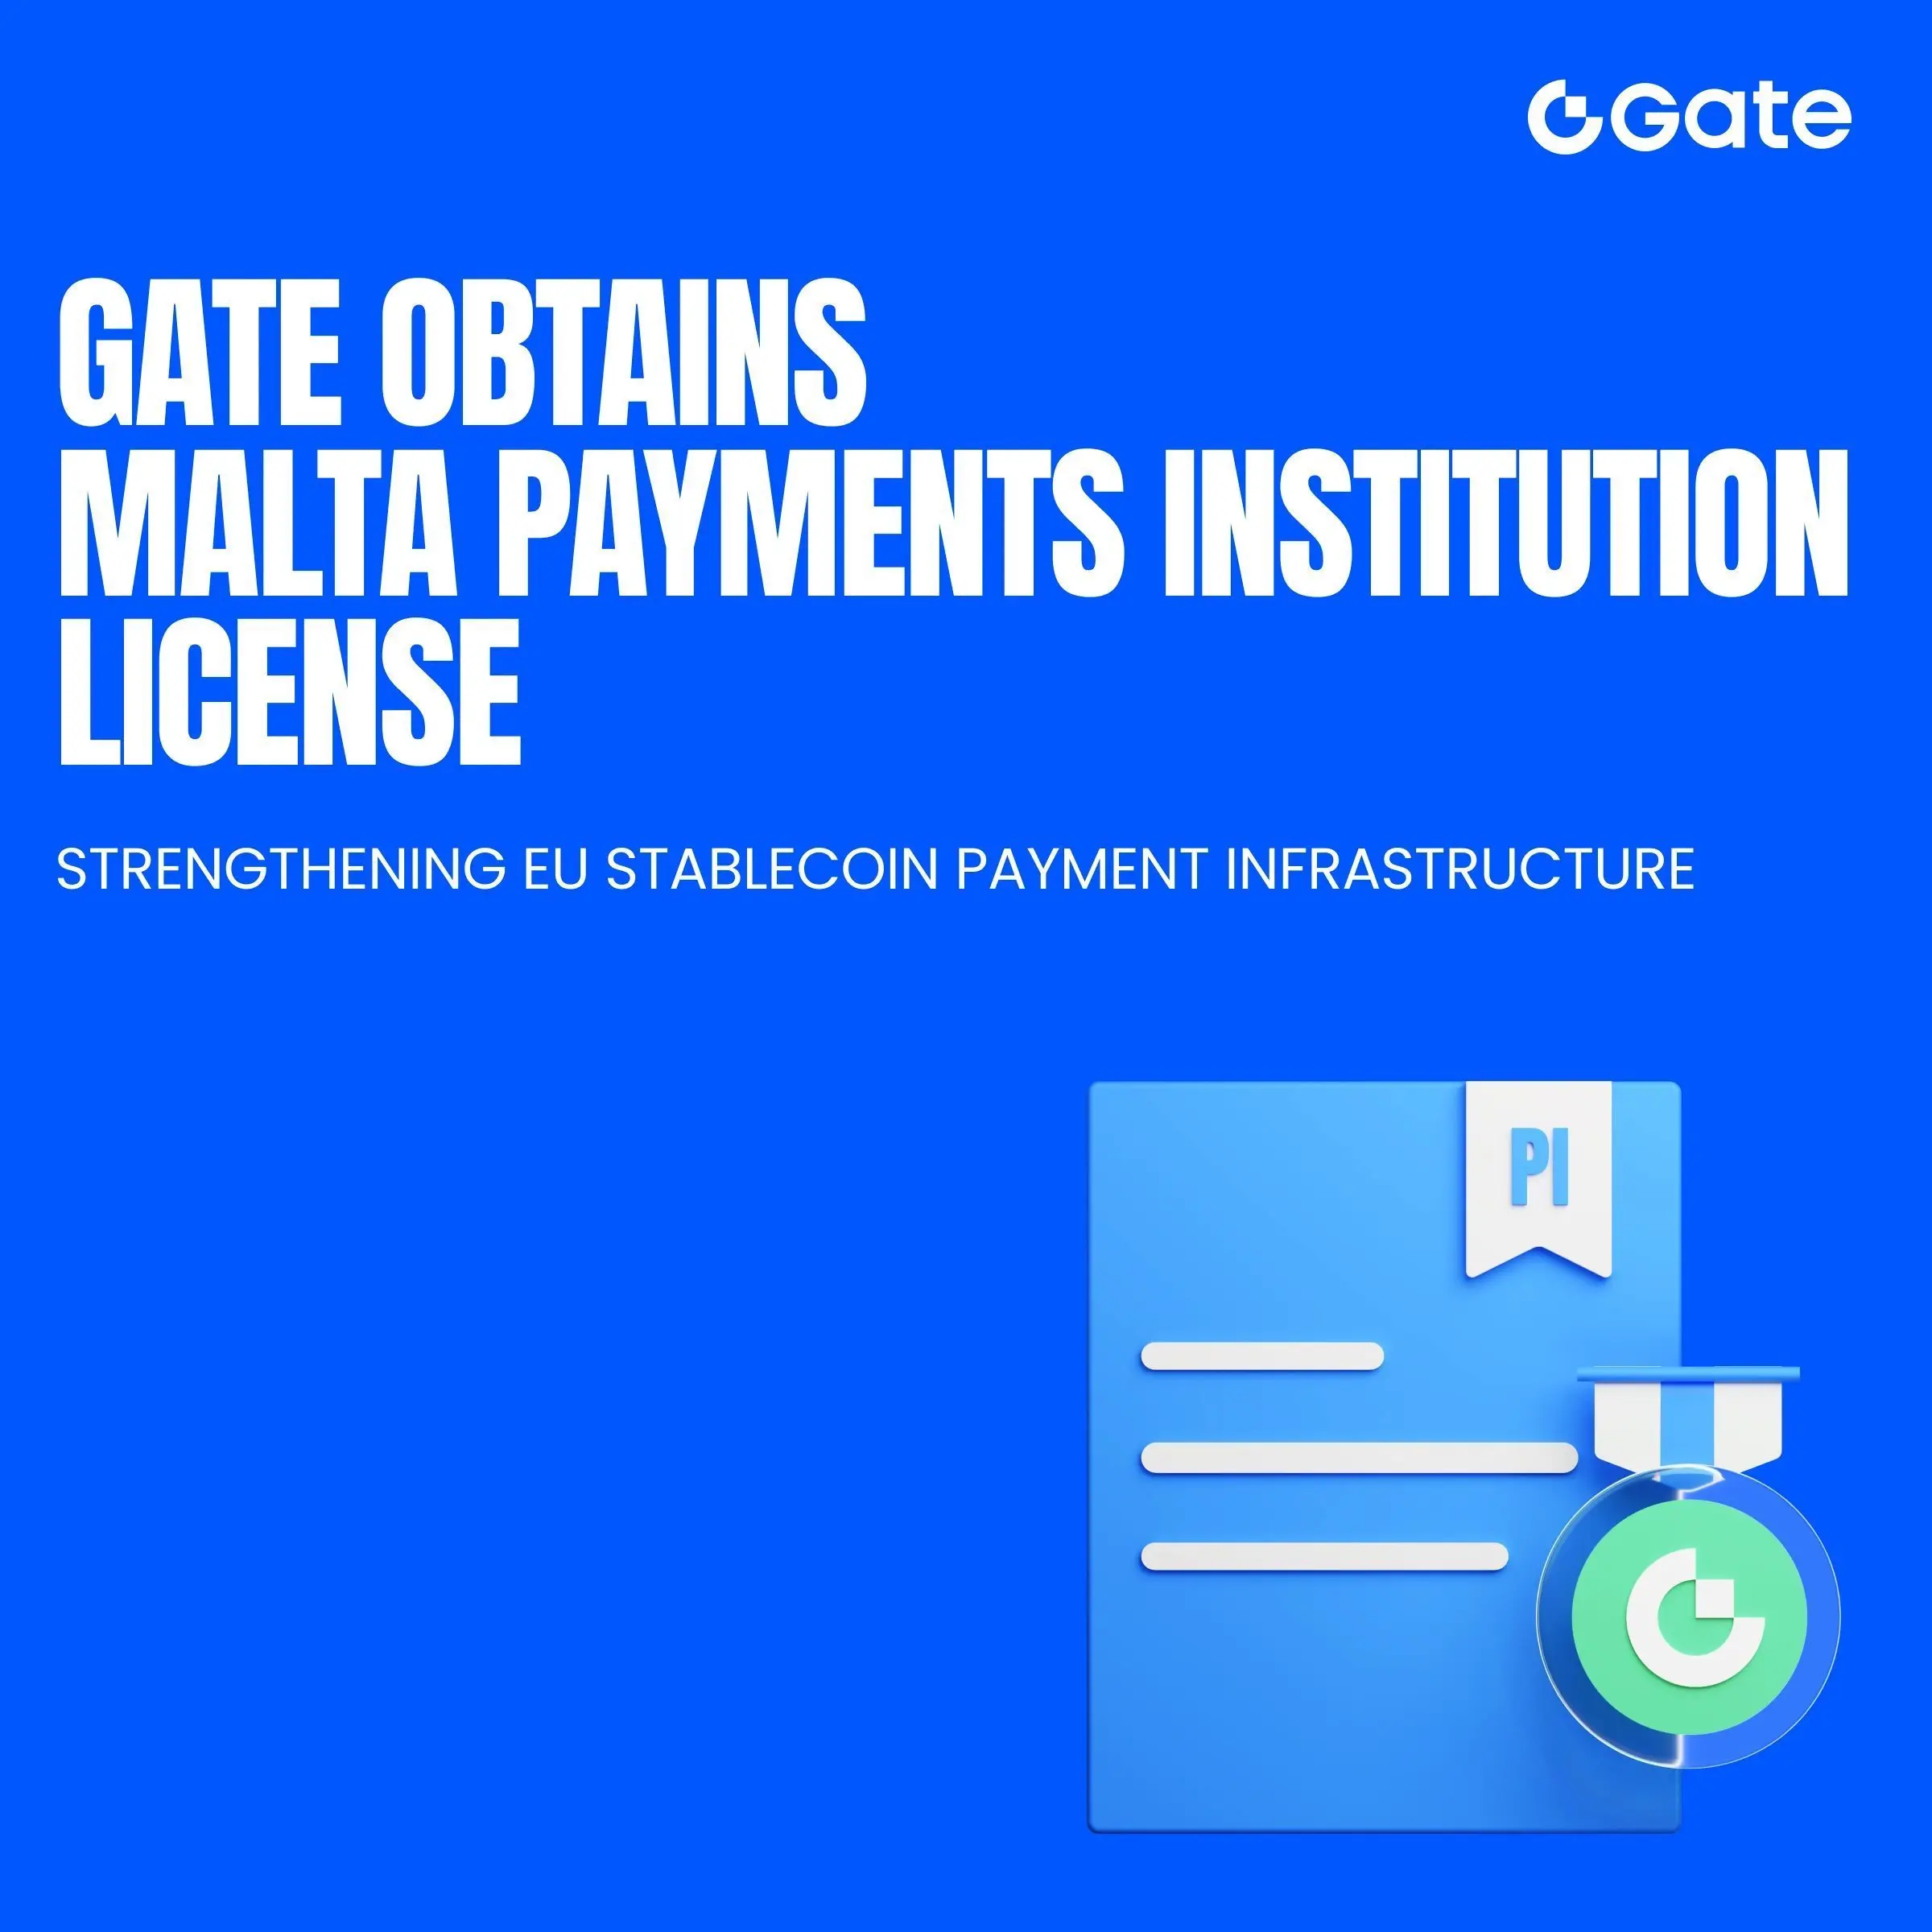
$GT Gate secured a payments institution license under EU PSD2 from the MFSA
one of the first crypto-native firms in europe
complements full MiCA license
expands EU payment services via passporting
bridges tradfi and web3
#gate #crypto #web3
one of the first crypto-native firms in europe
complements full MiCA license
expands EU payment services via passporting
bridges tradfi and web3
#gate #crypto #web3
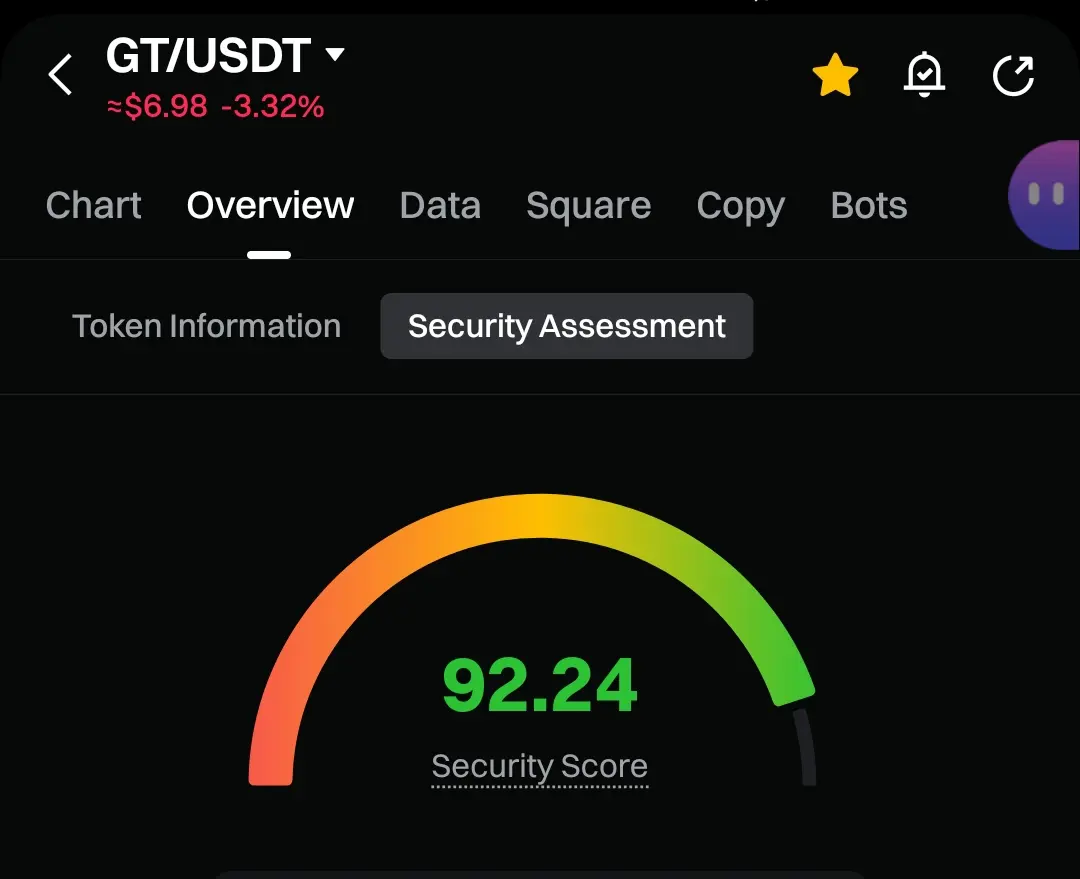
GT-3.32%
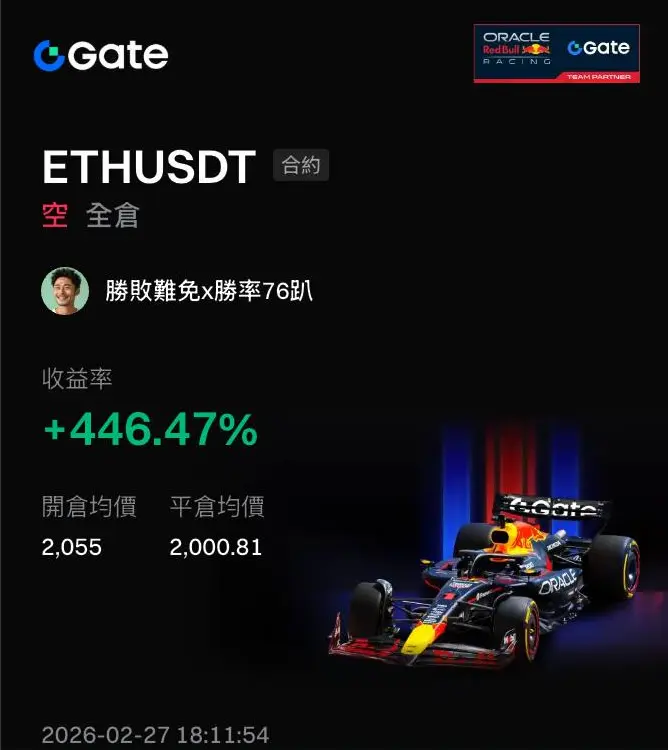
[The user has shared his/her trading data. Go to the App to view more.]
- Reward
- 1
- Comment
- Repost
- Share
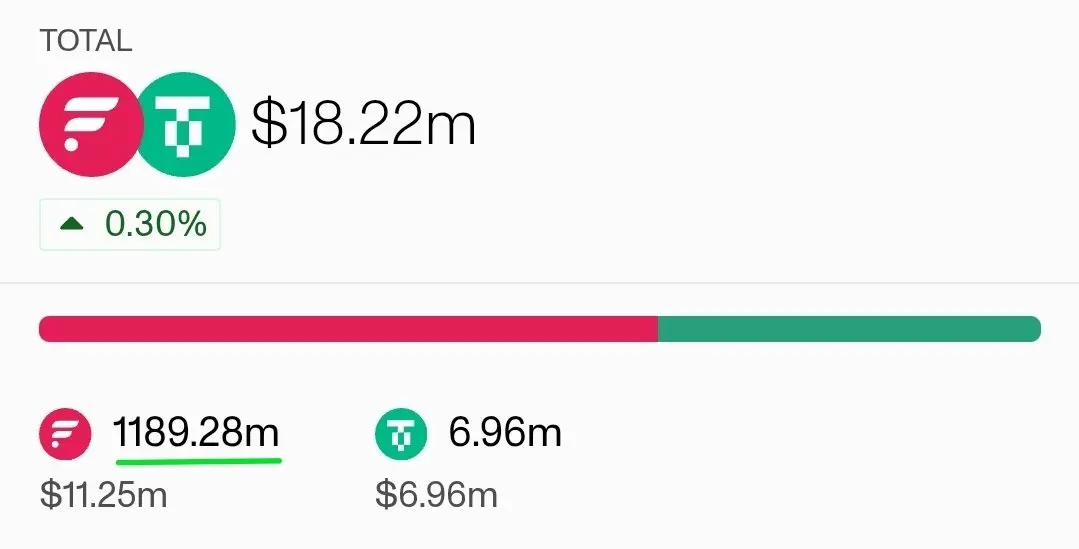
¥
狗头萝莉
Created By@F91bbTop
Subscription Progress
0.00%
MC:
$0
More Tokens
The short Ethereum position given in yesterday's live stream, I told you not to panic. Did you perfectly make a profit???#Gate广场发帖领五万美金红包
ETH-5.38%
- Reward
- 1
- 1
- Repost
- Share
Cailin :
:
Are there still real-time orders tonight?Who says there are no homeless people in China? Every time I go back to my hometown, I always buy something for this old lady. The first time I saw her was also in winter. I often go out to feed stray cats and dogs. At that time, I saw a ragged old lady outside the supermarket surrounded by many stray dogs. She was not even full herself but still shared her bread with those dogs. She usually makes a living by collecting trash and is often bullied by local kids who throw stones and steal what she picks up. As Confucius said, human nature at birth is inherently evil; people need to be educated a
View Original
- Reward
- like
- Comment
- Repost
- Share
- Reward
- like
- Comment
- Repost
- Share
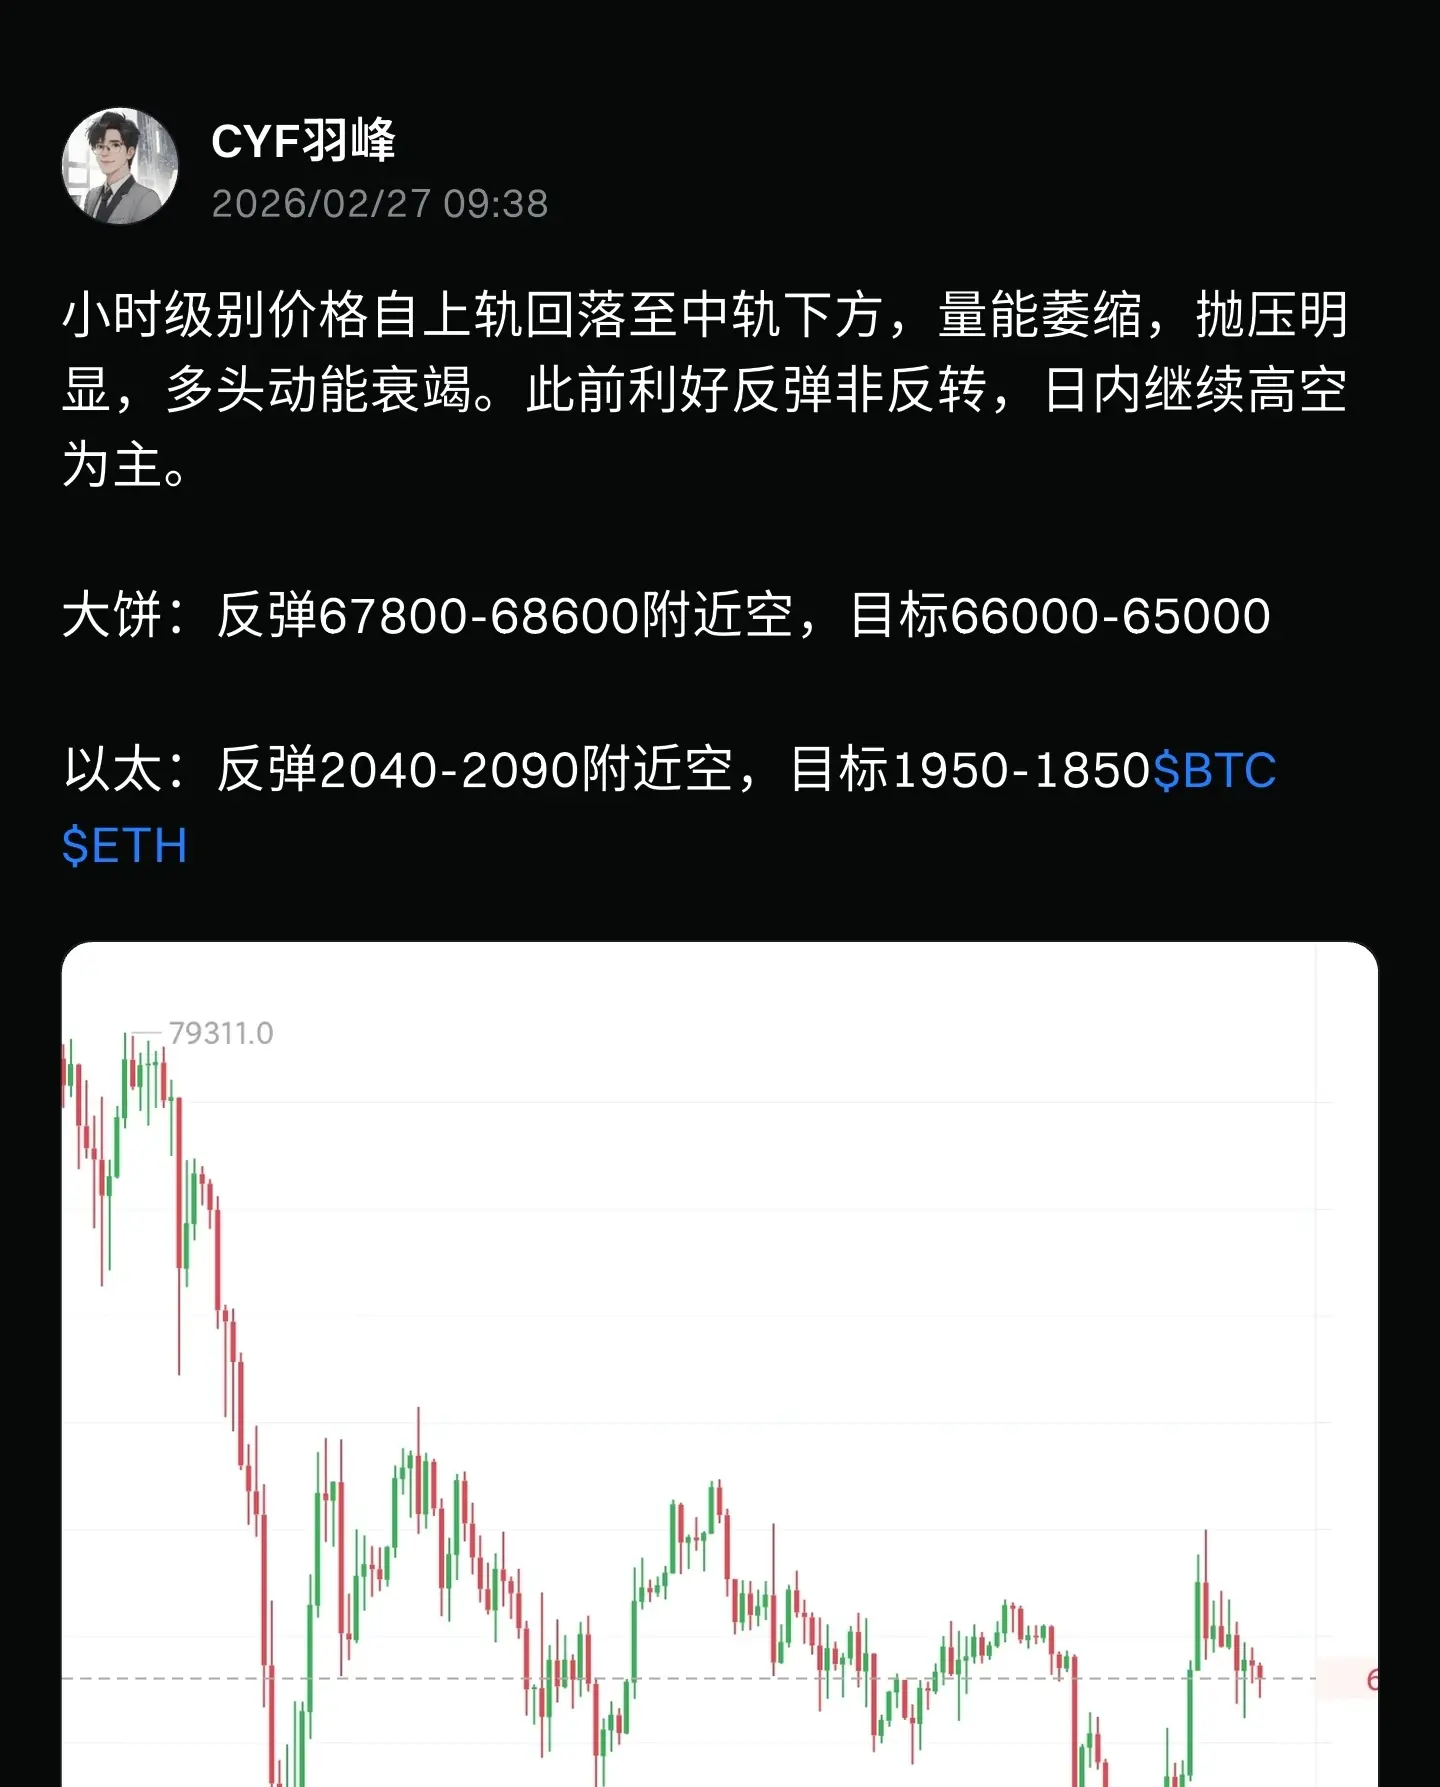
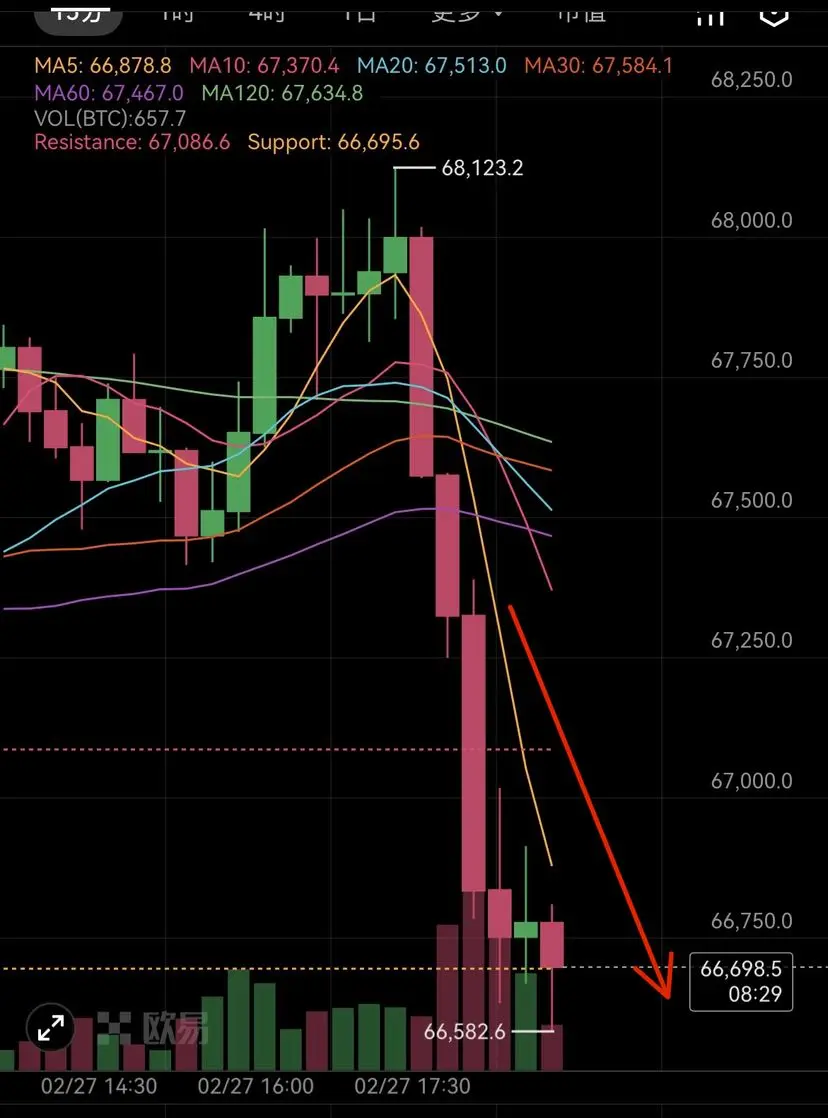
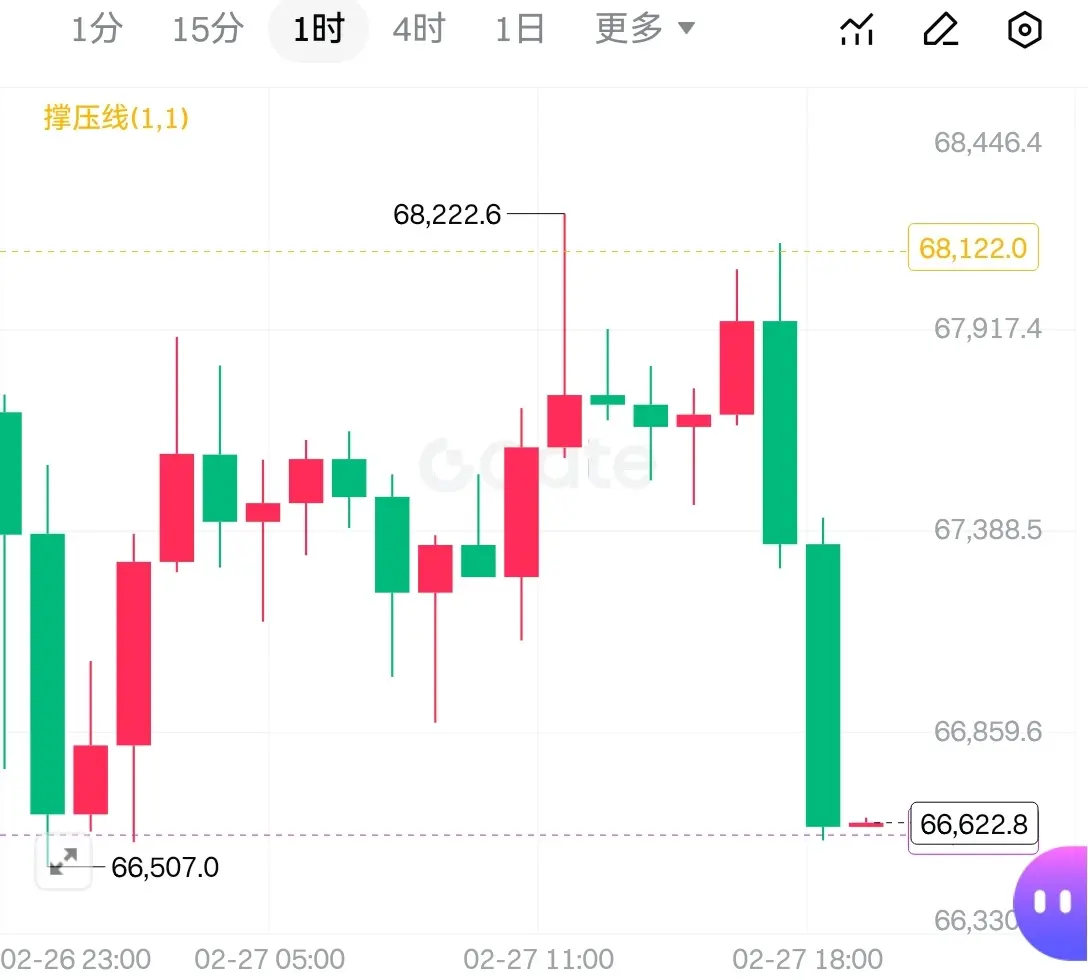
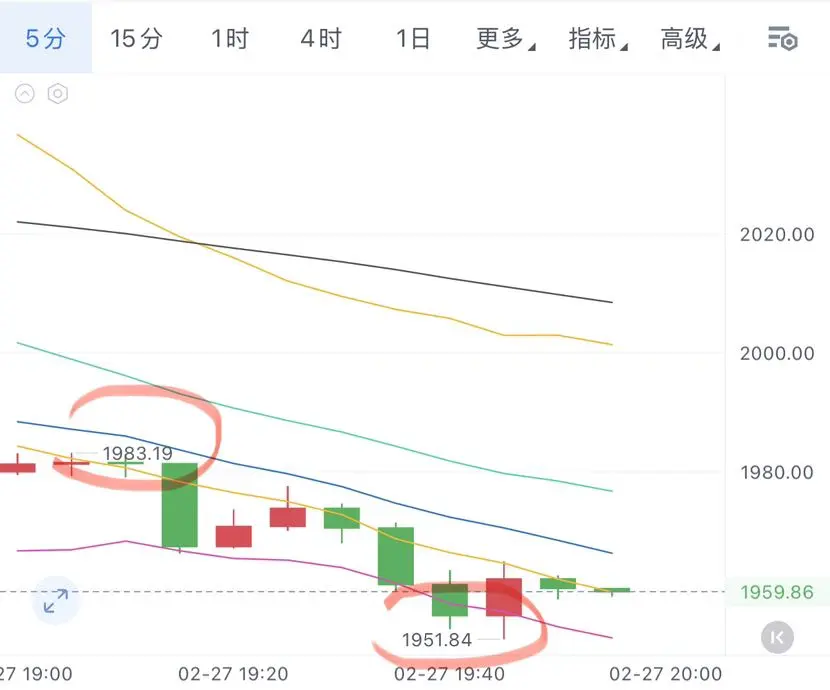
$BTC 2.27 Evening Bitcoin and Ethereum Market Analysis and Trading Suggestions
From a technical perspective, the four-hour chart shows clear bearish signals. The current candlestick forms a strong large bearish body, sharply declining toward the middle band support of the Bollinger Bands. Although it appears to be testing the lower support level, the downward momentum seems weak, lacking effective stabilization or rebound energy. Regarding the MACD indicator, the momentum bars continue to shrink, clearly indicating that the bullish strength is gradually waning; at the same time, the fast and s
From a technical perspective, the four-hour chart shows clear bearish signals. The current candlestick forms a strong large bearish body, sharply declining toward the middle band support of the Bollinger Bands. Although it appears to be testing the lower support level, the downward momentum seems weak, lacking effective stabilization or rebound energy. Regarding the MACD indicator, the momentum bars continue to shrink, clearly indicating that the bullish strength is gradually waning; at the same time, the fast and s
BTC-3.37%
- Reward
- like
- Comment
- Repost
- Share
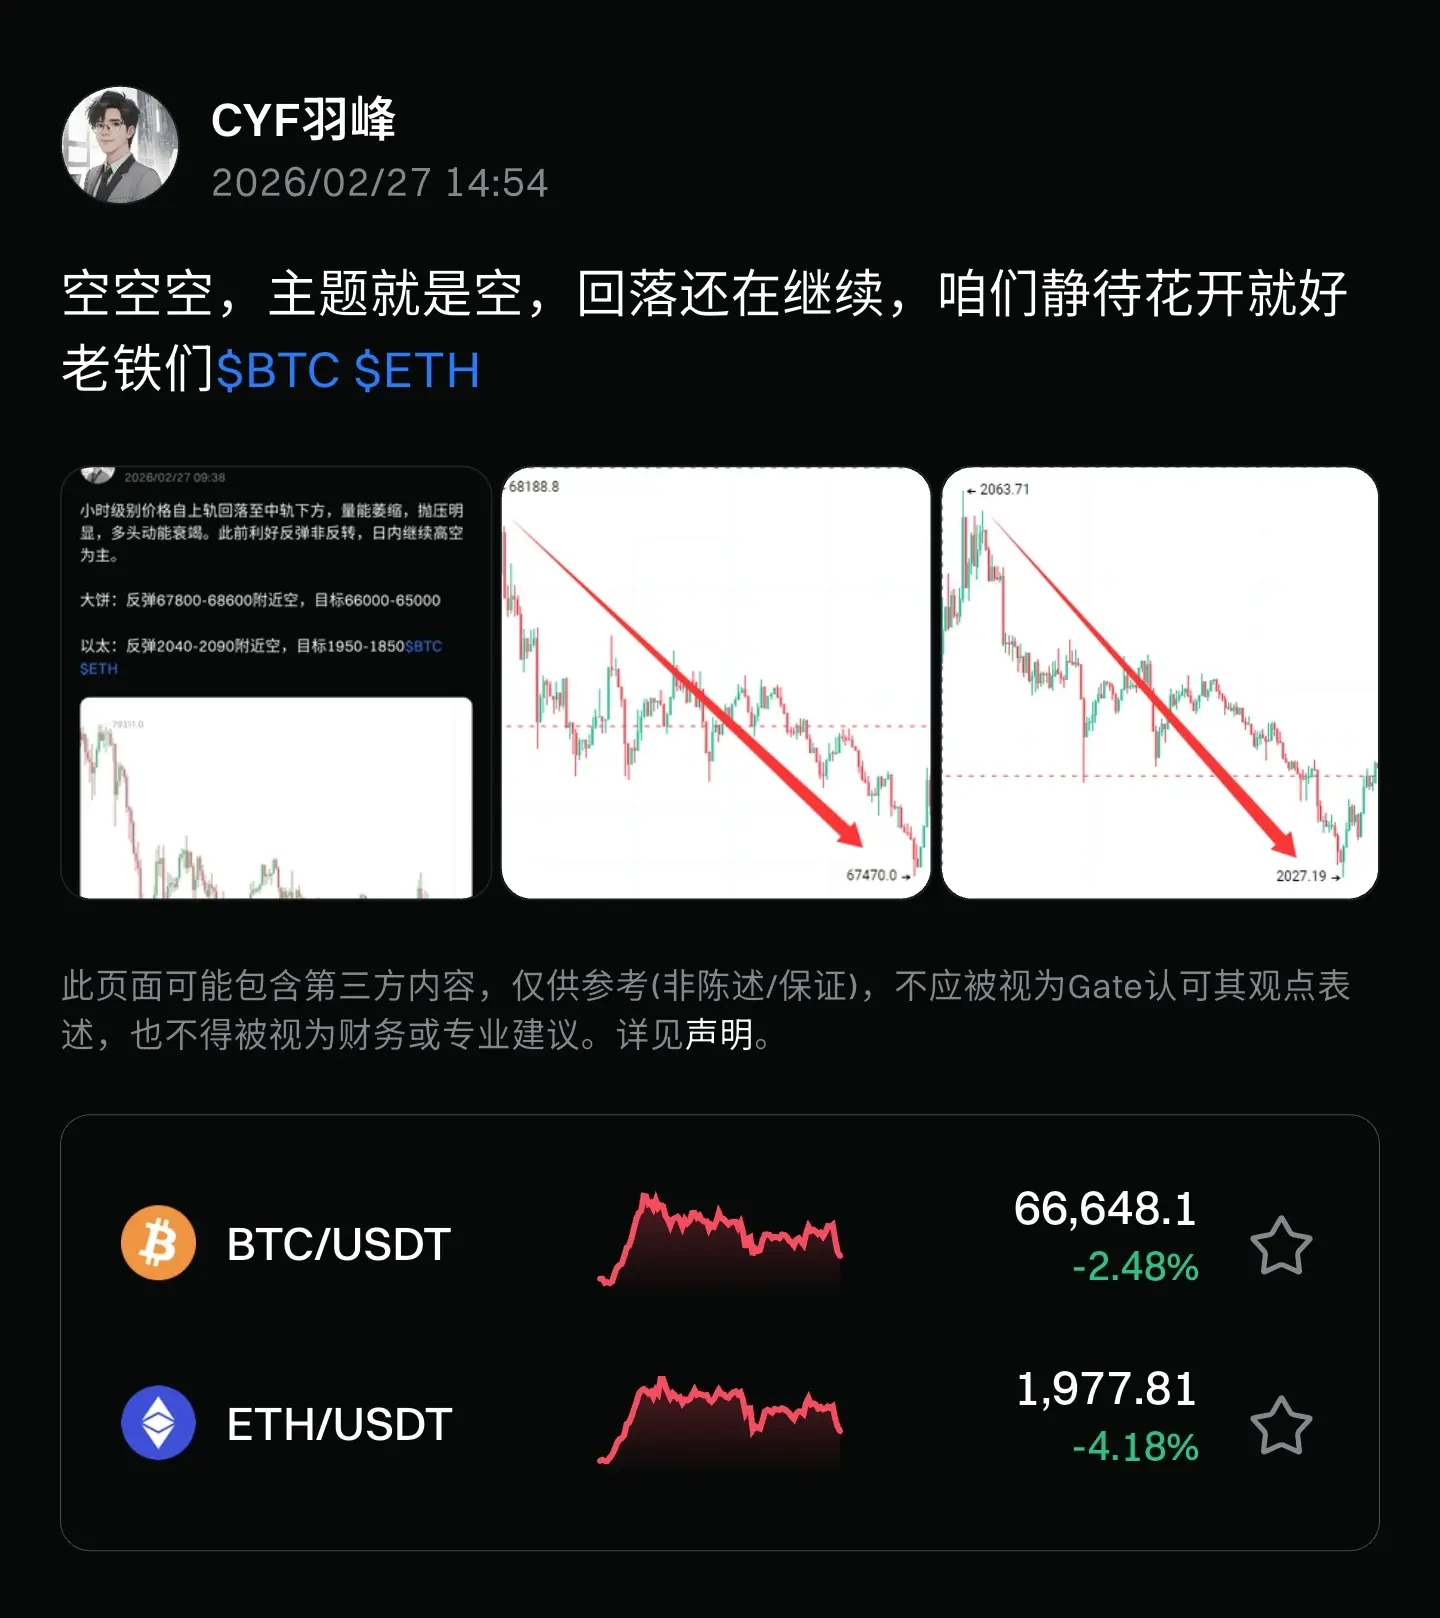
Evening KONG Perfect Landing🛬
The key to good luck is to first change your mindset, no longer focusing on your misfortune and bad luck, but paying attention to those small yet joyful moments. As long as you genuinely believe you're doing well and trust that you are lucky, good things will come.
View OriginalThe key to good luck is to first change your mindset, no longer focusing on your misfortune and bad luck, but paying attention to those small yet joyful moments. As long as you genuinely believe you're doing well and trust that you are lucky, good things will come.
- Reward
- like
- Comment
- Repost
- Share
#CryptoSurvivalGuide
Weathering the Digital Storm: 2026 Crypto Ecosystem Strategies
As of February 2026, the crypto asset world has fully transitioned from the "quick gains" phase to an era of "strategic resilience." While market data shows Bitcoin’s struggle at the $70,000 threshold and corrections of up to 70% in altcoins, the greatest risks for investors are no longer just price fluctuations; they are information pollution and sophisticated cyber threats. Survival in this period is an art of managing psychological capital and technical security, going far beyond simply reading charts.
Macr

- Reward
- 2
- 2
- Repost
- Share
Falcon_Official :
:
2026 GOGOGO 👊View More
Load More
Join 40M users in our growing community
⚡️ Join 40M users in the crypto craze discussion
💬 Engage with your favorite top creators
👍 See what interests you
Trending Topics
View More352.58K Popularity
16.97K Popularity
55.84K Popularity
11.96K Popularity
458.2K Popularity
Hot Gate Fun
View More- MC:$2.4KHolders:10.00%
- MC:$0.1Holders:10.00%
- MC:$0.1Holders:10.00%
- MC:$2.4KHolders:10.00%
- MC:$0.1Holders:10.00%
News
View MoreBlock discloses its Q4 purchase of 340 Bitcoins, worth $22 million
2 m
Traditional Finance Alert: VIX Has Risen Over 3%
3 m
Bakkt plans to raise $48.125 million through the issuance of Class A common stock and pre-paid warrants
11 m
ETH drops below 1950 USDT
15 m
Gate Research Institute: Gold and silver prices rise to historic highs, driving significant expansion of the tokenized commodities sector
15 m