

- Topic
4k Popularity
6k Popularity
22k Popularity
35k Popularity
34k Popularity
- Pin
- 🎉【Gate Singapore Flagship Events · Square Fun Quiz Challenge Day 2】
Square fam! The Gate Singapore flagship events kick off on Oct 1, and the Token of Love stage at Gardens by the Bay is about to set the vibes on fire! 🎶
Let’s light up the Square early—who’s your pick? Cheer your favorite artist with emojis! 👇
HyunA 🐉
SUECO 🤘
KAKA 🎹
CLICK#15 🎤
💬 Comment with your favorite artist’s emoji + your mood (e.g. 🐉🔥) for a chance to win!
🎁 Rewards: 3 lucky winners → $10 BTC each
🎁 Bonus: Get all 3 days correct → Extra $10 BTC for the Super Quiz King!
This is more than a fan party—it’s the m - 💥 Gate Square Event: #PTB Creative Contest# 💥
Post original content related to PTB, CandyDrop #77, or Launchpool on Gate Square for a chance to share 5,000 PTB rewards!
CandyDrop x PTB 👉 https://www.gate.com/zh/announcements/article/46922
PTB Launchpool is live 👉 https://www.gate.com/zh/announcements/article/46934
📅 Event Period: Sep 10, 2025 04:00 UTC – Sep 14, 2025 16:00 UTC
📌 How to Participate:
Post original content related to PTB, CandyDrop, or Launchpool
Minimum 80 words
Add hashtag: #PTB Creative Contest#
Include CandyDrop or Launchpool participation screenshot
🏆 Rewards:
🥇 1st - 🌕 Gate Square · Mid-Autumn Creator Incentive Program is Live!
Share trending topic posts, and split $5,000 in prizes! 🎁
👉 Check details & join: https://www.gate.com/campaigns/1953
💝 New users: Post for the first time and complete the interaction tasks to share $600 newcomer pool!
🔥 Today's Hot Topic: #MyTopAICoin#
Altcoins are heating up, AI tokens rising! #WLD# and #KAITO# lead the surge, with WLD up nearly 48% in a single day. AI, IO, VIRTUAL follow suit. Which potential AI coins are you eyeing? Share your investment insights!
💡 Post Ideas:
1️⃣ How do you see AI tokens evolving?
2️⃣ Wh - 🌕 Gate Square · Mid-Autumn Creator Incentive Program is Now Live!
Share your creations with trending topics and get a chance to split $5,000 in rewards! 🎁
👉 Join now: https://www.gate.com/campaigns/1953
💡 How to Join:
1️⃣ Post with the hashtag #Gate Square Mid Autumn Creator Incentive# .
2️⃣ Your content should follow the daily trending topics posted by [Gate _Square], and include both hashtags.
3️⃣ The more posts, higher quality, and greater engagement — the bigger your rewards! 🚀
💰 Creator Rewards:
🏆 Top 1: Bulgari Mid-Autumn Gift Box + $100 Futures Voucher + $100 GT
🥈 Top 2: Bulgari - 🎉【Gate Singapore Flagship Event · Square Fun Quiz Challenge Day 1】
#TOKEN2049# is just around the corner, and Gate is bringing the heat to Singapore!
Token of Love Music Festival, Gate x Oracle Red Bull Racing Reception, and the F1 Race Viewing are all set to roll out!
Join Square Fun Quiz Challenge now, test how much you know about the events and share $100 BTC in rewards!
To join: Comment your answers (format: 1B 2A 3B 4C)
🎁 Rewards: 3 lucky winners each day → $10 BTC each
👑 Bonus: Answer all questions correctly for 3 days → Extra $10 BTC for Super Quiz King!
📖 Day 1 · Quiz (Single Choic
2100NEWS WEEKLY CRYPTO REPORT Aug-22
The crypto index NWST1100 recovered by 2.87% last week. Ether has outperformed other segments, surging by 44.97% in the previous thirty days.
*Below, we present a standardized weekly report and next week’s outlook, prepared based on the Theory Swingtum of intelligent finance. We gauge the crypto market’s breadth and direction by showing charts 2100NEWS Digital Assets Total Index (NWST1100), which measures 1100 (by market capitalization) significant crypto assets’ performance. The information-laden chart is complex to read initially, but it effectively displays essential price information, crucial decisive price levels, momentum, trading volumes, and crypto market breadth. Monitoring Market Sentiment and Breadth is necessary to detect early signs of trend reversals or continued strength.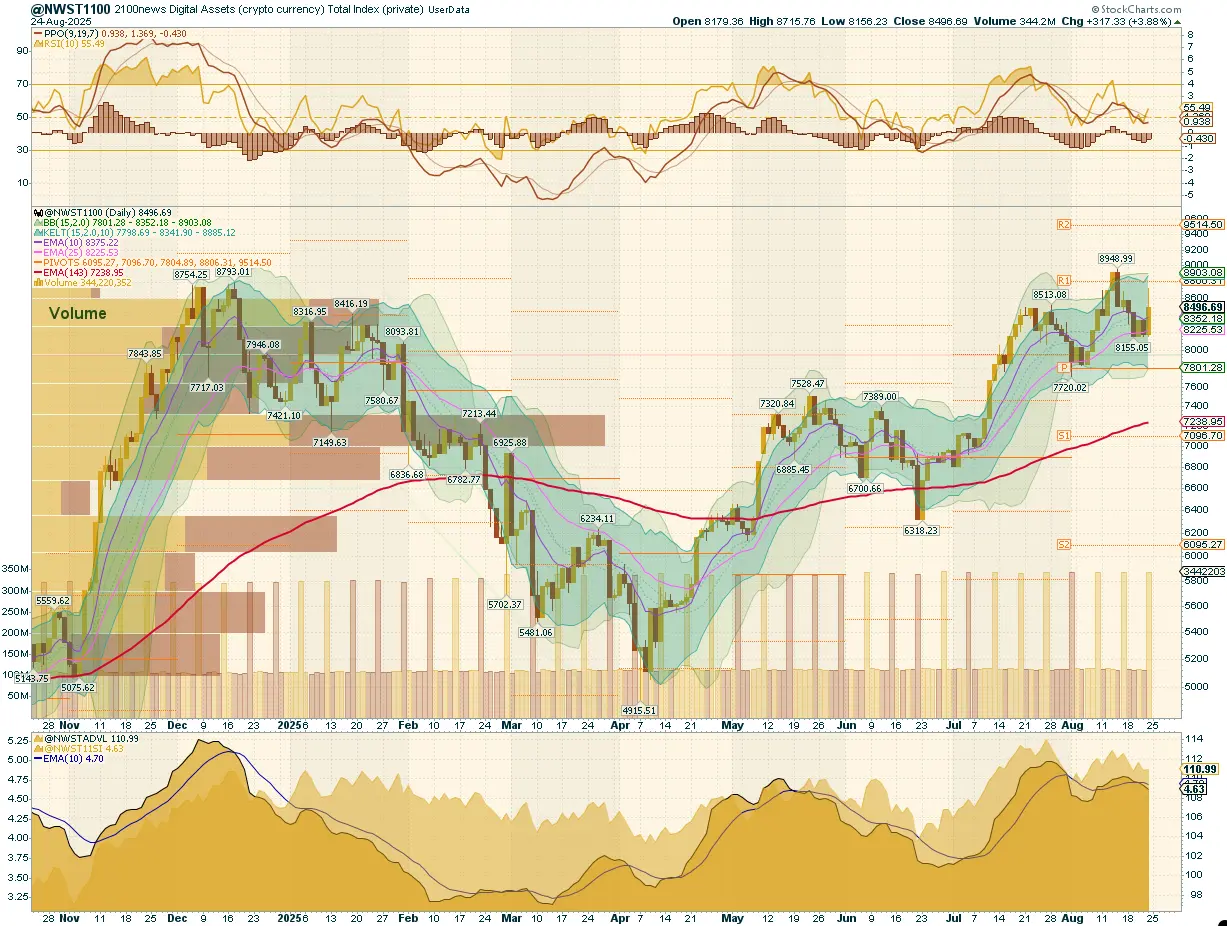
After conducting a detailed examination of the NWST1100 chart, a vital metric for the cryptocurrency market, several essential market dynamics and changes in market sentiment are revealed:
The NWST1100 gained 2.87% last week. After retreating from earlier highs, the index stabilized and rebounded midweek, closing near 8,496. Price action fluctuated within the upper Keltner Band, with resistance clustered around R1 (~8,800) and support near the 25-day EMA (~8,150). The rejection at the upper boundary earlier in August signaled that the rally had matured, and since then, the market has settled into a volatile range-bound consolidation.
Market Sentiment (PPO & RSI): The PPO lines remain positive but are flattening, while the histogram recovered toward zero, reflecting waning momentum. The RSI hovered in neutral territory, finishing the week at 55, confirming that upside strength has cooled.
Crypto Market Breadth indicators at the bottom of the chart, including the Advance-Decline Volume Line (ADVPL) and the McClellan Summation Index, slipped modestly, highlighting a lack of thrust in breadth.
According to the chart on the right, all A50R indicators across all major segments (NWST1100, NWSET100, NWSL100, NWSCo100) have risen; 53% of NWST1100 constituents are above their 50-day EMA. Large Caps (NWSL100) and Ethereum-based tokens (NWSET100) remain the strongest cohorts, with 67–69% above their 50-day averages. This confirms that the rebound is selective and quality-driven, concentrated in large-cap and Ethereum-linked assets, while broader speculative segments still underperform.
This breadth indicator measures the percentage of digital assets trading above a 50-day moving average
* The percentage of digital assets trading above a specific moving average is a breadth indicator that measures internal strength or weakness in the underlying index. The chart on the right side compares the percentage of DA trading above the 50-day EMA for:
📉 Summary
In Summary, the crypto market staged a rebound within its broader consolidation phase. Yet, the approach of significant resistance levels warrants caution. Momentum is fading, breadth is hesitant, and the market remains range-bound — conditions where traders must shift from chasing upside to managing risk and preserving gains.
Outlook for this week
This report examines the cryptocurrency market’s short-term outlook, identifying patterns and signals that may offer insights into potential market direction. While predicting market behavior is inherently uncertain, discernible trends in momentum and market breadth indicators suggest possible developments.
📌 Target and Scenario Considerations:
Most likely scenario: The NWST1100 drifts downward within the range channel defined by the 25-day EMA and Resistance R1, with a test of the lower boundary near 25-day EMA (~8,200). If this test occurs before Friday, a relief rally from the lower boundary is likely — but such a rebound would remain capped near resistance R1 and should not be mistaken for the start of a new trend leg.📍 Key levels to watch:
Resistance: 8,800 (Pivot R1)
Support: 8,200 (EMA25), 7,800 (Pivot P)
Performance of different groups of Digital Assets (Coins and Tokens)
Investors and traders often rely on historical performance data to make informed decisions about their cryptocurrency holdings. After analyzing the data in the table, it is evident that the crypto market has rebounded, with the overall index recovering by 2.87% over the last week.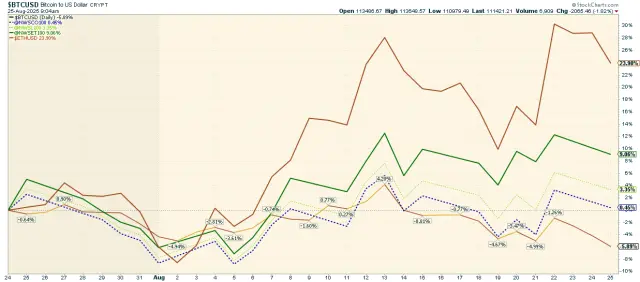 The chart above highlights the performance of various cryptocurrencies, including Bitcoin, Ether, and the 2100NEWS Indices, which represent the performance of Ethereum-based tokens (NWSET100), large caps (NWSL100), and Coins (NWSCo100). Among these, Ether stood out, significantly outperforming other segments with a remarkable 23.90% gain over the past thirty days.
While the broader market has rebounded, different segments and individual cryptocurrencies exhibit different performance dynamics.
Performance Trends by Market Segment:
✔ Ether, NWSET100 (Ethereum-based tokens), NWS30, and NWSL100 (Large Caps) led the market**,**
✔ NWSBE, Bitcoin, and NWSCo100 (Coins) lagged.
Investors and traders might use this information to adjust their portfolios, possibly shifting focus toward assets with stronger relative momentum while being cautious about those in the Weakening quadrant.
*RRG® charts show the relative strength and momentum of groups of digital assets. Those with strong relative strength and momentum appear in the green Leading quadrant. As relative momentum fades, they typically move into the yellow Weakening quadrant. If relative strength then fades, they move into the red Lagging quadrant. Finally, when momentum picks up again, they shift into the blue Improving quadrant.
Crypto (Digital Assets) compared with global equity
This report offers a comprehensive analysis comparing the performance of digital assets, as signified by the NWST1100 index, to shares on global capital markets, as represented by the Dow Jones Global W1Dow index. The comparison spans various timeframes, providing insights into both historical and recent performances, as well as potential future trends.
Let’s break down the key observations and implications:
The recent rally highlights the importance of tracking market swings. Historically, the best opportunities have emerged when sentiment was weakest and prices were below the 143-day EMA. Conversely, when the market rallies strongly and extends far above the 143-day EMA, as it is now, it is often prudent to start building cash reserves to take advantage of future pullbacks.
*The box in the middle of the chart shows the original NWST1100 price; at the bottom is W1Dow