Crypto Bear Flag Pattern: A Key Signal for Market Trends
What Are Bear Flag Patterns? How to Identify Them
Crypto traders often rely on a combination of technical indicators and astute assessment skills to forecast market movements. In this context, the bear flag pattern emerges as a pivotal tool, a key indicator that helps traders predict the continuation of a downward trend. This comprehensive guide explores bear flagging, its identification, trading strategies, and how it differs from other technical patterns in cryptocurrency trading.
What is a bear flag pattern?
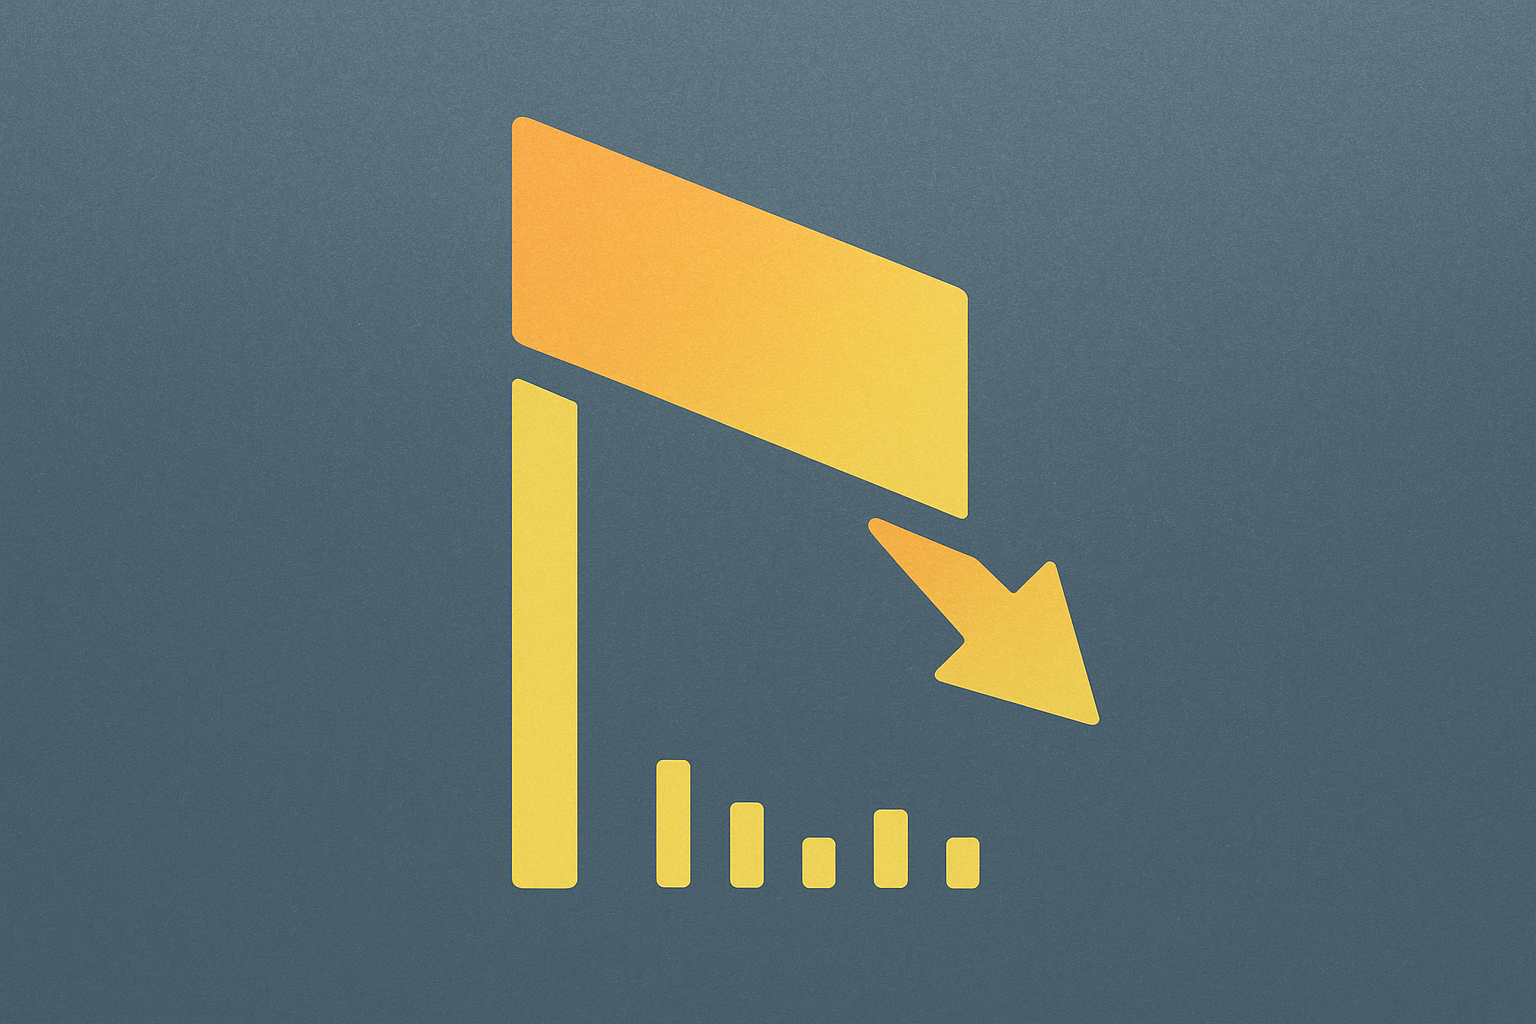
The bear flag candlestick pattern is a continuation pattern that signals the likely resumption of a downward price trend. After the pattern completes, prices typically continue moving in the same direction as before the pattern appeared—downward. This bear flagging pattern generally forms over a period of days to weeks, providing traders with opportunities to enter short positions following the downward breakout.
Traders can identify a bear flag pattern by recognizing three fundamental elements. The first element is the flagpole, which is formed by a sharp and significant price drop. This steep decline indicates strong selling pressure and represents a rapid shift in market sentiment toward the bearish side. The second element is the flag itself, which follows the pole and is characterized by a short period of consolidation with smaller price movements, typically taking a slight upward or sideways trajectory. This phase represents a temporary slowdown in downward momentum, where the market appears to be taking a brief pause. The final element is the breakout, which occurs when the price breaks below the lower trend line of the flag pattern, signifying a continuation of the initial bearish trend and often leading to further declines in price.
Traders can also use the relative strength index (RSI), a momentum indicator, to confirm a bear flag pattern. An RSI declining to levels below 30 going into the flag formation can be a strong indication that the downtrend has sufficient strength to activate the pattern successfully.
How to trade crypto with a bear flag pattern
Trading cryptocurrency using a bear flagging chart pattern involves recognizing the formation and implementing strategies that capitalize on the anticipated continuation of the downward trend. Several key trading strategies can be employed during a bear flag pattern.
Short selling is a primary strategy where traders enter a short position by selling a cryptocurrency with the expectation that its price will continue to fall, allowing them to buy back at a lower price. The ideal entry point for a short position is typically just after the price breaks below the lower boundary of the flag.
Setting stop losses is crucial for risk management. Traders should place a stop-loss order above the flag's upper boundary to limit potential losses if the price unexpectedly reverses and starts to rise. The stop-loss should be set at a level that allows some flexibility for price movement while protecting the potential profit from the trade.
Profit targets are essential for maintaining a disciplined trading approach. Traders often set their profit target based on the height of the flagpole, projecting this distance downward from the breakout point.
Confirming with volume provides additional validation of the bear flagging pattern. A valid bearish flag pattern typically exhibits high trading volume during the pole's formation, lower volume during the flag's consolidation phase, and a subsequent increase in volume at the breakout point, which confirms the pattern's strength and trend continuation.
Combining with other indicators enhances trading decisions. Traders frequently combine the bear flag pattern with technical indicators such as moving averages, RSI, or moving average convergence divergence (MACD) to confirm the bearish trend and gain additional insights into market momentum and potential reversal points. Some traders also utilize Fibonacci retracement to confirm the pattern and gauge the downtrend's strength. In a textbook example of bear flagging, the flag shouldn't exceed the flagpole's 50% Fibonacci retracement, with the retracement typically ending at roughly 38.2%, indicating that the brief upward move doesn't recover much lost ground before heading lower again. A shorter flag generally indicates a stronger downtrend and breakout.
Pros and cons of the bear flag pattern
The bear flag pattern, while popular among traders, presents both advantages and disadvantages that should be carefully considered when incorporating this tool into trading strategies.
The advantages of bear flagging patterns include predictive clarity, as the pattern provides clear indication of a continuing downtrend, helping traders anticipate and prepare for further price declines. It offers a structured approach with defined entry and exit points—the breakout from the flag's lower boundary serves as an entry point for a short position, while a stop-loss can be placed above the flag's upper boundary, providing a disciplined trading framework. The pattern demonstrates versatility across time frames, as traders can identify it in various periods from short-term intraday charts to long-term historical data, making it suitable for different trading styles. Additionally, the pattern benefits from volume confirmation, as it is often accompanied by specific volume trends that add an extra layer of validation for traders.
However, there are notable disadvantages. False breakouts can occur where the price doesn't continue to drop as expected, potentially leading to losses. The high market volatility characteristic of crypto markets can disrupt the formation of the pattern or lead to rapid, unexpected reversals. There is a need for supplementary analysis, as relying solely on the bear flag pattern can be risky—experts often advise traders to use additional indicators to confirm the pattern and strengthen their trading strategies. Finally, timing challenges present difficulties in identifying the perfect moment to enter or exit a trade based on bear flagging, especially in the fast-moving crypto market where delays can significantly impact the trade's outcome.
Bear flag versus bull flag: Key differences
A bull flag represents the inverse of a bear flag, where the flagpole is an upward trending line, the flag is a temporary downward consolidation, and prices ultimately break out into an uptrend. However, several key differences distinguish these two patterns.
In terms of pattern appearance, bear flagging patterns are characterized by a steep decline in price followed by a consolidating, slightly upward, or sideways pattern, while bull flags are identified by a sharp increase in price followed by a downward or sideways consolidation phase.
Regarding expectation after pattern completion, bear flags predict a continuation of the bearish trend with prices expected to break below the flag's lower boundary, whereas bull flags suggest a resumption of the bullish trend with prices anticipated to break above the flag's upper boundary.
The volume trend differs between the two patterns. Bear flagging typically shows high trading volume during the pole's formation and lower volume during the flag phase, with an increase in volume at the breakout point downward. Bull flags also display high volume during the pole formation and reduced volume during the flag, but with an increase in volume during the upward breakout.
Finally, trading strategies vary based on market sentiment. During bearish market conditions, traders might consider short selling at the breakout below the flag or exiting long positions in anticipation of a continued price drop. However, during bullish conditions, traders often look to enter long positions or buy at the breakout above the flag, expecting further price increases.
Conclusion
The bear flag pattern serves as a valuable technical analysis tool for cryptocurrency traders seeking to identify and capitalize on continuing downward trends. By understanding bear flagging and its three fundamental components—the flagpole, flag, and breakout—traders can better position themselves to make informed trading decisions. While the pattern offers predictive clarity, structured trading approaches, and versatility across different time frames, traders must remain aware of its limitations, including the possibility of false breakouts and the challenges posed by high market volatility. Successful implementation of bear flagging trading requires combining this pattern with other technical indicators, proper risk management through stop-losses, and disciplined profit-taking strategies. By distinguishing between bear flags and their bullish counterparts, traders can adapt their strategies to different market conditions and enhance their overall trading performance in the dynamic cryptocurrency market.
FAQ
What does bear flagging mean?
Bear flagging is a chart pattern indicating a brief pause in a downtrend, followed by further price decline. It consists of a sharp drop (flag pole) and a consolidation phase (flag), suggesting continued bearish momentum.
What does the bear flag mean?
In crypto, a bear flag indicates a potential downward price trend. It forms after a sharp decline, followed by a brief consolidation period, suggesting further bearish movement.
Is a bear flag bullish or bearish?
A bear flag is bearish. It indicates a potential continuation of a downward trend after a brief consolidation period.
What usually happens after a bear flag?
After a bear flag, prices typically continue to decline, often leading to a further drop in the market. This pattern signals a continuation of the downtrend.
Share
Content
How to Buy Cryptocurrency


Trending Cryptocurrencies


XZXX: A Comprehensive Guide to the BRC-20 Meme Token in 2025

Bitcoin Fear and Greed Index: Market Sentiment Analysis for 2025

Top Crypto ETFs to Watch in 2025: Navigating the Digital Asset Boom

5 ways to get Bitcoin for free in 2025: Newbie Guide

Bitcoin Market Cap in 2025: Analysis and Trends for Investors

2025 Bitcoin Price Prediction: Trump's Tariffs' Impact on BTC

Accepting Digital Currency Payments for Your Business

What is the current crypto market overview: rankings, supply, 24h trading volume, and liquidity?

Introduction to Simulated Trading for New Investors
# How Does Cryptocurrency Price Volatility Impact Your Trading Strategy?

Understanding Web3 Identity Verification: The Proof of Humanity Protocol Explained