2025 SEND Price Prediction: Expert Analysis and Market Forecast for the Coming Year

Introduction: SEND's Market Position and Investment Value
Suilend (SEND) is a lending and borrowing platform on Sui, representing an important infrastructure component in the Sui ecosystem. Since its launch in December 2024, SEND has quickly established itself as a key protocol within the Sui network. As of December 2025, SEND's market capitalization has reached approximately $10.69 million, with a circulating supply of approximately 48.72 million tokens and a current price maintained around $0.2194.
This article will comprehensively analyze SEND's price trends through 2030, incorporating historical patterns, market supply and demand dynamics, ecosystem development, and macroeconomic environments to provide investors with professional price forecasts and practical investment strategies.
I. SEND Price History Review and Current Market Status
SEND Historical Price Evolution Trajectory
-
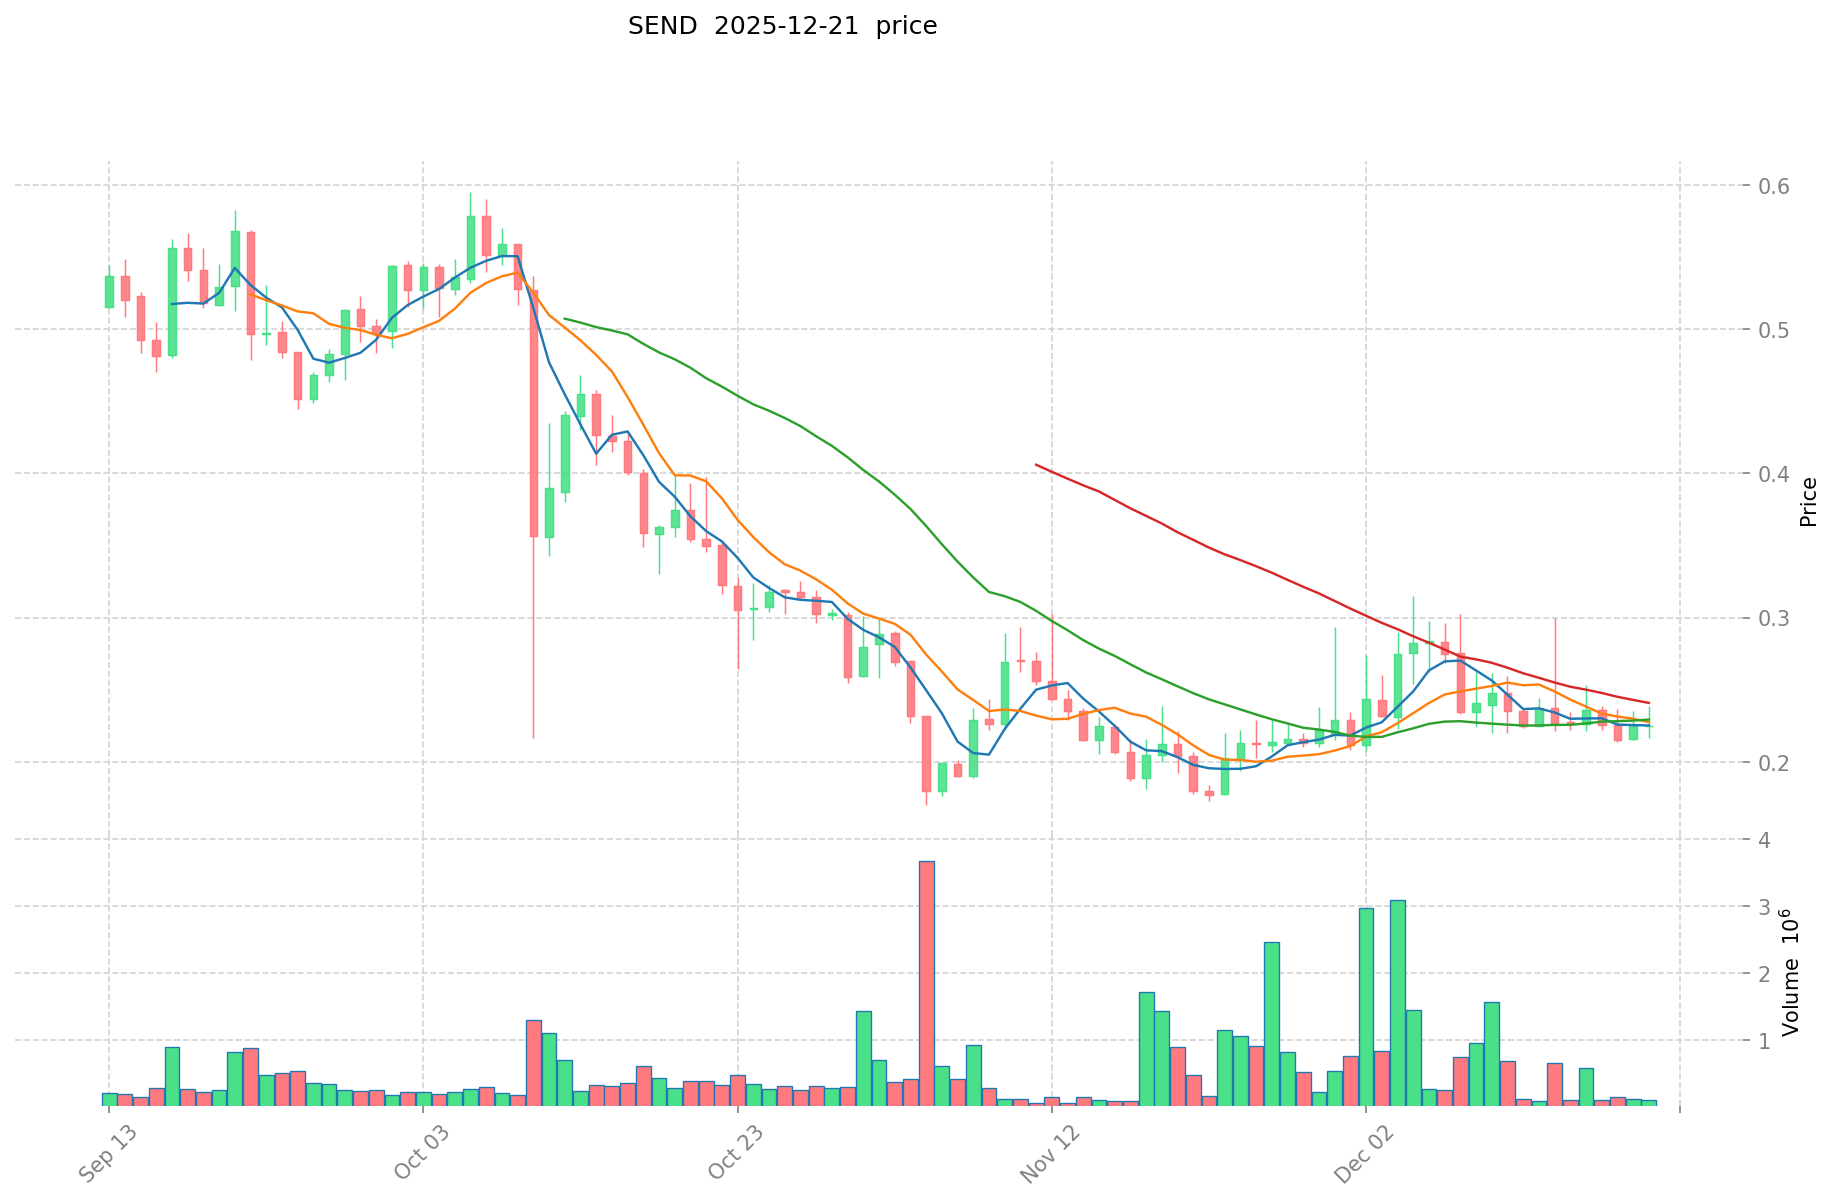
December 2024: SEND reached its all-time high of $150 on December 12, 2024, marking the peak of its initial market valuation following the token launch.
-
November 2025 to Present: The token experienced significant correction, reaching its all-time low of $0.1697 on November 4, 2025, representing a decline of approximately 88.69% from its peak, reflecting substantial market pullback over the following months.
SEND Current Market Status
As of December 22, 2025, SEND is trading at $0.2194, showing marginal positive momentum with a 0.18% increase in the past 24 hours. The token demonstrated resilience despite broader market headwinds, with a 24-hour price range between $0.2119 and $0.2341.
Key Market Metrics:
- Market capitalization: $10,689,176.9954
- Fully diluted valuation: $21,940,000
- 24-hour trading volume: $26,676.80
- Circulating supply: 48,720,041 SEND tokens (48.72% of total supply)
- Total supply: 100,000,000 SEND tokens
- Market dominance: 0.00068%
- Current holder base: 7,516 addresses
Performance Overview:
- 1-hour change: -1.39%
- 7-day change: -5.93%
- 30-day change: +21.41% (strongest recent recovery period)
- 1-year change: -91.55% (significant long-term depreciation)
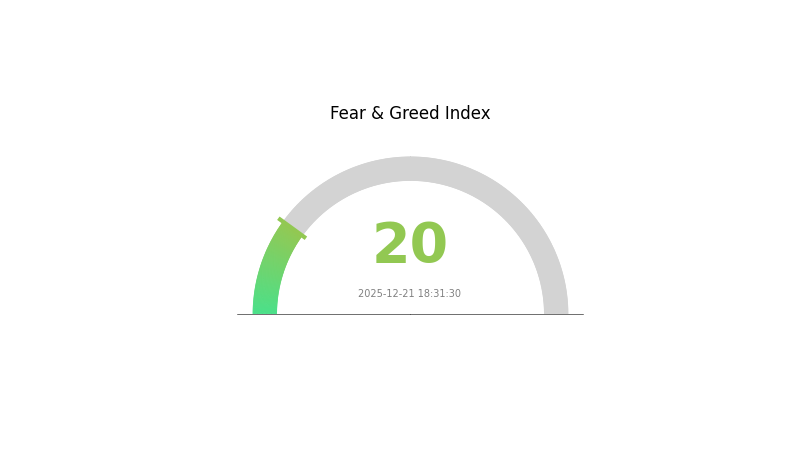
SEND trades on 5 exchanges with moderate liquidity. The market sentiment currently reflects extreme fear conditions (VIX: 20 as of December 21, 2025), which may be contributing to the cautious trading environment.
Click to view current SEND market price
SEND Market Sentiment Indicator
2025-12-21 Fear and Greed Index: 20 (Extreme Fear)
Click to view current Fear & Greed Index
The SEND market is currently experiencing extreme fear, with the Fear and Greed Index hitting 20. This indicates heightened market anxiety and significant selling pressure. Such extreme fear levels often present contrarian opportunities for long-term investors, as markets tend to overreact during panic periods. Cautious investors may consider dollar-cost averaging into positions, while risk-averse traders should maintain defensive positioning. Monitor key support levels closely and await signs of stabilization before increasing exposure. Historical patterns suggest extreme fear readings can precede market reversals, but patience and risk management remain essential during volatile periods.
SEND Holding Distribution
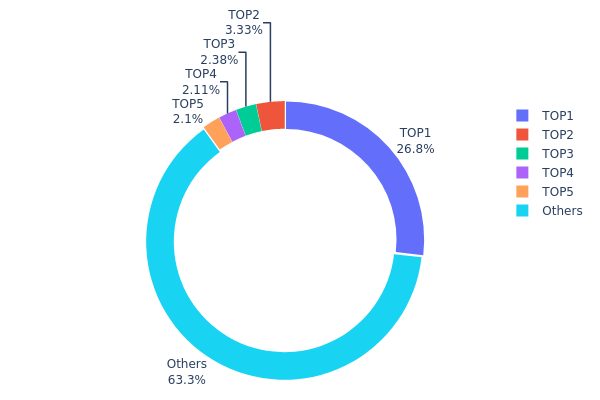
The address holding distribution chart illustrates the concentration of token ownership across the blockchain network by tracking the allocation of SEND tokens among individual addresses. This metric serves as a critical indicator for assessing the decentralization level and potential vulnerability to market manipulation, providing insights into how evenly or unevenly token supply is distributed among token holders.
The current holding distribution of SEND demonstrates a moderate concentration pattern with mixed implications for market structure. The top holder commands 26.80% of total supply, while the second through fifth largest holders collectively account for approximately 10% of circulation. This concentration in the top address is noteworthy, though the remaining 63.30% of tokens distributed across other addresses suggests a meaningful degree of decentralization. The distribution pattern indicates that while a single dominant holder exists, the majority of token supply remains dispersed, which mitigates concerns about extreme centralization that might enable unilateral price manipulation or sudden liquidation events.
From a market dynamics perspective, this holding structure presents a balanced risk profile. The top holder's substantial position does introduce potential price volatility and concentration risk, yet the significant proportion held by dispersed addresses provides a stabilizing counterbalance. The relatively healthy distribution among the remaining holders suggests that SEND maintains sufficient decentralization to support organic market functioning, though ongoing monitoring of the largest holder's activities would be prudent for assessing potential on-chain governance implications and price pressure scenarios.
Visit the current SEND Holdings Distribution on Gate.com
| Top | Address | Holding Qty | Holding (%) |
|---|---|---|---|
| 1 | 0xb1ff...783c25 | 26803.48K | 26.80% |
| 2 | 0xc118...cd6097 | 3333.33K | 3.33% |
| 3 | 0x708d...051edf | 2379.86K | 2.37% |
| 4 | 0x7729...e340c5 | 2110.29K | 2.11% |
| 5 | 0x53a7...b00b24 | 2095.90K | 2.09% |
| - | Others | 63277.13K | 63.3% |
II. Core Factors Affecting SEND's Future Price
Supply Mechanism
-
Token Scarcity: SEND's future price is primarily influenced by supply scarcity, which constrains the available tokens in circulation and affects market dynamics.
-
Market Demand: The relationship between supply scarcity and market demand creates price pressure. Limited token availability combined with increasing demand from participants in the crypto lending market drives price appreciation.
Macroeconomic Environment
-
Monetary Policy Impact: Federal Reserve policy expectations significantly influence risk asset valuations. Loose monetary policies with lower interest rates and increased money supply enhance market liquidity, potentially attracting more capital into cryptocurrencies. Conversely, tightening monetary conditions reduce available investment capital for risk assets like SEND.
-
Risk Sentiment Dynamics: Market trading behavior becomes cautious amid macroeconomic uncertainty. Investors tend to reduce exposure to high-risk assets during periods of economic slowdown, which can negatively impact SEND's price performance.
III. 2025-2030 SEND Price Forecast
2025 Outlook
- Conservative Prediction: $0.1185-$0.1850
- Neutral Prediction: $0.1850-$0.2194
- Optimistic Prediction: $0.2194-$0.2830 (requires sustained ecosystem development and increased adoption)
2026-2028 Mid-term Outlook
- Market Stage Expectations: Gradual recovery and growth phase with increasing institutional interest and protocol upgrades
- Price Range Forecast:
- 2026: $0.2361-$0.3743 (14% upside from 2025 baseline)
- 2027: $0.1845-$0.4347 (42% upside potential)
- 2028: $0.2841-$0.5195 (70% upside potential)
- Key Catalysts: Enhanced tokenomics implementation, strategic partnerships, expansion of use cases within the ecosystem, and broader market sentiment improvements
2029-2030 Long-term Outlook
- Base Case Scenario: $0.3037-$0.4824 (103% upside by 2029; assumes moderate adoption and consistent protocol development)
- Optimistic Scenario: $0.4466-$0.5899 (111% upside by 2030; assumes accelerated enterprise adoption and market capitalization growth)
- Transformative Scenario: $0.5899+ (assumes breakthrough network effects, significant regulatory clarity, and mainstream institutional adoption)
- December 22, 2025: SEND trading consolidates within mid-range ($0.2194 average), awaiting catalysts for directional clarity
| 年份 | 预测最高价 | 预测平均价格 | 预测最低价 | 涨跌幅 |
|---|---|---|---|---|
| 2025 | 0.28303 | 0.2194 | 0.11848 | 0 |
| 2026 | 0.37431 | 0.25121 | 0.23614 | 14 |
| 2027 | 0.43474 | 0.31276 | 0.18453 | 42 |
| 2028 | 0.51951 | 0.37375 | 0.28405 | 70 |
| 2029 | 0.48236 | 0.44663 | 0.30371 | 103 |
| 2030 | 0.58991 | 0.46449 | 0.24618 | 111 |
Suilend (SEND) Professional Investment Strategy and Risk Management Report
IV. SEND Professional Investment Strategy and Risk Management
SEND Investment Methodology
(1) Long-term Holding Strategy
- Suitable investors: DeFi protocol believers, Sui ecosystem supporters, long-term cryptocurrency portfolio builders
- Operational recommendations:
- Accumulate SEND tokens during market downturns, leveraging the current -91.55% year-over-year decline as a potential entry point for patient capital
- Dollar-cost averaging approach: allocate fixed amounts monthly to reduce timing risk and smooth average acquisition costs
- Participate in Suilend's lending/borrowing platform to generate yield while holding SEND, creating passive income streams from your position
- Store holdings securely on Gate Web3 Wallet for non-custodial asset management with full security control
(2) Active Trading Strategy
- Technical analysis tools:
- Support and Resistance Levels: Monitor the 24-hour trading range ($0.2119 - $0.2341) and all-time low ($0.1697) as critical price zones for buy/sell signals
- Volume analysis: Track the $26,676.80 daily trading volume against historical averages to identify breakout opportunities or consolidation patterns
- Wave trading key points:
- Entry signals: Consider accumulation when price approaches the all-time low of $0.1697, particularly during broader market corrections
- Exit targets: Set profit-taking levels at 30-50% gains above entry points given the asset's high volatility profile
SEND Risk Management Framework
(1) Asset Allocation Principles
- Conservative investors: 0.5-1% of total crypto portfolio
- Active investors: 1-3% of total crypto portfolio
- Professional investors: 3-5% of total crypto portfolio
(2) Risk Hedging Solutions
- Position sizing limits: Never exceed your predetermined percentage allocation regardless of market sentiment, maintaining disciplined portfolio management
- Rebalancing schedule: Review quarterly to maintain target allocation percentages and lock in gains if SEND outperforms expectations
(3) Secure Storage Solutions
- Hot wallet recommendation: Gate Web3 Wallet for frequent trading and yield farming participation on Suilend protocol
- Cold storage approach: Transfer long-term holdings to secure offline storage solutions, keeping only active trading amounts in hot wallets
- Security considerations: Enable multi-factor authentication on all exchange accounts, use hardware signing for large transfers, never share private keys or seed phrases, and verify all contract addresses before token transfers
V. SEND Potential Risks and Challenges
SEND Market Risk
- Extreme volatility: SEND has experienced a catastrophic 91.55% decline over one year and 99.4% drop from its all-time high of $150, indicating severe market instability and speculative trading dynamics
- Liquidity constraints: With only $26,676.80 in daily 24-hour trading volume across 5 exchanges, large position exits could face significant slippage and price impact
- Small market capitalization: At $10.69 million fully diluted valuation, SEND remains highly susceptible to manipulation and sentiment-driven price swings
SEND Regulatory Risk
- DeFi protocol uncertainty: Lending protocols face evolving regulatory scrutiny regarding compliance with securities laws and consumer protection requirements across jurisdictions
- Sui blockchain regulatory exposure: Regulatory changes affecting the Sui network could directly impact SEND token utility and platform operations
- Cross-border compliance challenges: Operating across multiple jurisdictions creates exposure to conflicting regulatory frameworks and potential enforcement actions
SEND Technical Risk
- Smart contract vulnerabilities: Lending protocols require robust security audits; any undiscovered exploits could result in protocol compromises and token devaluation
- Blockchain dependency: SEND's functionality is entirely dependent on Sui network stability and continued development; network disruptions directly impact platform operations
- Competitive pressure: The DeFi lending space faces intense competition from established protocols; failure to innovate could lead to user migration and reduced platform utility
VI. Conclusions and Action Recommendations
SEND Investment Value Assessment
Suilend (SEND) represents a high-risk, speculative investment opportunity within the Sui ecosystem. The token's fundamental value proposition is tied to its role in the Suilend lending protocol, creating genuine utility for users participating in DeFi. However, the -91.55% year-over-year decline and extreme volatility from its $150 all-time high warrant extreme caution. The relatively small market cap ($10.69 million) and limited daily trading volume ($26,676.80) create both opportunity for significant upside appreciation and substantial downside risk. Investors should view SEND primarily as a long-term ecosystem bet on Sui's DeFi adoption rather than a near-term trading vehicle.
SEND Investment Recommendations
✅ Beginners: Start with minimal exposure (0.25-0.5% of crypto portfolio), use dollar-cost averaging over 3-6 months, and treat as experimental capital you can afford to lose entirely. Prioritize learning about the Suilend protocol and Sui ecosystem before increasing positions.
✅ Experienced investors: Allocate 1-3% based on your risk tolerance, employ technical analysis for tactical entry/exit timing around support levels, and consider yield generation through Suilend platform participation as a return enhancement strategy.
✅ Institutional investors: Conduct thorough due diligence on Suilend protocol security, team competence, and Sui ecosystem adoption metrics. Structure positions with clearly defined risk parameters, position sizing limits, and quarterly rebalancing protocols to manage downside exposure.
SEND Trading Participation Methods
- Gate.com spot trading: Execute SEND/USDT and SEND/USDC trading pairs directly on Gate.com platform with competitive fees and reliable liquidity for active traders
- Suilend protocol interaction: Participate in the platform's lending and borrowing functions to earn yield on SEND holdings while maintaining your position
- Gate Web3 Wallet integration: Manage SEND tokens non-custodially through Gate Web3 Wallet, enabling direct protocol interaction and maximum security control over your assets
Cryptocurrency investment carries extreme risk. This report does not constitute investment advice. Investors must make decisions based on their personal risk tolerance and conduct comprehensive due diligence. Consider consulting professional financial advisors before making significant investments. Never invest capital you cannot afford to lose completely.
FAQ
What is the SEND token and what is its current price?
SEND token is a digital asset in the Web3 ecosystem. Its current price is $0.00002445, with 24-hour trading amount data unavailable. The token maintains stable market performance.
Will SEND token reach $1 or higher in the next 2-3 years?
Based on current market analysis, SEND token reaching $1 in 2-3 years is unlikely. The token would require over 30,000% growth, which exceeds realistic market projections for this timeframe.
What factors could drive SEND price up or down in the future?
SEND price movements depend on market sentiment, adoption growth, transaction volume, regulatory developments, and macroeconomic conditions. Positive news and increased network activity typically drive prices up, while negative sentiment and market downturns can push prices down.
How does SEND compare to other similar cryptocurrency projects?
SEND distinguishes itself through community-driven governance and emphasis on decentralization. Unlike Bitcoin's store-of-value focus, SEND prioritizes community engagement. Its sustainable tokenomics and decentralized approach set it apart from niche competitors.
What is the market cap and tokenomics of SEND?
SEND's market cap and detailed tokenomics information are not fully disclosed. Current circulating supply data is limited. For the most accurate and up-to-date tokenomics details, please refer to official project documentation.
Share
Content
Introduction: SEND's Market Position and Investment Value
I. SEND Price History Review and Current Market Status
II. Core Factors Affecting SEND's Future Price
2025 Outlook
2026-2028 Mid-term Outlook
2029-2030 Long-term Outlook
IV. SEND Professional Investment Strategy and Risk Management
V. SEND Potential Risks and Challenges
VI. Conclusions and Action Recommendations
FAQ
How to Buy Cryptocurrency


Trending Cryptocurrencies


2025 BYN Price Prediction: Analyzing Economic Factors and Market Trends for Belarus's Currency

2025 BAKE Price Prediction: Will This DeFi Token Rise to New Heights in the Crypto Market?
2025 EUL Price Prediction: Expert Analysis and Market Forecast for Euler Token

2025 IDEX Price Prediction: Expert Analysis and Market Forecast for the Coming Year

2025 STO Price Prediction: Expert Analysis and Market Forecast for the Upcoming Year

How Has the SwissCheese (SWCH) Price Surged 39.53% in 24 Hours?

How to Acquire Vesper (VSP) Tokens: A Comprehensive Guide

PAPARAZZI vs OP: The Ultimate Showdown Between Celebrity Photography and Original Content Creation

Simple Guide to Buying I-COIN (ICN) in Italy Securely

Exploring the World of Web3 and Blockchain Technology

Understanding GameFi: The Future of Gaming Platforms