2025 MAPO Price Prediction: Expert Analysis and Future Growth Potential for Map Protocol Token


Introduction: MAPO's Market Position and Investment Value
MAP Protocol (MAPO) serves as the interoperable layer for the Bitcoin network, built upon ZK light-clients and functioning as the gateway for Bitcoin ecosystem developers and users. Since its inception in 2019, the project has established itself as a critical infrastructure solution connecting different Bitcoin L2s with EVM and non-EVM ecosystems. As of December 2025, MAPO's market capitalization has reached approximately $24.47 million, with a circulating supply of around 6.14 billion tokens, trading at approximately $0.003984 per token.
This innovative protocol, recognized for enabling seamless Bitcoin ecosystem interoperability, continues to play an increasingly vital role in bridging fragmented blockchain networks and facilitating cross-ecosystem communication.
This article will provide a comprehensive analysis of MAPO's price trajectory through 2030, integrating historical performance patterns, market supply and demand dynamics, ecosystem development progress, and macroeconomic factors. Our objective is to deliver professional price forecasts and practical investment strategies for investors seeking to understand MAPO's long-term market potential and positioning opportunities within the evolving cryptocurrency landscape.
MAP Protocol (MAPO) Market Analysis Report
I. MAPO Price History Review and Market Status
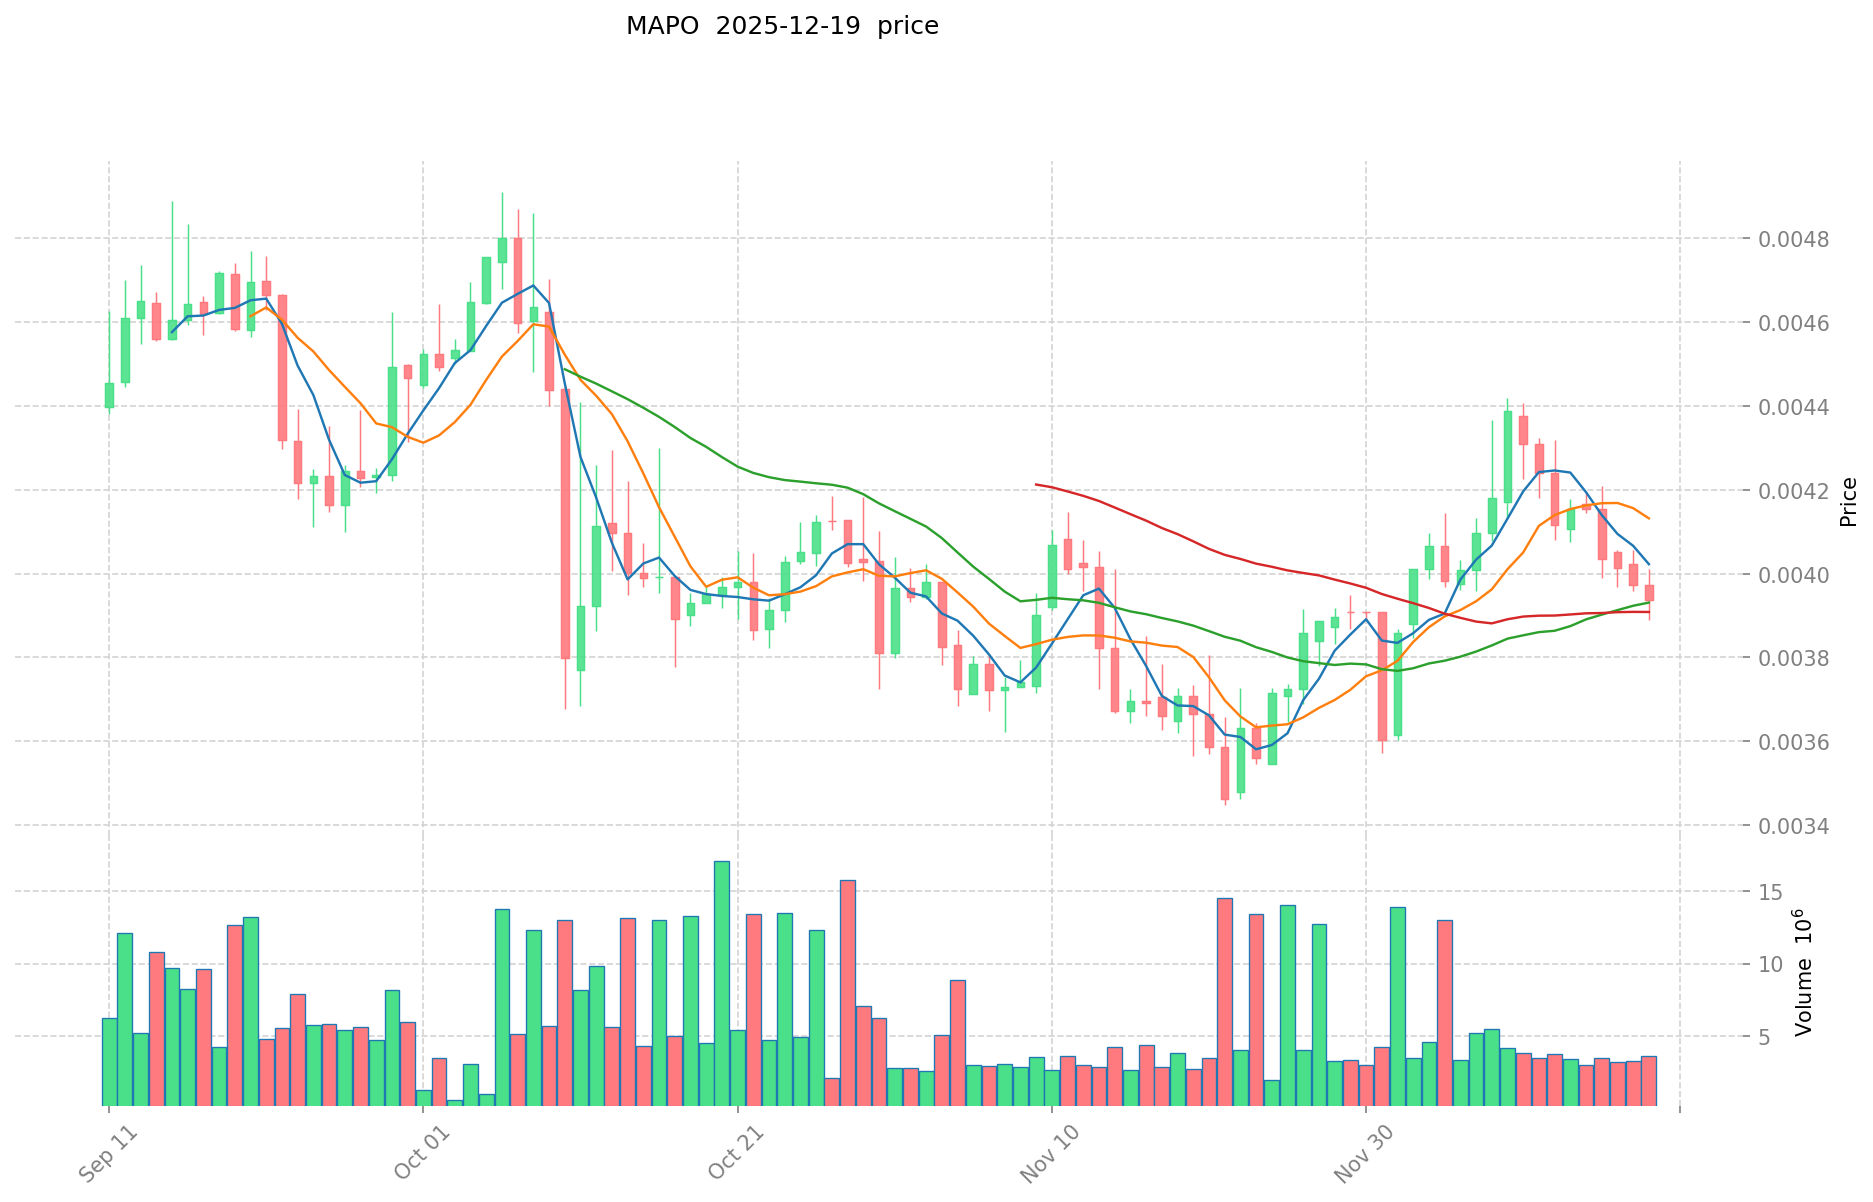
MAPO Historical Price Trajectory
MAP Protocol was published on November 8, 2019, at an initial price of $0.03707. Since its launch, MAPO has experienced significant price fluctuations:
- November 2019: Project launch at $0.03707
- March 2024: Reached all-time high (ATH) of $0.045 on March 14, 2024
- November 2025: Dropped to all-time low (ATL) of $0.003447 on November 21, 2025
Over the year-to-date period, MAPO has declined approximately 60.57% from its previous levels, reflecting substantial downward pressure in the market.
MAPO Current Market Dynamics
As of December 20, 2025, MAP Protocol is trading at $0.003984, with a 24-hour trading volume of $12,455.04. The token has experienced modest upward momentum in the short term, with a 24-hour price increase of 1.55%.
Key Market Metrics:
- Market Capitalization (Circulating): $24,474,958.57
- Fully Diluted Valuation (FDV): $38,633,740.38
- Circulating Supply: 6,143,312,894.26 MAPO (61.43% of total supply)
- Total Supply: 9,697,223,991 MAPO
- Maximum Supply: 10,000,000,000 MAPO
- Market Ranking: #783
Recent Price Performance:
- 1-hour change: -0.22%
- 7-day change: -2.4%
- 30-day change: +11.02%
- 1-year change: -60.57%
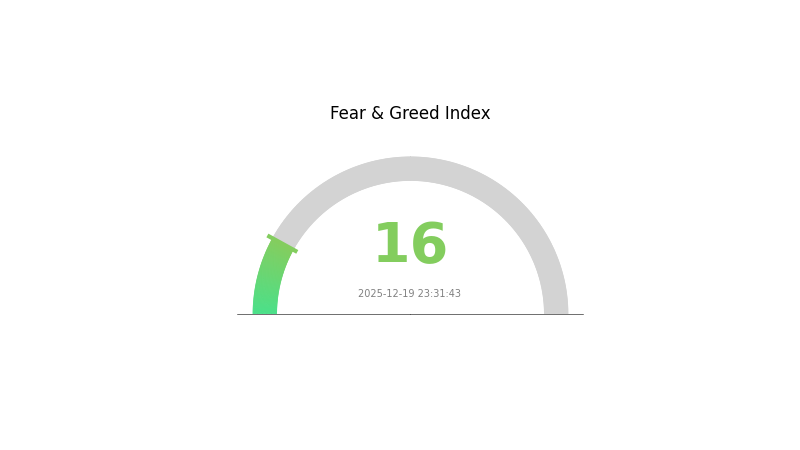
The 24-hour range shows MAPO trading between $0.003919 (low) and $0.004011 (high). Market sentiment remains cautious, with the broader market experiencing extreme fear conditions (VIX: 16).
Click to view current MAPO Market Price
MAPO Market Sentiment Index
2025-12-19 Fear and Greed Index: 16 (Extreme Fear)
Click to view current Fear & Greed Index
The cryptocurrency market is experiencing extreme fear with an index reading of 16, signaling significant market pessimism. Such readings typically indicate investors are highly risk-averse and sentiment has reached critical lows. This extreme fear environment often presents contrarian opportunities for experienced traders, as markets dominated by fear can be oversold. However, caution remains essential as further downside pressure may persist. Traders should exercise proper risk management and consider this period as both a warning signal and potential accumulation opportunity at discounted prices.
MAPO Holdings Distribution
The address holdings distribution chart represents a critical on-chain metric that visualizes the concentration of token ownership across the MAPO network. By mapping the cumulative distribution of holdings across wallet addresses, this indicator provides essential insights into the tokenomics structure, potential vulnerabilities to price manipulation, and the overall decentralization characteristics of the ecosystem. A more dispersed distribution typically indicates healthier market dynamics and reduced systemic risk, while concentrated holdings may signal liquidity vulnerabilities or centralization concerns.
However, based on the data provided, the holdings distribution table appears to be empty or incomplete, preventing a comprehensive quantitative analysis of MAPO's current concentration metrics. To conduct a thorough assessment of whether the token exhibits excessive concentration, we would need to examine the percentage allocation across top addresses, the Gini coefficient, and the ratio of holdings held by the largest stakeholders relative to total circulating supply. Without specific address data and their corresponding holdings percentages, it is not possible to determine whether MAPO demonstrates problematic concentration levels or maintains an appropriately distributed ownership structure.
A complete analysis would require visible address-level data showing the distribution pattern across top holders. Such information would enable evaluation of potential market structure risks, including susceptibility to coordinated whale movements, price volatility amplification, and the overall robustness of the decentralized network. When such data becomes available, monitoring this metric regularly will remain essential for assessing MAPO's long-term sustainability and market health.
Click to view current MAPO holdings distribution

| Top | Address | Holding Qty | Holding (%) |
|---|
II. Core Factors Influencing MAPO's Future Price
Supply Mechanism
- Token Buyback Program: MAP Protocol founders have announced a daily MAPO buyback plan, which reduces circulating supply through continuous token repurchases.
- Historical Pattern: Buyback mechanisms traditionally create upward price pressure by decreasing available supply while simultaneously generating demand through purchasing activities.
- Current Impact: The ongoing repurchase initiative signals strong developer confidence in the project and provides structural support for price stability by mechanically reducing the token float.
Macroeconomic Environment
- Monetary Policy Impact: Changes in central bank interest rates and monetary policy frameworks affect overall investment attractiveness and capital allocation to digital assets.
- Inflation Hedge Properties: MAPO demonstrates potential "digital gold" positioning characteristics, offering store-of-value appeal during inflationary environments.
- Geopolitical Factors: International uncertainty and geopolitical tensions may stimulate increased investment demand in decentralized protocols like MAP Protocol.
Three、2025-2030 MAPO Price Forecast
2025 Outlook
- Conservative Forecast: $0.00203-$0.00398
- Neutral Forecast: $0.00398
- Bullish Forecast: $0.00533 (requires sustained market momentum and positive ecosystem developments)
2026-2028 Medium-term Outlook
- Market Phase Expectations: Gradual recovery and consolidation phase with increasing institutional interest
- Price Range Predictions:
- 2026: $0.00368-$0.00601
- 2027: $0.00437-$0.00683
- 2028: $0.00444-$0.00803
- Key Catalysts: Protocol upgrades, increased adoption rates, improved market sentiment, and strategic partnerships driving utility expansion
2029-2030 Long-term Outlook
- Base Case Scenario: $0.00656-$0.01023 (assuming steady ecosystem growth and moderate market recovery)
- Bullish Scenario: $0.00705-$0.01023 (contingent on significant mainstream adoption and favorable regulatory environment)
- Transformation Scenario: $0.00864 average with potential peak of $0.00968 (under conditions of revolutionary protocol advancement and exponential user growth)
- 2030-12-20: MAPO trading near $0.00864 average (reflecting 116% cumulative appreciation from 2025 baseline)
| 年份 | 预测最高价 | 预测平均价格 | 预测最低价 | 涨跌幅 |
|---|---|---|---|---|
| 2025 | 0.00533 | 0.00398 | 0.00203 | 0 |
| 2026 | 0.00601 | 0.00466 | 0.00368 | 16 |
| 2027 | 0.00683 | 0.00533 | 0.00437 | 33 |
| 2028 | 0.00803 | 0.00608 | 0.00444 | 52 |
| 2029 | 0.01023 | 0.00705 | 0.00656 | 77 |
| 2030 | 0.00968 | 0.00864 | 0.00501 | 116 |
MAP Protocol (MAPO) Professional Investment Strategy and Risk Management Report
IV. MAPO Professional Investment Strategy and Risk Management
MAPO Investment Methodology
(1) Long-term Holding Strategy
- Target Investors: Institutional investors, blockchain infrastructure believers, and long-term cryptocurrency portfolio holders with 2-5 year investment horizons
- Operation Recommendations:
- Accumulate during market downturns when MAPO trades below $0.004, leveraging the 61.43% circulation ratio for sustained growth potential
- Hold through protocol upgrades and ecosystem expansion, as interoperability solutions typically appreciate over 3-5 year cycles
- Reinvest any staking rewards or protocol incentives to compound returns
(2) Active Trading Strategy
- Technical Analysis Tools:
- Support and Resistance Levels: Monitor key price points at $0.003919 (24h low) and $0.004011 (24h high) for entry and exit signals
- Volume Analysis: Track the 24h trading volume of approximately $12,455 USDT to identify breakout opportunities with volume confirmation
- Swing Trading Key Points:
- Execute buy signals when price approaches historical support levels with increasing volume
- Set take-profit targets at 8-15% gains given MAPO's moderate volatility profile
MAPO Risk Management Framework
(1) Asset Allocation Principles
- Conservative Investors: 1-2% portfolio allocation to MAPO, combined with 85-90% stable holdings
- Active Investors: 5-8% portfolio allocation, with regular rebalancing every 30 days
- Professional Investors: 10-15% allocation with hedging strategies and regular performance monitoring
(2) Risk Hedging Solutions
- Diversification Strategy: Combine MAPO holdings with established Layer 1 protocols to reduce concentration risk in emerging interoperability solutions
- Position Sizing: Implement stop-loss orders at 15-20% below entry price to limit downside exposure in volatile market conditions
(3) Secure Storage Solution
- Hot Wallet Option: Use Gate.com Web3 Wallet for frequent trading and active portfolio management with built-in security features
- Cold Storage Method: For holdings exceeding $10,000 equivalent value, transfer to hardware-secured wallets with multi-signature authentication
- Security Considerations: Never share private keys or recovery phrases, enable two-factor authentication on all exchange accounts, verify contract addresses before token transfers
V. MAPO Potential Risks and Challenges
MAPO Market Risk
- Price Volatility: MAPO experienced a 60.57% decline over the past year and trades 91.14% below its all-time high of $0.045 (reached March 14, 2024), indicating significant downside exposure and potential liquidity concerns
- Market Liquidity Risk: With 24h trading volume of only $12,455 across 7 exchanges, large position movements can significantly impact price discovery and execution capability
- Circulation Supply Pressure: At 61.43% of maximum supply already in circulation with 3.55 billion tokens remaining, future token releases could trigger selling pressure
MAPO Regulatory Risk
- Blockchain Classification Uncertainty: Evolving regulatory frameworks for interoperability protocols and Bitcoin layer 2 solutions may impact MAPO's legal status across jurisdictions
- Cross-Chain Compliance: Operating as an interoperability layer between multiple blockchain ecosystems exposes MAPO to conflicting regulations in different regions
- Protocol Governance Risk: Changes in Bitcoin network consensus or regulatory treatment of bridge solutions could affect MAPO's operational viability
MAPO Technical Risk
- Zero-Knowledge Proof Security: Reliance on ZK light-client technology introduces potential cryptographic vulnerabilities that haven't been fully stress-tested across extended timeframes
- Interoperability Protocol Risk: Complex cross-chain interactions between Bitcoin L2s, EVM, and non-EVM ecosystems create multiple failure points and security vectors
- Developer Adoption Uncertainty: Limited evidence of widespread developer adoption or killer applications utilizing MAPO's interoperability capabilities
VI. Conclusion and Action Recommendations
MAPO Investment Value Assessment
MAP Protocol addresses a critical infrastructure gap in Bitcoin ecosystem interoperability, positioning itself strategically between Bitcoin L2s and broader blockchain ecosystems. However, the 60.57% annual decline, significant distance from all-time highs, and minimal trading volume suggest the market has yet to price in substantial value from this technology. The project's success depends on achieving meaningful developer adoption and demonstrating clear use cases that drive protocol revenue and token demand. Current valuations reflect early-stage risk assessment with limited mainstream institutional interest.
MAPO Investment Recommendations
✅ Beginners: Start with a small position (0.5-1% of portfolio) through Gate.com's spot trading to understand the project before increasing exposure. Use limit orders around support levels to avoid FOMO-driven purchases during volatility spikes.
✅ Experienced Investors: Consider 5-8% allocation as a speculative holding with 15% stop-loss discipline. Monitor quarterly protocol developments and ecosystem partnerships as key valuation drivers. Rebalance positions quarterly to maintain target allocation.
✅ Institutional Investors: Evaluate 10-15% allocation within blockchain infrastructure fund mandates only after conducting comprehensive due diligence on zero-knowledge proof security audits and interoperability protocol stress tests. Establish relationships with core developers to assess roadmap execution likelihood.
MAPO Trading Participation Methods
- Gate.com spot trading: Trade MAPO/USDT or MAPO/USDC pairs with transparent pricing and competitive fees for immediate settlement
- DCA Strategy: Execute Dollar-Cost Averaging buys weekly or monthly to reduce timing risk and smooth entry prices across market cycles
- Portfolio Tracking: Use Gate.com's portfolio management tools to monitor MAPO performance against benchmark indices and rebalance according to predetermined allocations
Cryptocurrency investment carries extreme risk. This report does not constitute investment advice. Investors must make decisions based on their individual risk tolerance and are strongly advised to consult professional financial advisors. Never invest capital you cannot afford to lose completely.
FAQ
What is MAPO token and what is its use case?
MAPO token is the native currency of MAP Protocol used to pay transaction fees on the blockchain. It powers all on-chain actions and operations within the MAP ecosystem.
What is the price prediction for MAPO token in 2025?
Based on market analysis, MAPO token is predicted to reach between $0.00358 and $0.00533 in 2025. This forecast reflects potential growth driven by platform development and market adoption.
What factors could affect MAPO's future price performance?
MAPO's price is influenced by market sentiment, trading volume, technological advancements, ecosystem development, adoption rates, regulatory changes, and overall cryptocurrency market trends.
Share
Content
Introduction: MAPO's Market Position and Investment Value
I. MAPO Price History Review and Market Status
II. Core Factors Influencing MAPO's Future Price
Three、2025-2030 MAPO Price Forecast
IV. MAPO Professional Investment Strategy and Risk Management
V. MAPO Potential Risks and Challenges
VI. Conclusion and Action Recommendations
FAQ
How to Buy Cryptocurrency


Trending Cryptocurrencies


What is OLA: The Future of Electric Mobility in Urban Transportation

ZKL vs BCH: Comparing the Blockchain Innovations and Market Impact

Is Map Protocol (MAPO) a good investment?: A Comprehensive Analysis of Market Potential, Risk Factors, and Future Prospects in the Blockchain Ecosystem
Viction's Whitepaper Logic: Driving 75.6% Growth with Zero-Gas Innovations in 2025

GOAT Network (GOATED): Bitcoin ZK-Rollup With Native Yield

What is LA: The Ultimate Guide to Los Angeles' Culture and Attractions
Cryptocurrency Platform Showdown: Choosing the Best Exchange in 2024

How can on-chain data analysis reveal Bitcoin market trends through active addresses, transaction volume, and whale movements in 2025?

What is Cryptocurrency Mining? | Understanding The Process and Mechanisms

How Does Resolv (RESOLV) Maintain 50,000+ Active Users With 35% Network Growth and 56% Monthly Engagement Rate?

Understanding Polygon Addresses: Key Features and Functions in Crypto