2025 FUN Price Prediction: Expert Analysis and Market Forecast for the Coming Year


Introduction: FUN's Market Position and Investment Value
FUNToken (FUN), the leading iGaming token globally, has built a substantial community since its launch in 2016, accumulating over 350,000 investors and staking users worldwide. As of December 2025, FUN's market capitalization has reached approximately $19.22 million, with a circulating supply of approximately 10.60 billion tokens, maintaining a price around $0.001747. Operating on the Ethereum blockchain as a fast, transparent, and genuinely fair transactional solution, FUN is establishing itself as a cornerstone asset in the iGaming ecosystem.
This article will provide a comprehensive analysis of FUN's price movements and market trends, examining historical performance, market dynamics, ecosystem development, and macroeconomic factors to deliver professional price forecasts and actionable investment strategies for the period through 2030.
FUNToken (FUN) Market Analysis Report
I. FUN Price History Review and Current Market Status
FUN Historical Price Evolution
-
January 2018: FUNToken reached its all-time high (ATH) of $0.191066 on January 8, 2018, representing the peak valuation during the early iGaming token adoption phase.
-
March 2020: FUNToken hit its all-time low (ATL) of $0.00105506 on March 13, 2020, marking the lowest price point in the token's trading history.
FUN Current Market Position
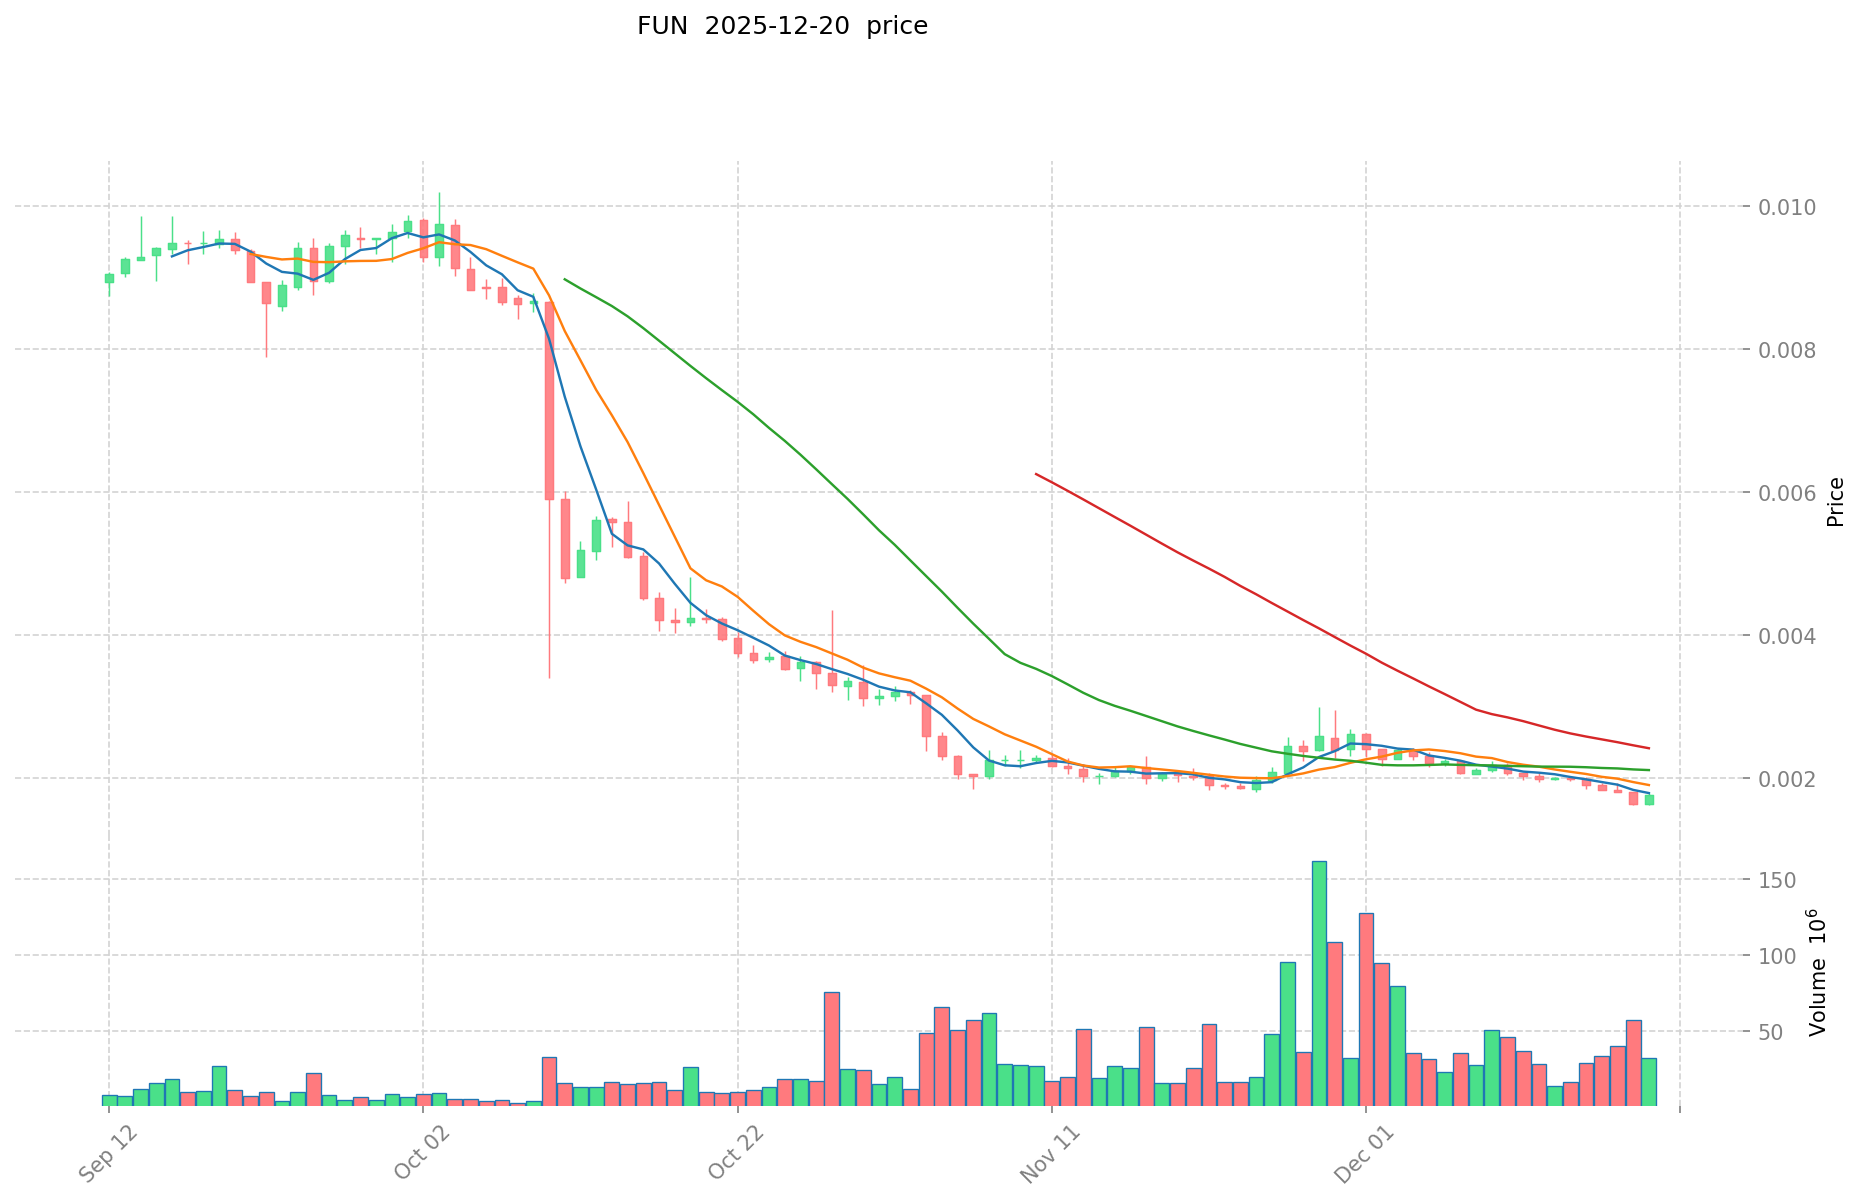
As of December 20, 2025, FUNToken is trading at $0.001747 with a 24-hour trading volume of $32,026.94. The token commands a market capitalization of approximately $18.52 million with a fully diluted valuation (FDV) of $19.22 million, ranking 898th in the overall cryptocurrency market by market cap.
The circulating supply stands at 10.60 billion FUN tokens out of a total supply of 10.99 billion tokens, with a circulation ratio of 96.35%. The token is actively traded across 22 different exchanges and maintained by approximately 99,113 token holders.
Recent Price Performance:
- 1-hour change: +0.69%
- 24-hour change: -0.73%
- 7-day change: -12.17%
- 30-day change: -17.05%
- 1-year change: -59.99%
The token has declined significantly from its historical peak, currently trading at approximately 0.91% of its all-time high, reflecting the challenging market conditions in the iGaming token sector over the extended period.
Click to view current FUN market price
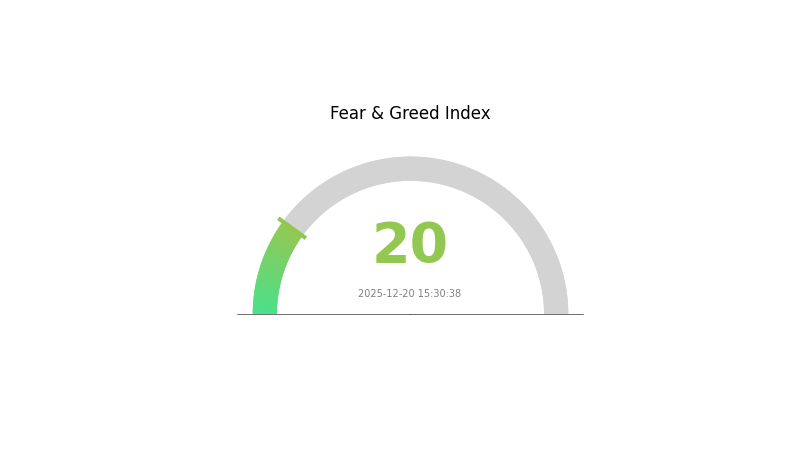
FUN Market Sentiment Index
2025-12-20 Fear and Greed Index: 20 (Extreme Fear)
Click to view the current Fear & Greed Index
The cryptocurrency market is currently experiencing extreme fear, with the Fear and Greed Index at just 20 points. This indicates significant market pessimism and risk aversion among investors. During periods of extreme fear, asset prices often reach attractive levels for long-term investors. However, caution is advised as volatility remains high. Monitor market developments closely before making investment decisions. Consider dollar-cost averaging strategies to mitigate timing risks during extreme sentiment swings.
FUN Holdings Distribution
The address holdings distribution chart represents the concentration of FUN tokens across the blockchain network, illustrating how token ownership is dispersed among individual wallets. This metric is crucial for assessing market decentralization, identifying potential risks associated with whale holdings, and understanding the overall health of the token's ecosystem structure.
FUN currently exhibits significant concentration risk, with the top address commanding 82.54% of total circulating supply, amounting to approximately 8.92 billion tokens. This extreme concentration in a single wallet substantially exceeds healthy decentralization thresholds and suggests potential centralized control over a dominant portion of the token supply. The subsequent top four addresses collectively hold only 3.46% of holdings, creating a dramatic disparity in wealth distribution. While the remaining addresses account for 14% of total supply, the aggregate distribution fails to counterbalance the predominance of the leading holder.
Such pronounced concentration presents considerable implications for market dynamics and price stability. The dominant holder possesses sufficient capital to materially influence token pricing through large-scale transactions, potentially enabling market manipulation through coordinated trading activities. Furthermore, the concentration pattern raises concerns regarding the token's true decentralization credentials, as decision-making influence becomes concentrated among a limited number of stakeholders. The asymmetric distribution also indicates elevated volatility risk, as sudden liquidation or strategic positioning by major holders could trigger substantial price fluctuations. This structure suggests the FUN ecosystem remains in an early or potentially controlled development phase, warranting cautious evaluation of on-chain governance dynamics.
Check current FUN holdings distribution

| Top | Address | Holding Qty | Holding (%) |
|---|---|---|---|
| 1 | 0xf977...41acec | 8920000.00K | 82.54% |
| 2 | 0xa9fe...fad499 | 204210.59K | 1.88% |
| 3 | 0xd720...c6b6f5 | 68315.49K | 0.63% |
| 4 | 0x9642...2f5d4e | 53440.43K | 0.49% |
| 5 | 0x04b2...891a88 | 50049.88K | 0.46% |
| - | Others | 1510185.28K | 14% |
II. Core Factors Influencing FUN's Future Price
Supply Mechanism
-
Automatic Migration to Raydium: FUN tokens on the Pump.fun platform start with an initial market cap of approximately $4,000. When the market cap reaches the $60,000 threshold, the platform automatically terminates internal trading and migrates tokens to Raydium, enabling broader market exposure.
-
Historical Pattern: Early investors who purchase FUN at low market cap stages on Pump.fun typically realize substantial gains during the migration to Raydium, as token exposure expands to a wider investor base. However, this migration point also represents a critical profit-taking opportunity, often triggering price corrections as early holders exit.
-
Current Impact: The supply mechanism creates a concentration of liquidity events at the $60,000 market cap threshold. This predictable transition point concentrates selling pressure, potentially limiting sustained price appreciation post-migration as first-movers prioritize profit realization.
Market Sentiment and Volatility Dynamics
-
Meme Market Activity: FUN's price is heavily influenced by broader Meme coin market sentiment. Meme coins currently function as a barometer for overall cryptocurrency market psychology, demonstrating significantly higher volatility and faster price reaction times compared to traditional crypto assets. During altcoin bear markets, Meme tokens represent one of the few active trading sectors in secondary markets.
-
Speculative Trading Trends: FUN's price movement is driven by speculative psychology cycles. The market has transitioned from FOMO-driven phases (early 2024) to more rational investor positioning, with participants increasingly implementing risk management strategies such as stop-loss orders and portfolio diversification.
-
Fraud Risk Premium: Approximately 95% of projects on the Pump.fun platform involve some form of fraud or deceptive practices, including soft rug pulls and wallet manipulation schemes. This systemic risk directly impacts price volatility and investor confidence in individual FUN tokens.
Solana Ecosystem Performance
-
Blockchain Efficiency: Pump.fun's emergence is intrinsically linked to Solana's rapid development as the dominant Meme coin infrastructure. Solana's high-speed, low-fee characteristics provide the optimal operating environment for Pump.fun's low-barrier token creation (requiring only 0.02 SOL to launch).
-
Ecosystem Correlation: FUN's price trajectory demonstrates correlation with Solana's network performance and adoption metrics. Increased Solana ecosystem activity directly translates to higher trading volumes and user engagement on Pump.fun, subsequently supporting FUN price momentum.
III. FUN Price Forecast for 2025-2030
2025 Outlook
- Conservative Forecast: $0.0013 - $0.00174
- Neutral Forecast: $0.00174
- Optimistic Forecast: $0.00226 (requires sustained market sentiment and increased adoption)
2026-2028 Medium-term Outlook
- Market Stage Expectations: Potential consolidation phase with gradual upward pressure as the asset establishes stronger market fundamentals and ecosystem development.
- Price Range Predictions:
- 2026: $0.00154 - $0.0021
- 2027: $0.00139 - $0.00283
- 2028: $0.00134 - $0.00278
- Key Catalysts: Expansion of use cases, strategic partnerships, improved liquidity on major platforms such as Gate.com, and broader cryptocurrency market recovery trends.
2029-2030 Long-term Outlook
- Base Case Scenario: $0.00209 - $0.00322 (assumes steady ecosystem growth and moderate market adoption)
- Optimistic Scenario: $0.00278 - $0.00396 (assumes significant partnership announcements and accelerated institutional interest)
- Transformation Scenario: $0.00383 and above (under conditions of breakthrough technological innovations, major ecosystem expansion, and sustained bull market conditions)
- December 20, 2025: FUN holding steady with projected cumulative gain of 49-84% by 2030 (demonstrates long-term recovery potential)
| 年份 | 预测最高价 | 预测平均价格 | 预测最低价 | 涨跌幅 |
|---|---|---|---|---|
| 2025 | 0.00226 | 0.00174 | 0.0013 | 0 |
| 2026 | 0.0021 | 0.002 | 0.00154 | 14 |
| 2027 | 0.00283 | 0.00205 | 0.00139 | 17 |
| 2028 | 0.00278 | 0.00244 | 0.00134 | 39 |
| 2029 | 0.00383 | 0.00261 | 0.00209 | 49 |
| 2030 | 0.00396 | 0.00322 | 0.00164 | 84 |
FUNToken (FUN) Professional Investment Strategy and Risk Management Report
IV. FUN Professional Investment Strategy and Risk Management
FUN Investment Methodology
(1) Long-Term Holding Strategy
-
Target Audience: Institutional investors and retail investors seeking exposure to the iGaming ecosystem
-
Operation Recommendations:
- Accumulate FUN tokens during market downturns to capitalize on the token's established utility within platforms like Freebitco.in, DPLAY, and XFUN
- Participate in staking opportunities within the FUN ecosystem to generate passive income, given the project's 350,000+ active staking users globally
- Maintain a 2-3 year investment horizon to benefit from potential ecosystem expansion and adoption growth in the iGaming sector
-
Storage Plan:
- Utilize Gate.com's native wallet solutions for secure token storage with integrated trading capabilities
- For larger holdings, consider self-custody options that provide direct control over private keys
- Implement multi-signature authentication for enhanced security of substantial FUN holdings
(2) Active Trading Strategy
-
Technical Analysis Tools:
- Support and Resistance Levels: Monitor key price levels at $0.191066 (all-time high) and $0.00105506 (all-time low) to identify potential breakout or reversal points
- Volume Analysis: Track the 24-hour trading volume of $32,026.94 against historical averages to confirm price movements and identify liquidity patterns
-
Wave Trading Key Points:
- Capitalize on the recent 7-day decline of -12.17% to identify potential entry points for mean reversion trades
- Utilize the 1-year downtrend of -59.99% to establish contrarian positions when oversold conditions emerge
- Monitor the 24-hour price range ($0.001722 to $0.001786) for intraday scalping opportunities
FUN Risk Management Framework
(1) Asset Allocation Principles
- Conservative Investors: 1-2% of portfolio allocation
- Active Investors: 3-5% of portfolio allocation
- Professional/Institutional Investors: 5-10% of portfolio allocation
(2) Risk Hedging Solutions
- Diversification Strategy: Balance FUN holdings with other established cryptocurrencies to reduce concentration risk in the specialized iGaming sector
- Stop-Loss Implementation: Set predetermined exit points at 15-20% below entry price to protect capital during adverse market movements
- Position Sizing: Limit individual trade sizes to 2-3% of total portfolio to ensure losses remain manageable during volatile periods
(3) Secure Storage Solutions
- Hot Wallet Option: Gate.com Web3 Wallet provides secure, user-friendly token management with seamless integration for trading and staking activities
- Cold Storage Plan: Transfer significant FUN holdings to hardware-secured wallets for long-term safekeeping, accessible only when needed for transactions
- Security Considerations: Enable two-factor authentication on all exchange accounts, maintain backup recovery phrases in secure offline locations, and never share private keys or seed phrases with third parties
V. FUN Potential Risks and Challenges
FUN Market Risks
- Price Volatility: FUN has experienced significant historical volatility, with a -59.99% decline over the past year and a -17.05% decline over 30 days, indicating substantial downside risk exposure
- Liquidity Constraints: With only 22 exchange listings and relatively modest 24-hour trading volume, FUN faces potential liquidity challenges during market stress periods
- Market Cap Concentration: At a current market capitalization of $18.52 million (ranked #898 globally), FUN remains a relatively small-cap token vulnerable to manipulation and rapid value deterioration
FUN Regulatory Risks
- Gaming Industry Regulation: The iGaming sector faces evolving regulatory frameworks across different jurisdictions, which could impact FUN's utility and adoption rates
- Cryptocurrency Classification: Future regulatory actions by governments could classify gaming tokens differently, affecting their legal status and trading permissions
- Jurisdictional Restrictions: Users in certain regions may face limitations on accessing iGaming platforms utilizing FUN, reducing the addressable market
FUN Technology Risks
- Blockchain Dependency: As an Ethereum-based token, FUN is subject to Ethereum network congestion and gas fee fluctuations that could impact transaction efficiency
- Smart Contract Vulnerabilities: Any undiscovered vulnerabilities in the token's underlying smart contracts could pose security risks to holder assets
- Ecosystem Platform Risk: The viability of FUN depends heavily on the continued operation and development of partner platforms like Freebitco.in, DPLAY, and XFUN
VI. Conclusion and Action Recommendations
FUN Investment Value Assessment
FUNToken presents a niche investment opportunity within the iGaming cryptocurrency space, supported by a substantial user base of 350,000+ investors and stakers globally. However, the token faces significant headwinds, including a 59.99% decline over the past year, limited exchange listings, and relatively modest market capitalization. While the token's integration within established gaming platforms provides genuine utility, investors should carefully weigh this against the speculative nature of the asset and its current downtrend. The 96.35% circulating supply ratio indicates mature distribution, which may limit upside potential. FUN is most suitable for investors with high risk tolerance seeking exposure to niche crypto applications rather than mainstream investment portfolios.
FUN Investment Recommendations
✅ Beginners: Start with micro-positions (0.5-1% of crypto portfolio) on Gate.com to understand iGaming token mechanics without significant capital exposure. Use dollar-cost averaging over 3-6 months to mitigate timing risk.
✅ Experienced Investors: Consider 3-5% allocations with active position management, combining long-term staking participation with tactical trading around identified support and resistance levels. Implement strict stop-loss disciplines at 15-20% below entry.
✅ Institutional Investors: Evaluate FUN as part of diversified alternative cryptocurrency exposure within gaming sector themes. Conduct thorough due diligence on platform partnerships and regulatory compliance before committing capital.
FUN Trading Participation Methods
- Gate.com Spot Trading: Execute FUN trades directly on Gate.com with competitive spreads and reliable liquidity for both entry and exit positions
- Staking Programs: Participate in FUN staking opportunities within the ecosystem to generate yield while maintaining long-term exposure to the token
- Platform Integration: Engage with FUN through native iGaming platforms like XFUN and Freebitco.in DPLAY to experience direct utility and gain deeper ecosystem understanding
Cryptocurrency investment carries extreme risk. This report does not constitute investment advice. Investors should make decisions based on their individual risk tolerance and are strongly encouraged to consult professional financial advisors. Never invest more capital than you can afford to lose completely.
FAQ
Will fun tokens reach $1 dollar?
FUNToken is not expected to reach $1 in the foreseeable future. Current price predictions estimate a maximum of around $0.003186, based on market analysis and historical data trends.
Does Fun Token have a future?
Yes. FUN Token's future is promising, driven by gaming adoption and ecosystem expansion. Its deflationary mechanism supports value retention, positioning it well for long-term growth in the gaming blockchain sector.
What factors influence FUN token price movements?
FUN token price is influenced by audited smart contracts, high staking rewards, trading volume, community support, market sentiment, and overall crypto market conditions.
How does FUN token compare to other similar projects in the market?
FUN token demonstrates superior trading volume and community engagement against comparable low-cap projects. It has achieved greater market visibility and traction, with performance metrics outpacing similar initiatives in the current landscape.
Share
Content
Introduction: FUN's Market Position and Investment Value
I. FUN Price History Review and Current Market Status
II. Core Factors Influencing FUN's Future Price
III. FUN Price Forecast for 2025-2030
IV. FUN Professional Investment Strategy and Risk Management
V. FUN Potential Risks and Challenges
VI. Conclusion and Action Recommendations
FAQ
How to Buy Cryptocurrency


Trending Cryptocurrencies


SWO vs FLOW: The Battle of Efficiency Measurement Tools in Software Development

2025 OKB Price Prediction: Analyzing Market Trends and Future Potential of OKB Token in the Crypto Ecosystem

pi price prediction

2025 LUNC Price Prediction: Will Terra Luna Classic Reach $1 After Recent Market Recovery?
KARRAT vs ADA: Comparing Two Leading AI Models for Natural Language Understanding and Generation

Is Vanar (VANRY) a good investment?: A Comprehensive Analysis of Risk and Potential Returns
How to Purchase Bitcoin (BTC) in Turkey Safely and Easily

Beginners Guide to Selecting a Secure Crypto Wallet in 2025
Understanding Why Bitcoin Holds Value: Key Price Drivers Explored

Getting Started Guide for Solana NFT Collectors
Comprehensive Guide to Buying Zebec Network Tokens Safely