2025 EPIC Price Prediction: Expert Analysis and Market Forecast for the Coming Year

Introduction: EPIC's Market Position and Investment Value
Epic Chain (EPIC) is positioning itself as one of the fastest-growing Real-World Asset (RWA) ecosystems in Web3, operating across over 150 countries globally. Since its launch, the project has established a comprehensive infrastructure dedicated to building the world's first RWA superstructure, integrating individuals and institutions across major asset classes from consumer goods to capital markets.
As of December 20, 2025, EPIC has achieved a market capitalization of $18,339,000 with a circulating supply of 30,000,000 tokens, currently trading at approximately $0.6113. This innovative RWA-focused asset is playing an increasingly pivotal role in bridging traditional finance with decentralized Web3 infrastructure.
This article will provide a comprehensive analysis of EPIC's price trajectory through 2030, combining historical price patterns, market supply dynamics, ecosystem development, and macroeconomic factors to deliver professional price forecasts and practical investment strategies for investors seeking exposure to the growing RWA sector.
I. EPIC Price History Review and Market Status
EPIC Historical Price Evolution
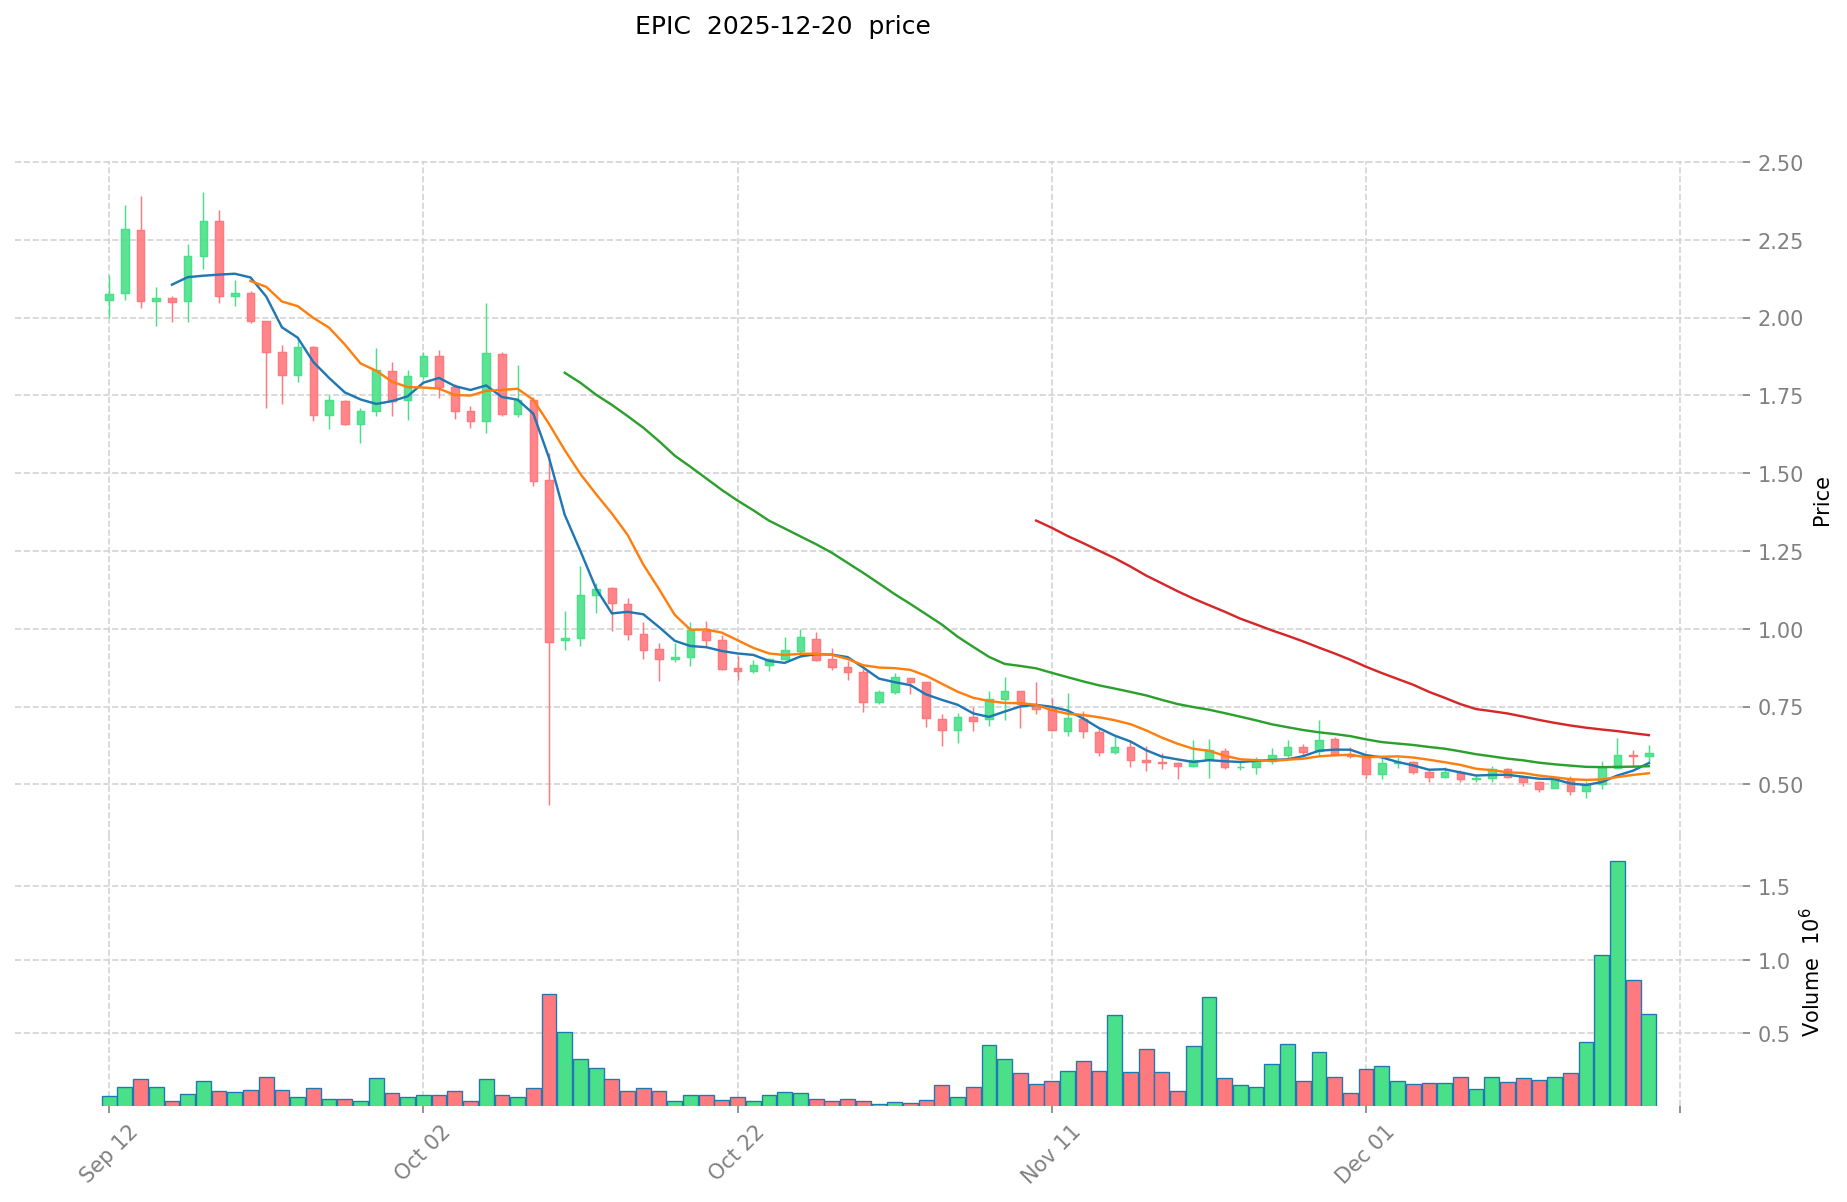
- August 20, 2025: All-time high of $3.20 reached, marking peak market enthusiasm for the Epic Chain RWA ecosystem expansion.
- December 16, 2025: All-time low of $0.460678 recorded, reflecting significant market correction and consolidation phase.
- December 20, 2025: Current price stabilized at $0.6113, representing a recovery of approximately 32.6% from the recent low.
EPIC Current Market Dynamics
As of December 20, 2025, EPIC is trading at $0.6113 with a market capitalization of $18.339 million. The token demonstrates mixed short-term momentum with a 1.5% gain over the past 24 hours, while showing strong recovery potential with a 24.5% increase over the 7-day period. However, the 1-hour performance reflects slight downward pressure at -0.18%, and monthly performance shows a marginal decline of -0.91%.
The 24-hour trading volume stands at $248,251.18, with price range between $0.5894 (24h low) and $0.6248 (24h high). EPIC maintains a fully diluted valuation equal to its market cap at $18.339 million, indicating 100% circulation of the token supply. With 30 million EPIC tokens in circulation against an unlimited maximum supply, the token is distributed across approximately 9,600 holders.
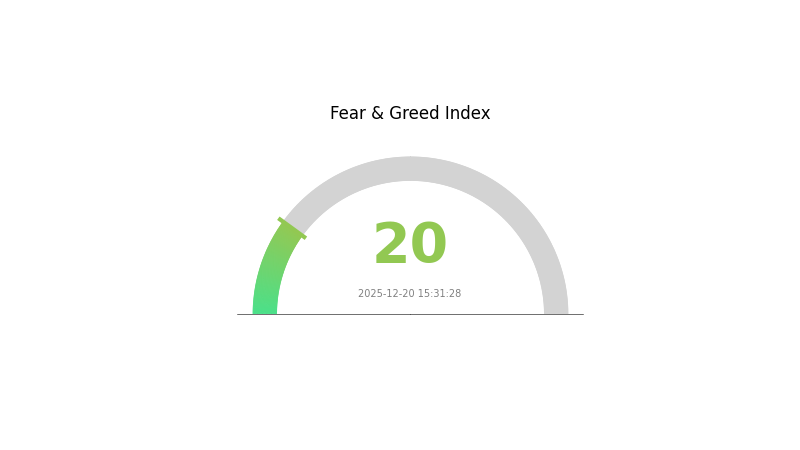
Market sentiment remains at extreme fear level (VIX: 20), reflecting broader market uncertainty. The token is available for trading on 20 exchanges, including Gate.com, providing adequate liquidity and accessibility for market participants.
Click to view current EPIC market price
EPIC Market Sentiment Index
2025-12-20 Fear and Greed Index: 20 (Extreme Fear)
Click to view the current Fear & Greed Index
The crypto market is experiencing extreme fear conditions with the Fear and Greed Index at 20. This unusually low reading indicates severe investor pessimism and risk aversion across digital assets. During such periods, long-term investors often view market downturns as potential buying opportunities, while risk-averse traders may prefer to stay on the sidelines. Market volatility typically remains elevated under extreme fear conditions. Investors should carefully assess their risk tolerance and portfolio positioning before making trading decisions on Gate.com.
EPIC Holdings Distribution
The address holdings distribution map provides a comprehensive view of token concentration across the blockchain network, revealing how EPIC tokens are allocated among different wallet addresses. This metric is fundamental for assessing network decentralization, identifying potential concentration risks, and understanding the structural dynamics of the token's ecosystem. By examining the top holders and their respective ownership percentages, analysts can evaluate the degree to which control and influence are distributed across the network.
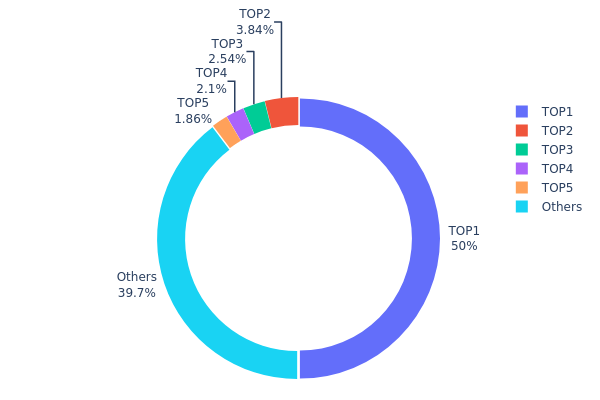
EPIC currently exhibits pronounced concentration characteristics in its holdings structure. The top holder (0xf977...41acec) commands a substantial 50.00% of total token supply, representing 15,000.00K tokens. This level of concentration is notably significant, with the top five addresses collectively accounting for approximately 60.31% of all EPIC tokens in circulation. While the remaining 39.69% of tokens are dispersed across numerous other addresses, the dominance of the leading holder introduces considerable structural imbalance. Such concentration patterns are typical in projects with established institutional stakeholders or treasury management systems, yet they warrant careful monitoring given their potential implications for market dynamics and governance autonomy.
The current distribution structure presents both opportunities and challenges for market participants. The highly concentrated nature of EPIC's holdings could influence price volatility patterns, particularly if major holders engage in significant liquidation or accumulation activities. The disparity between the top holder's dominant position and the more distributed holdings of secondary addresses reflects a tiered structure common in maturing cryptocurrency projects. This configuration suggests a market where large holder movements could generate notable market impact, while the fragmented nature of smaller holdings provides some degree of distributed participation. The overall structure indicates moderate-to-high centralization risk, requiring ongoing attention to holder behavior and potential market concentration effects.
For current EPIC Holdings Distribution, click here.
| Top | Address | Holding Qty | Holding (%) |
|---|---|---|---|
| 1 | 0xf977...41acec | 15000.00K | 50.00% |
| 2 | 0xa023...fc947e | 1152.27K | 3.84% |
| 3 | 0x377b...190873 | 761.09K | 2.53% |
| 4 | 0x1a9d...85a3e1 | 629.49K | 2.09% |
| 5 | 0xab78...3ee1bc | 557.48K | 1.85% |
| - | Others | 11899.67K | 39.69% |
II. Core Factors Impacting EPIC's Future Price
Technology Development and Ecosystem Building
-
Unreal Engine Revenue Model Evolution: Publishers have expressed concerns that Unreal Engine may suddenly increase its revenue sharing rates within five years. Even if favorable rates are offered for existing games, price increases would inevitably reduce future profits across all games, creating uncertainty around the platform's long-term economic viability.
-
Metaverse Integration: Epic maintains a strong commitment to metaverse development. Historical data from WeMeta shows significant appreciation in virtual land values, rising from a median price of $20 per square meter in 2017 to $6,000 in 2021, though current market conditions have moderated from these peaks. The metaverse ecosystem represents a potential growth avenue for EPIC token utility and ecosystem expansion.
-
Blockchain-based Digital Asset Ownership: According to market analysis, blockchain-based digital asset ownership is projected to contribute +1.4% impact on market compound annual growth rates globally over the medium-term (2-4 years), indicating growing integration of blockchain technology in gaming and digital asset markets.
Market Competition and Dynamics
The gaming industry demonstrates strong internal growth momentum, with projections showing annual growth rates of 9-10% and industry total value expanding from $195 billion to $300 billion over the next five years. However, EPIC faces competitive pressures in the digital distribution space, requiring continuous innovation in its ecosystem and platform offerings to maintain market positioning.
III. EPIC Price Forecast 2025-2030
2025 Outlook
- Conservative Forecast: $0.5361 - $0.6092
- Neutral Forecast: $0.6092 - $0.69449
- Optimistic Forecast: $0.69449 (pending market stabilization and ecosystem adoption)
2026-2027 Mid-term Outlook
- Market Stage Expectation: Growth phase with gradual market recovery and increased institutional participation
- Price Range Forecast:
- 2026: $0.33244 - $0.86695
- 2027: $0.69105 - $1.12391
- Key Catalysts: Expansion of EPIC's use cases, strengthened partnerships within the blockchain ecosystem, increased retail and institutional adoption, positive regulatory developments
2028-2030 Long-term Outlook
- Base Case Scenario: $0.54616 - $1.03582 (assuming steady ecosystem growth and moderate market expansion)
- Optimistic Scenario: $0.84043 - $1.15682 (with accelerated protocol adoption and strong market sentiment)
- Transformative Scenario: $0.83677 - $1.24442 (under conditions of breakthrough technological advancements, mainstream adoption, and macroeconomic tailwinds)
- December 20, 2030: EPIC reaches $1.24442 (projected peak valuation representing 75% cumulative growth from current baseline)
| 年份 | 预测最高价 | 预测平均价格 | 预测最低价 | 涨跌幅 |
|---|---|---|---|---|
| 2025 | 0.69449 | 0.6092 | 0.5361 | 0 |
| 2026 | 0.86695 | 0.65184 | 0.33244 | 6 |
| 2027 | 1.12391 | 0.7594 | 0.69105 | 24 |
| 2028 | 1.03582 | 0.94165 | 0.54616 | 54 |
| 2029 | 1.15682 | 0.98874 | 0.84043 | 61 |
| 2030 | 1.24442 | 1.07278 | 0.83677 | 75 |
Epic Chain (EPIC) Professional Investment Strategy and Risk Management Report
IV. EPIC Professional Investment Strategy and Risk Management
EPIC Investment Methodology
(1) Long-Term Holding Strategy
- Suitable Investors: RWA sector believers, long-term cryptocurrency portfolio builders, and institutional investors with multi-year investment horizons
- Operation Recommendations:
- Accumulate EPIC during market dips, targeting positions during 20-30% corrections from resistance levels
- Hold through market cycles, recognizing Epic Chain's position as one of the fastest-growing RWA ecosystems operating across 150+ countries
- Reinvest any rewards or gains to compound returns over extended periods
(2) Active Trading Strategy
- Price Action Analysis:
- Monitor 24-hour volatility patterns: Currently EPIC shows +1.5% daily movement with 7-day appreciation of 24.5%, indicating active market interest
- Track support/resistance levels around the 24-hour range of $0.5894-$0.6248
- Wave Trading Key Points:
- Identify entry opportunities when price consolidates near historical support levels
- Set profit targets at resistance zones established during intraday trading sessions
- Manage positions using the 2% stop-loss rule relative to entry price
EPIC Risk Management Framework
(1) Asset Allocation Principles
- Conservative Investors: 1-2% of portfolio maximum, given EPIC's market cap position at #904
- Active Investors: 2-5% of portfolio, allowing meaningful exposure to RWA sector growth
- Professional Investors: 5-10% of portfolio with hedging strategies and derivative positions
(2) Risk Hedging Solutions
- Portfolio Diversification: Combine EPIC holdings with established RWA projects and traditional cryptocurrency assets to reduce concentration risk
- Position Sizing: Use fixed percentage risk model, limiting losses per trade to no more than 1% of total capital
(3) Secure Storage Solution
- Self-Custody Approach: Store EPIC tokens on personal wallet addresses where you maintain private key control
- Security Best Practices: Use hardware security modules, multi-signature wallets, and cold storage solutions for significant holdings
- Safety Considerations: Never share private keys or seed phrases; verify contract addresses on Etherscan before any transactions; be cautious of phishing attempts targeting RWA token holders
V. EPIC Potential Risks and Challenges
EPIC Market Risk
- Extreme Volatility: Year-to-date performance shows -75.22% decline, indicating significant price compression and potential liquidation cascades during market stress
- Liquidity Risk: With 24-hour volume of $248,251 against a market cap of $18.34 million, token liquidity can become constrained during rapid selling pressure
- Market Cap Dependency: As a smaller-cap token (#904 ranking), EPIC remains vulnerable to reduced investor interest and capital flight
EPIC Regulatory Risk
- RWA Regulatory Uncertainty: Real-world asset tokenization remains in nascent regulatory frameworks across jurisdictions; changes in securities law could impact EPIC's business model
- Cross-Border Compliance: Operating in 150+ countries exposes Epic Chain to varying regulatory regimes, potentially requiring significant operational adjustments
- Cryptocurrency Restriction Risk: Future regulatory restrictions on cryptocurrency infrastructure could limit EPIC's utility and adoption
EPIC Technical Risk
- Smart Contract Vulnerability: As an ERC-20 token on Ethereum, EPIC is exposed to potential smart contract bugs, upgrade risks, and network-level vulnerabilities
- Blockchain Dependency: Epic Chain's functionality depends entirely on Ethereum network stability; network congestion or security issues directly impact operations
- Technology Obsolescence: RWA infrastructure is rapidly evolving; Epic Chain must continuously update technology to remain competitive and functional
VI. Conclusion and Action Recommendations
EPIC Investment Value Assessment
Epic Chain represents an interesting exposure to the growing RWA ecosystem, which has attracted significant institutional attention. However, investors should recognize that EPIC has experienced substantial drawdowns (-75.22% over one year), indicating significant price discovery and volatility. The project's operation across 150+ countries and focus on building a global RWA superstructure presents compelling long-term potential, yet execution risks remain material. The token's current market cap of $18.34 million reflects relatively early-stage development, making this a speculative holding suitable only for risk-tolerant investors with conviction in RWA sector maturation.
EPIC Investment Recommendations
✅ Beginners: Start with minimal positions (0.5-1% of portfolio) using Gate.com platform for easy access and execution. Focus on understanding Epic Chain's RWA infrastructure before considering position increases.
✅ Experienced Investors: Implement dollar-cost averaging strategy during volatility spikes, targeting accumulation during 20-30% pullbacks. Maintain strict position sizing discipline and use technical analysis to optimize entry points.
✅ Institutional Investors: Conduct comprehensive due diligence on Epic Chain's regulatory compliance across jurisdictions and establish clear exit strategies. Consider EPIC as component of broader RWA sector allocation rather than standalone investment.
EPIC Trading Participation Methods
- Gate.com Spot Trading: Execute buy/sell orders directly on Gate.com's spot market with real-time order execution for EPIC/USDT and EPIC/ETH pairs
- Dollar-Cost Averaging: Implement automated recurring purchases on Gate.com to accumulate EPIC over time, reducing timing risk
- Technical Trading: Utilize Gate.com's advanced charting tools and trading features to execute swing trading strategies based on identified resistance/support levels
Cryptocurrency investment carries extreme risk. This report does not constitute investment advice. Investors should make decisions based on their individual risk tolerance and consult professional financial advisors. Never invest more capital than you can afford to lose completely.
FAQ
What is the price prediction for Epic?
Epic Chain is predicted to trend downward, potentially dipping to $0.4519 by December 22, 2025. Current price prediction stands at $0.5894, with bearish momentum expected in the near term.
Why is Epic Chain falling?
Epic Chain's price declined 4.981% to $2.24 in August 2025 due to strategic shifts in healthcare and tokenization initiatives, including the launch of MyChart Central platform expansion.
What factors affect Epic price prediction?
Epic price prediction is influenced by supply and demand dynamics, protocol upgrades, macroeconomic conditions like interest rates, market sentiment, transaction volume, and community adoption trends.
Is Epic a good investment for 2024-2025?
Epic shows strong technical indicators and promising market potential for 2024-2025. Based on current trend analysis, it presents attractive investment opportunities. Monitor market developments and make informed decisions based on latest data.
What is the historical price performance of Epic?
Epic Chain has demonstrated fluctuating price movements recently. In late October 2025, prices ranged from $0.8617 to $0.9886, showing modest volatility. The asset continues trading within this dynamic range with varying trading volume activity.
Share
Content
Introduction: EPIC's Market Position and Investment Value
I. EPIC Price History Review and Market Status
II. Core Factors Impacting EPIC's Future Price
III. EPIC Price Forecast 2025-2030
IV. EPIC Professional Investment Strategy and Risk Management
V. EPIC Potential Risks and Challenges
VI. Conclusion and Action Recommendations
FAQ
How to Buy Cryptocurrency


Trending Cryptocurrencies


ONDO vs DYDX: Comparing Two Innovative DeFi Protocols in the Evolving Crypto Landscape
2025 CHEX Price Prediction: Analyzing Market Trends and Potential Growth Factors

How Does VELO's Circulating Supply of 175.64 Billion Affect Its Market Dynamics?

2025 CBL Price Prediction: Analyzing Market Trends and Potential Growth Factors
How Will TOAD's Fundamental Analysis Impact Its Price in 2025?

Trump Coin 2025: Investment Guide and Price Analysis

What is B3: Understanding Brazil's Stock Exchange and Investment Opportunities
What is GRIFFAIN: A Comprehensive Guide to Understanding This Revolutionary Technology Platform

What is ZKJ: A Comprehensive Guide to Zero-Knowledge Proof Technology and Its Applications

What is STORJ: A Comprehensive Guide to Decentralized Cloud Storage and Blockchain Technology
Understanding Token Pairing in Decentralized Exchange Liquidity Pools